
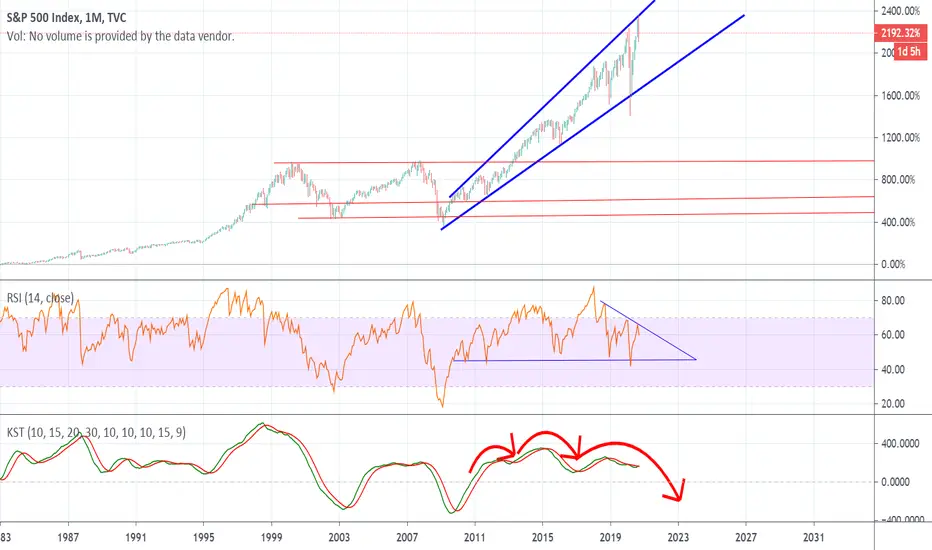
The S&P 500 is forming a rising channel or ascending channel marked by two blue parallel uptrend lines.
Most stocks typically continue to channel until either trend line is broken.
An upside break is a signal that buying intensity has increased, while a downside break indicates an end to the short-term uptrend.
On the RSI there's a noticeable divergence, the blue downward sloping line of resistance will need to be purged to the upside before the pattern finishes or there's likely going to be a heinous correction if the pattern finishes bearishly.
The KST is trying to cross bullishly over the red line but has been rejected multiple times upon close observation, I've outlined a possible H&S pattern that will occur unless we see a bullish cross on the KST.
Most stocks typically continue to channel until either trend line is broken.
An upside break is a signal that buying intensity has increased, while a downside break indicates an end to the short-term uptrend.
On the RSI there's a noticeable divergence, the blue downward sloping line of resistance will need to be purged to the upside before the pattern finishes or there's likely going to be a heinous correction if the pattern finishes bearishly.
The KST is trying to cross bullishly over the red line but has been rejected multiple times upon close observation, I've outlined a possible H&S pattern that will occur unless we see a bullish cross on the KST.

Pernyataan Penyangkalan
Informasi dan publikasi ini tidak dimaksudkan, dan bukan merupakan, saran atau rekomendasi keuangan, investasi, trading, atau jenis lainnya yang diberikan atau didukung oleh TradingView. Baca selengkapnya di Ketentuan Penggunaan.
Pernyataan Penyangkalan
Informasi dan publikasi ini tidak dimaksudkan, dan bukan merupakan, saran atau rekomendasi keuangan, investasi, trading, atau jenis lainnya yang diberikan atau didukung oleh TradingView. Baca selengkapnya di Ketentuan Penggunaan.