
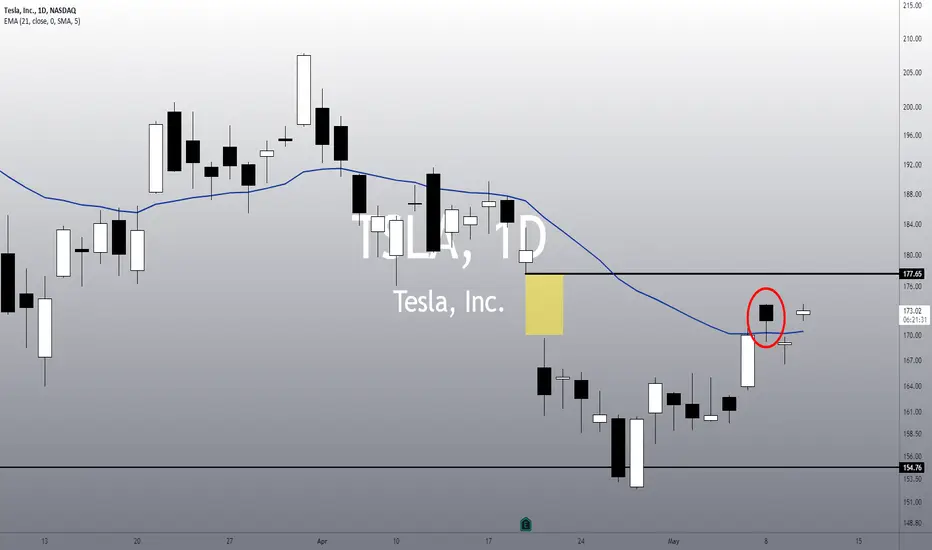
• TSLA stock looks impressive, as it is doing an important reaction today, trying to reject the Hanging Man candlestick pattern from Monday;
• In theory a Hanging Man pattern is a famous top signal, however, evidence suggests that this pattern acts as a bullish continuation roughly 59% of the time (BULKOWSKI, Thomas. Encyclopedia of Candlestick Patterns, p. 365);
• Now, TSLA is trying to resume the bullish momentum. To reject any possible top signal, it is important to see it breaking Monday’s high as soon as possible - otherwise, it might lose momentum;
• What’s more, it seems it is heading to its next technical target, the open gap at $177.

• The weekly chart suggests a bounce to higher levels, maybe to the purple trend line again;
• This thesis will be valid as long as the daily chart maintains its bullish bias, and keeps above its 21 ema;
I’ll keep you updated on this. Remember to follow me to keep in touch with my daily analysis.
• In theory a Hanging Man pattern is a famous top signal, however, evidence suggests that this pattern acts as a bullish continuation roughly 59% of the time (BULKOWSKI, Thomas. Encyclopedia of Candlestick Patterns, p. 365);
• Now, TSLA is trying to resume the bullish momentum. To reject any possible top signal, it is important to see it breaking Monday’s high as soon as possible - otherwise, it might lose momentum;
• What’s more, it seems it is heading to its next technical target, the open gap at $177.
• The weekly chart suggests a bounce to higher levels, maybe to the purple trend line again;
• This thesis will be valid as long as the daily chart maintains its bullish bias, and keeps above its 21 ema;
I’ll keep you updated on this. Remember to follow me to keep in touch with my daily analysis.

Pernyataan Penyangkalan
Informasi dan publikasi ini tidak dimaksudkan, dan bukan merupakan, saran atau rekomendasi keuangan, investasi, trading, atau jenis lainnya yang diberikan atau didukung oleh TradingView. Baca selengkapnya di Ketentuan Penggunaan.
Pernyataan Penyangkalan
Informasi dan publikasi ini tidak dimaksudkan, dan bukan merupakan, saran atau rekomendasi keuangan, investasi, trading, atau jenis lainnya yang diberikan atau didukung oleh TradingView. Baca selengkapnya di Ketentuan Penggunaan.