
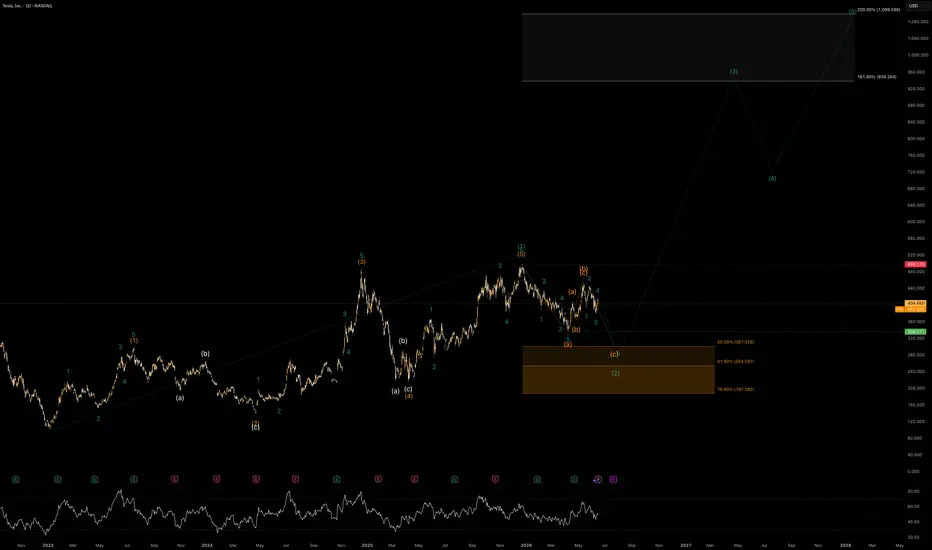
Tesla continues to display a very interesting long-term Elliott Wave structure. Based on the chart, the larger picture suggests that TSLA is developing within a major bullish impulsive sequence, while the current weakness is best interpreted as a corrective phase rather than the start of a new bear market.
Higher Time Frame Structure
From the broader low, Tesla appears to have completed a large impulsive advance into the early-2025 peak. That advance can be interpreted as a completed higher-degree wave b, followed by a sharp corrective decline into the spring 2025 low, which likely completed wave b.
From that spring 2025 low, price started another impulsive recovery. This rally unfolded in a clear five-wave structure and topped near the January 2026 high around the 498 region. That move is best counted as wave b of a new larger bullish cycle, or alternatively as the final subdivision of a larger impulsive leg. In either case, the structure from the low into the 2026 high looks impulsive and supports the view that the long-term trend remains constructive.
Current Market Phase – Corrective Wave (2)
Since the January 2026 high, TSLA appears to be in a corrective wave b. The decline is not yet showing the same clean impulsive strength as the previous rally, which supports the interpretation that this move is corrective in nature.
The current correction seems to be unfolding as an A-B-C structure:
Wave (a) started the initial decline from the high.
Wave (b) produced a temporary recovery.
Wave (c) now appears to be the active leg, with potential to complete the entire wave b correction.
Internally, the structure also shows smaller impulsive subdivisions within the decline, which is typical for a C-wave. This means the market may still need one more downward leg before the correction is fully mature.
Key Support / Fibonacci Reversal Zone
The chart highlights an important retracement area for the potential end of wave b. This zone lies roughly between:
50.0% retracement: 301
61.8% retracement: 254
78.6% retracement: 187
From an Elliott Wave perspective, the 301–254 area is the most attractive zone for a medium-term wave b termination. It would represent a typical corrective retracement after a completed wave b. A deeper extension toward 187 is still possible, but that would be a more aggressive correction and would likely require broader market weakness.
As long as TSLA remains above the origin of the larger impulsive advance, the bullish higher-time-frame structure remains valid.
Bullish Outlook After the Correction
If TSLA completes wave b inside the marked support zone, the next expected phase would be wave b. In Elliott Wave theory, third waves are usually the strongest and most dynamic part of the trend.
The projected upside path on the chart suggests the following roadmap:
Wave (3) could extend toward the 938 region
After that, a corrective wave (4) could follow
A final wave (5) could later push toward the 1,099 region
This projection is based on the typical extension behavior of third waves and the long-term bullish structure shown on the chart.
Confirmation Levels
For the bullish scenario to gain confirmation, TSLA should show:
a clear basing structure inside the Fibonacci support zone
a bullish impulsive rebound from that area
and eventually a break back above the recent corrective highs
A recovery back above the 498 area would strongly confirm that wave b has likely ended and that wave b is underway.
Risk / Alternative Scenario
The main risk to the bullish count is that the correction becomes deeper and more complex than expected. If price slices through the 50% and 61.8% retracement levels without a convincing reaction, then the market may be heading toward the deeper 78.6% retracement near 187.
That would not automatically destroy the long-term bullish count, but it would delay the expected bullish continuation and weaken short-term sentiment significantly.
Conclusion
TSLA appears to be in a larger bullish Elliott Wave structure, with the current decline best viewed as a wave (2) correction following a completed impulsive wave b into the January 2026 high.
The most important area to watch is the 301–254 support zone, where wave b could complete. If buyers step in there and price begins to recover impulsively, Tesla could be setting up for a powerful wave (3) advance with long-term upside potential toward 938 and possibly 1,099.
For now, the larger bullish scenario remains favored, but in the short term, patience is required until the current corrective structure is fully completed.
Higher Time Frame Structure
From the broader low, Tesla appears to have completed a large impulsive advance into the early-2025 peak. That advance can be interpreted as a completed higher-degree wave b, followed by a sharp corrective decline into the spring 2025 low, which likely completed wave b.
From that spring 2025 low, price started another impulsive recovery. This rally unfolded in a clear five-wave structure and topped near the January 2026 high around the 498 region. That move is best counted as wave b of a new larger bullish cycle, or alternatively as the final subdivision of a larger impulsive leg. In either case, the structure from the low into the 2026 high looks impulsive and supports the view that the long-term trend remains constructive.
Current Market Phase – Corrective Wave (2)
Since the January 2026 high, TSLA appears to be in a corrective wave b. The decline is not yet showing the same clean impulsive strength as the previous rally, which supports the interpretation that this move is corrective in nature.
The current correction seems to be unfolding as an A-B-C structure:
Wave (a) started the initial decline from the high.
Wave (b) produced a temporary recovery.
Wave (c) now appears to be the active leg, with potential to complete the entire wave b correction.
Internally, the structure also shows smaller impulsive subdivisions within the decline, which is typical for a C-wave. This means the market may still need one more downward leg before the correction is fully mature.
Key Support / Fibonacci Reversal Zone
The chart highlights an important retracement area for the potential end of wave b. This zone lies roughly between:
50.0% retracement: 301
61.8% retracement: 254
78.6% retracement: 187
From an Elliott Wave perspective, the 301–254 area is the most attractive zone for a medium-term wave b termination. It would represent a typical corrective retracement after a completed wave b. A deeper extension toward 187 is still possible, but that would be a more aggressive correction and would likely require broader market weakness.
As long as TSLA remains above the origin of the larger impulsive advance, the bullish higher-time-frame structure remains valid.
Bullish Outlook After the Correction
If TSLA completes wave b inside the marked support zone, the next expected phase would be wave b. In Elliott Wave theory, third waves are usually the strongest and most dynamic part of the trend.
The projected upside path on the chart suggests the following roadmap:
Wave (3) could extend toward the 938 region
After that, a corrective wave (4) could follow
A final wave (5) could later push toward the 1,099 region
This projection is based on the typical extension behavior of third waves and the long-term bullish structure shown on the chart.
Confirmation Levels
For the bullish scenario to gain confirmation, TSLA should show:
a clear basing structure inside the Fibonacci support zone
a bullish impulsive rebound from that area
and eventually a break back above the recent corrective highs
A recovery back above the 498 area would strongly confirm that wave b has likely ended and that wave b is underway.
Risk / Alternative Scenario
The main risk to the bullish count is that the correction becomes deeper and more complex than expected. If price slices through the 50% and 61.8% retracement levels without a convincing reaction, then the market may be heading toward the deeper 78.6% retracement near 187.
That would not automatically destroy the long-term bullish count, but it would delay the expected bullish continuation and weaken short-term sentiment significantly.
Conclusion
TSLA appears to be in a larger bullish Elliott Wave structure, with the current decline best viewed as a wave (2) correction following a completed impulsive wave b into the January 2026 high.
The most important area to watch is the 301–254 support zone, where wave b could complete. If buyers step in there and price begins to recover impulsively, Tesla could be setting up for a powerful wave (3) advance with long-term upside potential toward 938 and possibly 1,099.
For now, the larger bullish scenario remains favored, but in the short term, patience is required until the current corrective structure is fully completed.

Pernyataan Penyangkalan
Informasi dan publikasi ini tidak dimaksudkan, dan bukan merupakan, saran atau rekomendasi keuangan, investasi, trading, atau jenis lainnya yang diberikan atau didukung oleh TradingView. Baca selengkapnya di Ketentuan Penggunaan.
Pernyataan Penyangkalan
Informasi dan publikasi ini tidak dimaksudkan, dan bukan merupakan, saran atau rekomendasi keuangan, investasi, trading, atau jenis lainnya yang diberikan atau didukung oleh TradingView. Baca selengkapnya di Ketentuan Penggunaan.