
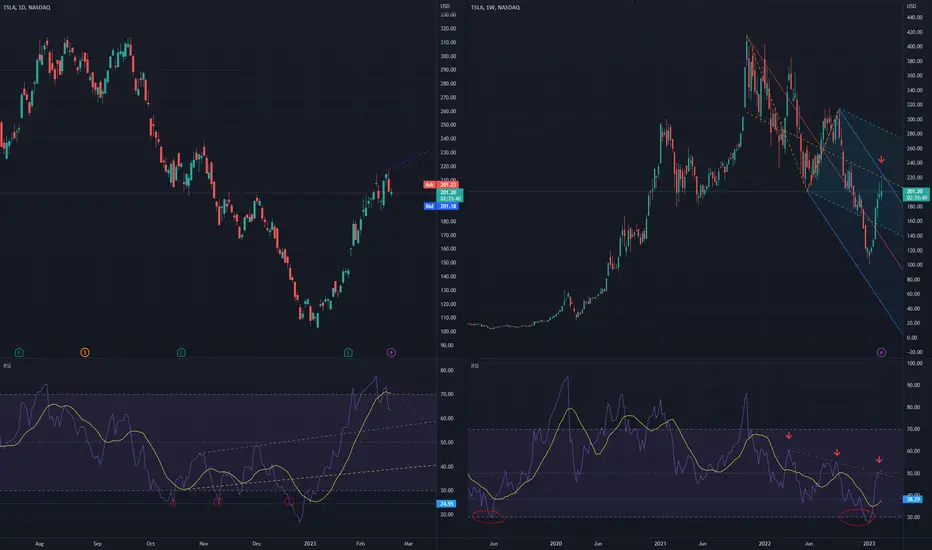
On weekly chart the price (almost) reached both the solid blue top pitchfork line and the middle orange pitchfork lines. Additionally, weekly RSI reached the dotted green resistance trendline. These are all bearish signs.
On daily chart, RSI has a bearish head-and-shoulders pattern and there is also a divergence between RSI (with purple trendline pointing downwards) and the PRICE (the purple trendline poingint upwards). Again, these are bearsih signs.
My previous TSLA idea was bullish and it went up 54% (from 137.80 to 212.11 when I gave the close signal), see related idea.
On daily chart, RSI has a bearish head-and-shoulders pattern and there is also a divergence between RSI (with purple trendline pointing downwards) and the PRICE (the purple trendline poingint upwards). Again, these are bearsih signs.
My previous TSLA idea was bullish and it went up 54% (from 137.80 to 212.11 when I gave the close signal), see related idea.
Trading ditutup: target tercapai
TSLA went down 16% (from 201.20 to 173.50). Now it seems ready to go up again, see related idea.
Join free discord.gg/wDTkRnS or t.me/TradersForecast
Publikasi terkait
Pernyataan Penyangkalan
Informasi dan publikasi ini tidak dimaksudkan, dan bukan merupakan, saran atau rekomendasi keuangan, investasi, trading, atau jenis lainnya yang diberikan atau didukung oleh TradingView. Baca selengkapnya di Ketentuan Penggunaan.
Join free discord.gg/wDTkRnS or t.me/TradersForecast
Publikasi terkait
Pernyataan Penyangkalan
Informasi dan publikasi ini tidak dimaksudkan, dan bukan merupakan, saran atau rekomendasi keuangan, investasi, trading, atau jenis lainnya yang diberikan atau didukung oleh TradingView. Baca selengkapnya di Ketentuan Penggunaan.