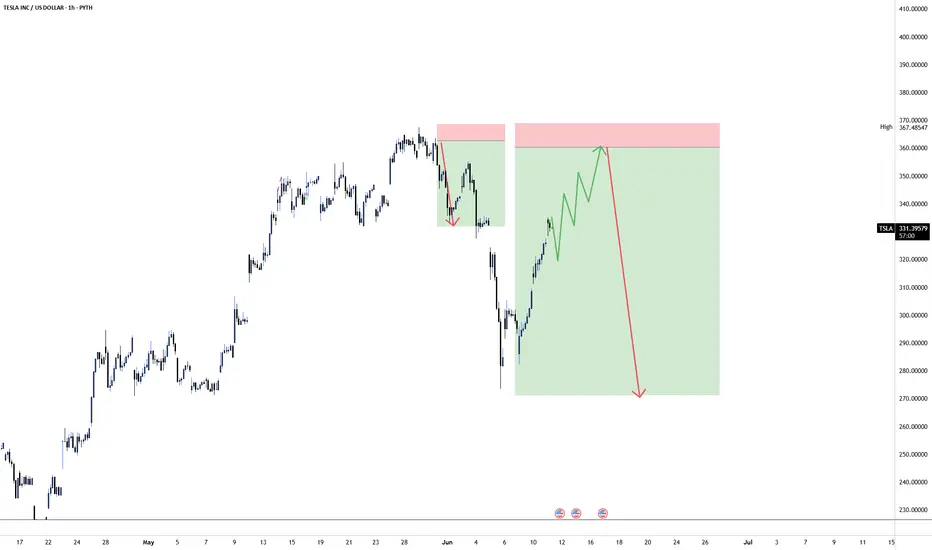
Key Technical Levels & Structure
1. 1‑Hour Chart — Uptrend and Resistance
TSLA has been in an ascending channel since April, with recent support around $274–280 on the 4‑h chart
On the 1‑hour, momentum is strong—macros like RSI, MACD, moving averages are all bullish (e.g., the 50‑hour MA is supporting around $330) .
2. Resistance Cluster ~ $357–360
That zone corresponds with prior swing highs and psychological resistance.
A push to $357.82 fits as a logical next target if TSLA maintains this bullish momentum.
3. Liquidity Grab Below
You anticipate a drop from that level to sweep stops and gather buy liquidity—common in breakout strategies.
Price could revisit intraday pivots—like the $330–335 zone or deeper around $320 on drop—which aligns with previous VWAP or double VWAP support regions noted in intraday setups .
1. 1‑Hour Chart — Uptrend and Resistance
TSLA has been in an ascending channel since April, with recent support around $274–280 on the 4‑h chart
On the 1‑hour, momentum is strong—macros like RSI, MACD, moving averages are all bullish (e.g., the 50‑hour MA is supporting around $330) .
2. Resistance Cluster ~ $357–360
That zone corresponds with prior swing highs and psychological resistance.
A push to $357.82 fits as a logical next target if TSLA maintains this bullish momentum.
3. Liquidity Grab Below
You anticipate a drop from that level to sweep stops and gather buy liquidity—common in breakout strategies.
Price could revisit intraday pivots—like the $330–335 zone or deeper around $320 on drop—which aligns with previous VWAP or double VWAP support regions noted in intraday setups .

"LIVE TRADE" Everyday on youtube.com/@Prosignalai
Pernyataan Penyangkalan
Informasi dan publikasi ini tidak dimaksudkan, dan bukan merupakan, saran atau rekomendasi keuangan, investasi, trading, atau jenis lainnya yang diberikan atau didukung oleh TradingView. Baca selengkapnya di Ketentuan Penggunaan.
"LIVE TRADE" Everyday on youtube.com/@Prosignalai
Pernyataan Penyangkalan
Informasi dan publikasi ini tidak dimaksudkan, dan bukan merupakan, saran atau rekomendasi keuangan, investasi, trading, atau jenis lainnya yang diberikan atau didukung oleh TradingView. Baca selengkapnya di Ketentuan Penggunaan.