TSLA 4H: Is the Correction Over?TSLA: The Next Move — Bullish Recovery or Deeper Correction?
Reading time: ~2 minutes
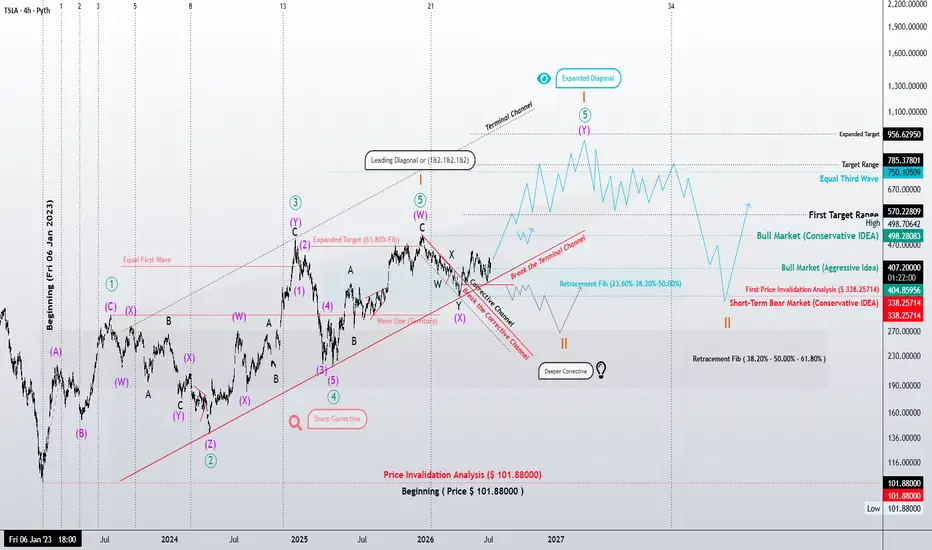
The higher-degree structure provides the broader context, but the 4H chart may reveal how the next piece of the puzzle develops.
🟢 Bullish Case — Turquoise Path
The bullish interpretation allows for a Leading D

TSLA 4H: Extended Leading Diagonal or a Deeper Correction?
"Price is the consequence. Structure is the cause."
This four-hour structural analysis of Tesla (TSLA) examines the market through the principles of Elliott Wave Theory. Rather than forecasting price alone, the objective is to determine the market's current position within the larger wave structur
TLong
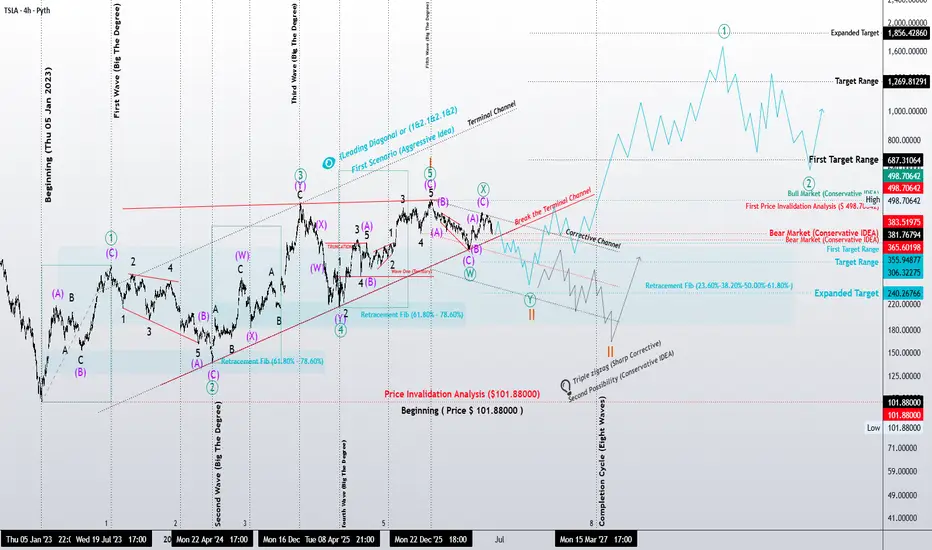
TSLA: Structural Roadmap – Diagonal vs. Nested Extensions“Price is the outcome; Structure is the cause.”
This 4-hour structural decomposition of Tesla (TSLA) identifies a high-probability bullish expansion, characterized by sophisticated wave nesting and geometric alignment.
Primary Thesis: Aggressive Expansion
The current structure is interpreted as e
TLong
$TSLA — Long Algo Trade Plan |Fri 5/29/26 NASDAQ:TSLA — Long Algo Trade Plan | Thu 5/28/26 close, 16:21 PT | 15m
Setup: TTR system flipped BUY at the close (~441) off the late-day dip into channel midline. The ascending channel from the 5/20 low at 407 is intact through today's print. Multi-day structure says continuation; intraday flow e
TLong

TSLA — SMC Structure Map — Fri 5/29/26TSLA — SMC Structure Map — Fri 5/29/26
15m, spot $437.68 (-0.43%). Clean uptrend off the $402 base — stacked BOS the whole way up. Now stalled into premium.
THE MAP:
- Premium supply: $441–443 (rejecting here now)
- Weak high / liquidity: $452.55 — EQH cluster = resting liquidity above
- Spot: $43
TLong

$TSLA — Out of the Danger Zone | Thu 5/28/26, 10:51 ET | 15mNASDAQ:TSLA — Out of the Danger Zone | Thu 5/28/26, 10:51 ET | 15m
The morning "SELL" was the buy. The open flush to 437.6 tagged a SELL signal — and that's exactly where the algos (mine included) printed BUY. Liquidity grab, not a top. TP already hit on the reclaim to 441.5.
What changed structu

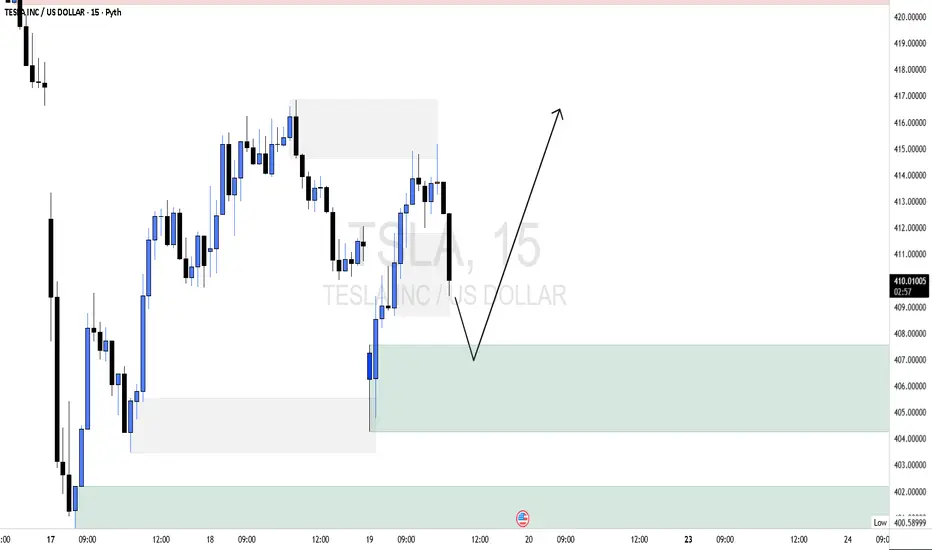
TSLA LongTesla Inc. (TSLA) – 15M Analysis
Broader Market Structure
On the 15-minute timeframe, structure is currently short-term bearish within a broader intraday range.
Price previously rallied into the 415–416 region and failed to break higher. From there, we saw a clear impulsive move down that broke mi
TLong
$TSLA crash about to happen...not the carCurrent broadening pattern in play with regression to the mean.

TSLA ShortOn TSLA (15m), the broader market structure has been bearish overall, as shown by the strong selloff from the late-August highs above 367 into early September. Recently, however, price formed a CHoCH at 357.48, signaling that buyers managed to regain temporary control after defending mid-range deman
TShort
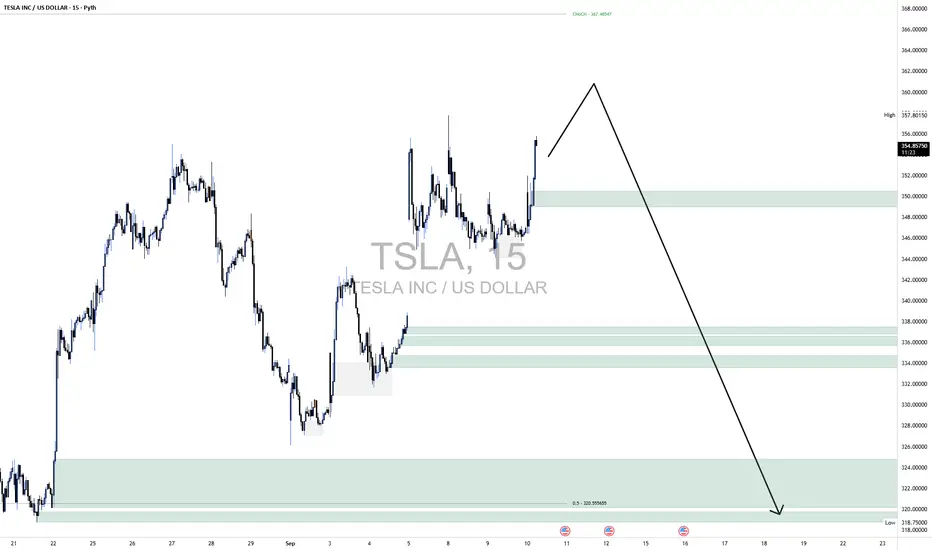
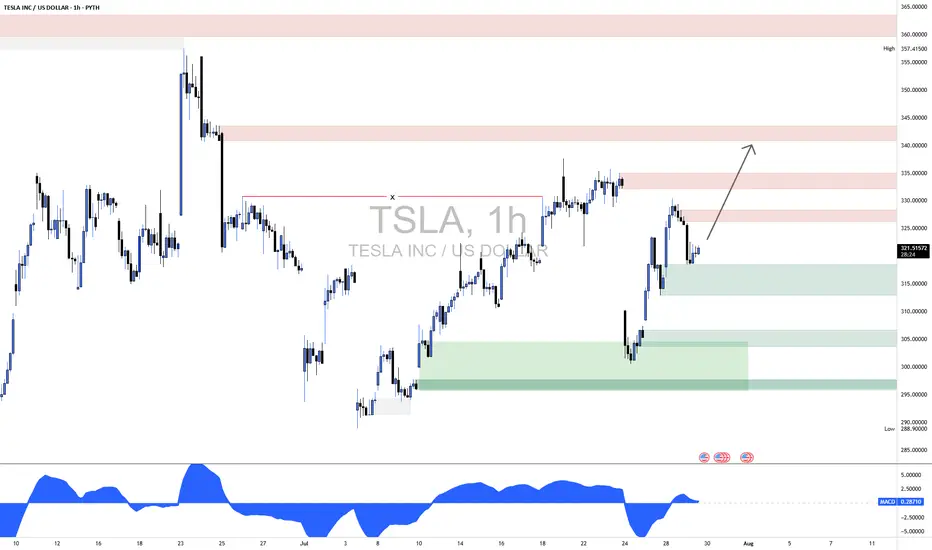
TSLA Long1. Market Structure Overview
1.1 Previous High Sweep (Fakeout) – ~357.41
Price made a strong push above previous highs but was sharply rejected.
Indicates potential liquidity grab and institutional selling.
1.2 Change of Character (CHoCH) – ~333
Price broke below the previous higher low structur
TLong
See all ideas
Displays a symbol's price movements over previous years to identify recurring trends.