TSLA 4H: Is the Correction Over?TSLA: The Next Move — Bullish Recovery or Deeper Correction?
Reading time: ~2 minutes
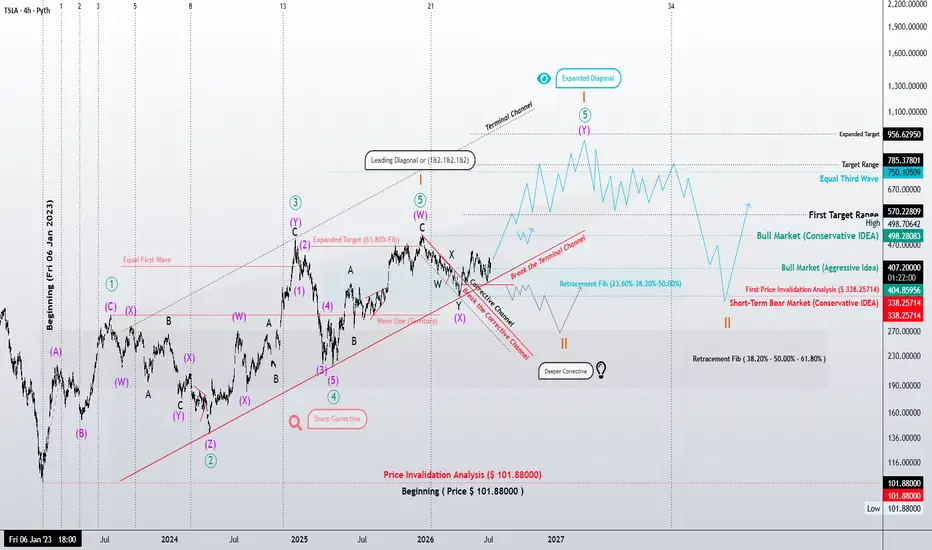
The higher-degree structure provides the broader context, but the 4H chart may reveal how the next piece of the puzzle develops.
🟢 Bullish Case — Turquoise Path
The bullish interpretation allows for a Leading Diagonal or potentially nested 1–2 structures.
The decline may be developing as a Double Zigzag within a corrective channel, with its overall size approaching equality with the previous corrective mov
In-depth trading ideas

TSLA 4H: Extended Leading Diagonal or a Deeper Correction?
"Price is the consequence. Structure is the cause."
This four-hour structural analysis of Tesla (TSLA) examines the market through the principles of Elliott Wave Theory. Rather than forecasting price alone, the objective is to determine the market's current position within the larger wave structure and identify the most probable path forward.
Primary Thesis — Extended Leading Diagonal
The preferred interpretation views the current structure as a Leading Diagonal exhibiting structural extensi
TLong
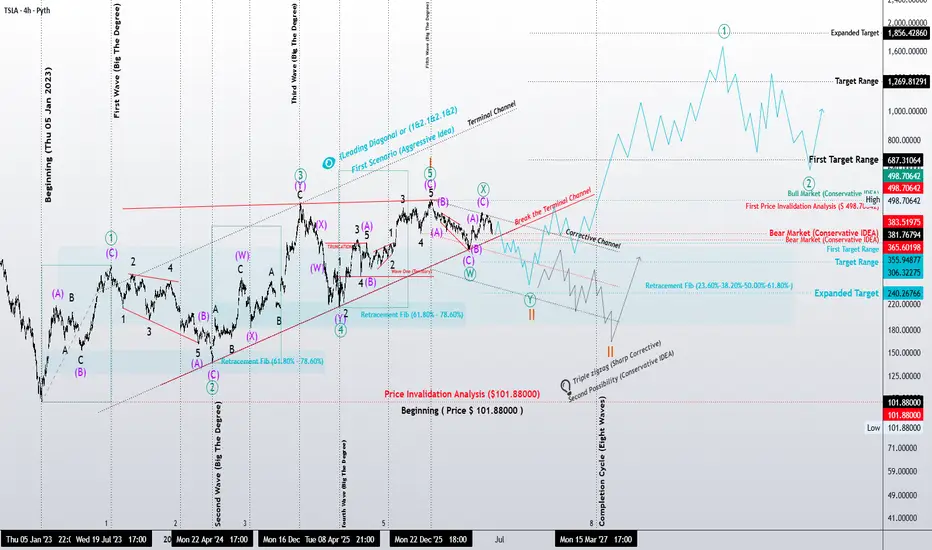
TSLA: Structural Roadmap – Diagonal vs. Nested Extensions“Price is the outcome; Structure is the cause.”
This 4-hour structural decomposition of Tesla (TSLA) identifies a high-probability bullish expansion, characterized by sophisticated wave nesting and geometric alignment.
Primary Thesis: Aggressive Expansion
The current structure is interpreted as either a Leading Diagonal or a series of Nested 1-2 Extensions (1&2.1&2.1&2). This signifies a powerful accumulation phase. Upon the definitive break of the Terminal Channel, the price is projected to
TLong
$TSLA — Long Algo Trade Plan |Fri 5/29/26 NASDAQ:TSLA — Long Algo Trade Plan | Thu 5/28/26 close, 16:21 PT | 15m
Setup: TTR system flipped BUY at the close (~441) off the late-day dip into channel midline. The ascending channel from the 5/20 low at 407 is intact through today's print. Multi-day structure says continuation; intraday flow earlier confirmed accumulation (+$3.7M net ask-side calls).
The gate (same level all week from three methods):
- 452.5 = prior 5/13 swing high + ChartPrime future-price tag + ~67% touch probability pe
TLong

TSLA — SMC Structure Map — Fri 5/29/26TSLA — SMC Structure Map — Fri 5/29/26
15m, spot $437.68 (-0.43%). Clean uptrend off the $402 base — stacked BOS the whole way up. Now stalled into premium.
THE MAP:
- Premium supply: $441–443 (rejecting here now)
- Weak high / liquidity: $452.55 — EQH cluster = resting liquidity above
- Spot: $437.68
- Demand OB: $430–431
- Equilibrium: ~$424
- Trend support: ~$410
SIGNAL: fresh CHoCH at the recent low — first short-term structure crack after the run. Momentum cooling at supply, not breaking
TLong

$TSLA — Out of the Danger Zone | Thu 5/28/26, 10:51 ET | 15mNASDAQ:TSLA — Out of the Danger Zone | Thu 5/28/26, 10:51 ET | 15m
The morning "SELL" was the buy. The open flush to 437.6 tagged a SELL signal — and that's exactly where the algos (mine included) printed BUY. Liquidity grab, not a top. TP already hit on the reclaim to 441.5.
What changed structurally:
- Broke above the descending resistance from the 5/27 445.50 high — the line that capped every push this week.
- That line is now below price = flipped to support. Right side of the level that

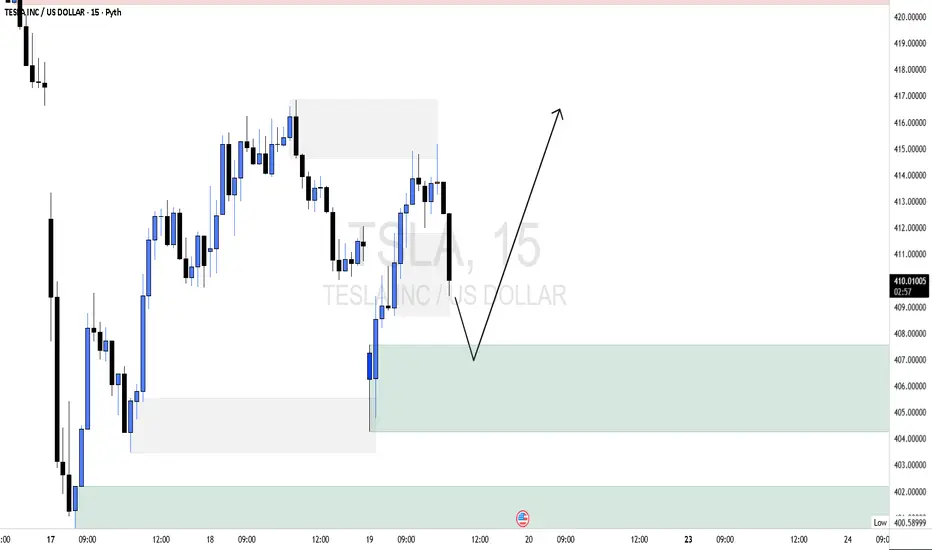
TSLA LongTesla Inc. (TSLA) – 15M Analysis
Broader Market Structure
On the 15-minute timeframe, structure is currently short-term bearish within a broader intraday range.
Price previously rallied into the 415–416 region and failed to break higher. From there, we saw a clear impulsive move down that broke minor internal support around 412.00, confirming a Break of Structure (BOS) to the downside on the intraday level. That BOS suggests short-term continuation lower rather than immediate upside expansion.
TLong
$TSLA crash about to happen...not the carCurrent broadening pattern in play with regression to the mean.

TSLA ShortOn TSLA (15m), the broader market structure has been bearish overall, as shown by the strong selloff from the late-August highs above 367 into early September. Recently, however, price formed a CHoCH at 357.48, signaling that buyers managed to regain temporary control after defending mid-range demand. This structural shift suggests a short-term bullish correction within a larger bearish context.
The supply zones overhead near 357–360 remain untested and strong, as this is where sellers previous
TShort
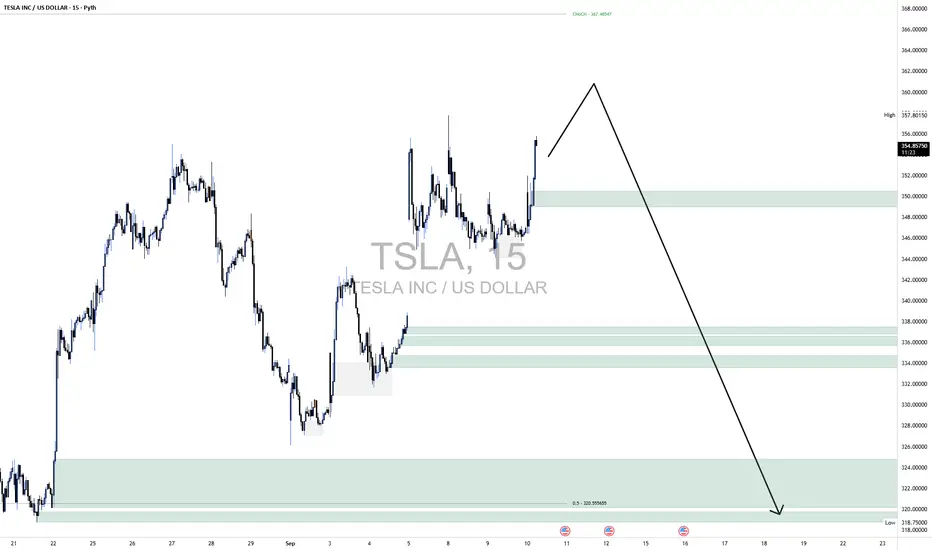
TSLA Long1. Market Structure Overview
1.1 Previous High Sweep (Fakeout) – ~357.41
Price made a strong push above previous highs but was sharply rejected.
Indicates potential liquidity grab and institutional selling.
1.2 Change of Character (CHoCH) – ~333
Price broke below the previous higher low structure, signaling the end of bullish momentum.
Marks a bearish shift after an extended uptrend.
1.3 Break of Structure (BOS) – ~317
Confirms bearish continuation after CHoCH.
Price closed below support
TLong
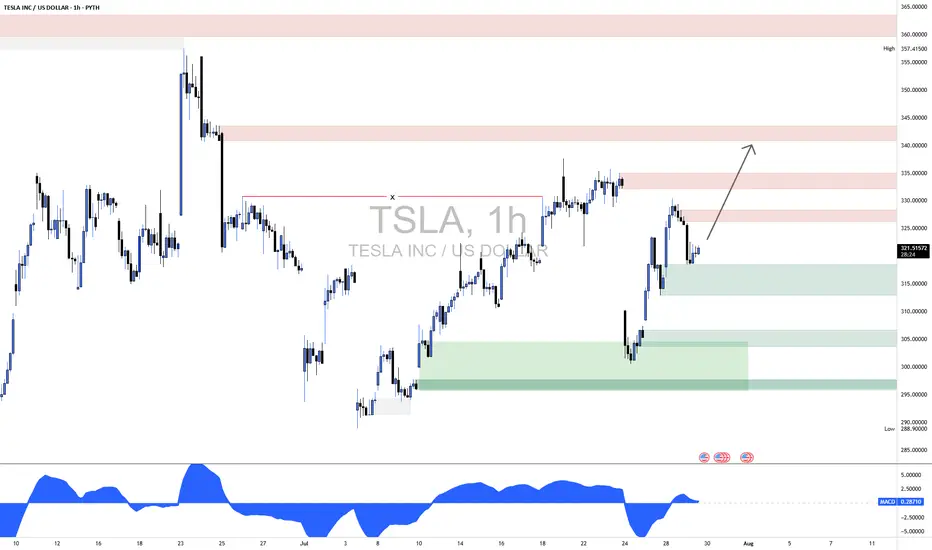
TSLA – Macro Roadmap + VolanX Forecast Confluence📈 TSLA – Macro Roadmap + VolanX Forecast Confluence
Tesla continues to obey our Smart Money Concepts (SMC) + Elliott Wave roadmap, with price rebounding from the (C) correction zone. VolanX DSS and QuanT v3.0 both signal a medium-confidence bullish bias short-term, aligning with our wave count for a new 5-wave structure targeting the $420 zone.
🔍 Technical Outlook (WaverVanir DSS)
📊 Price held above 295.20 demand zone (discount reentry)
⚡️ ABC correction complete, BOS confirmed
🟧 Impulse wa
TLong

TSLA Key Technical Levels & Structure
1. 1‑Hour Chart — Uptrend and Resistance
TSLA has been in an ascending channel since April, with recent support around $274–280 on the 4‑h chart
On the 1‑hour, momentum is strong—macros like RSI, MACD, moving averages are all bullish (e.g., the 50‑hour MA is supporting around $330) .
2. Resistance Cluster ~ $357–360
That zone corresponds with prior swing highs and psychological resistance.
A push to $357.82 fits as a logical next target if TSLA maintains th
TShort
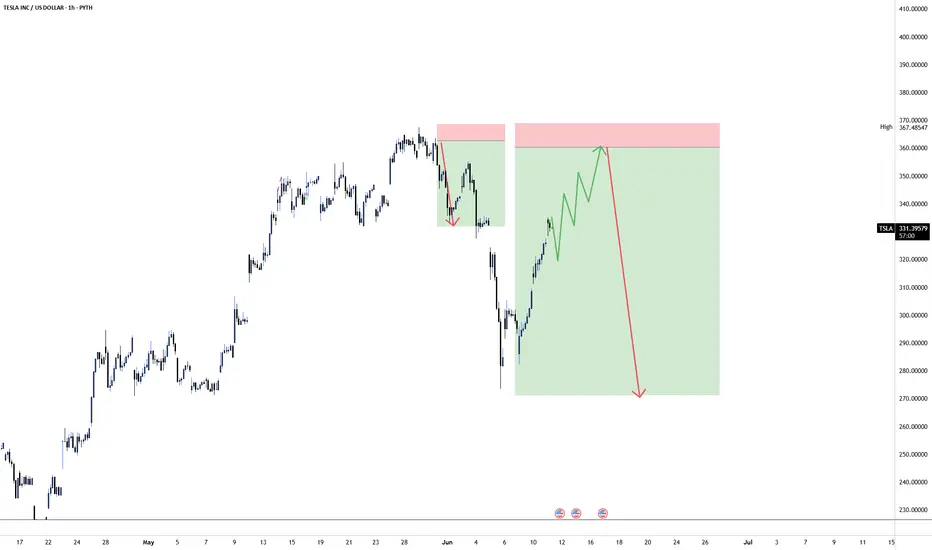
TSLA printing another 3 major bearish pattnerNASDAQ:TSLA now showing a bear flag with a measured move to the downside approx $275 USD. This would also fulfill the descending triangle measured moved that its also seen as resistance in the last few sessions rejecting higher prices.
Bearish! Short position taken

Is Tesla's $1 Trillion Market Cap Sustainable in the Long Run?A Milestone Achieved
Tesla, the electric vehicle pioneer led by Elon Musk, has once again shattered records by surpassing a $1 trillion market capitalization. This significant milestone, achieved in early November 2024, solidifies Tesla's position as a dominant force in the automotive industry and a symbol of innovation and disruption.
The Factors Behind the Surge
Several key factors have contributed to Tesla's remarkable market performance:
1. Strong Financial Performance: Tesla has consist
TLong

Tesla Pushing higher to 230-240 regionTesla Pushing higher to 230-240 region.
Trader Trick Entry (after 1-2-3 and before Ross hook)
TLong

The idea of a bull marketEsteemed analysts and traders,
I hope this correspondence finds you in good health and high spirits, prepared to tackle the upcoming week with renewed energy. I extend my best wishes for your continued success in all your business endeavors. It is worth noting that success in trading is largely dependent on the consistent definition and adherence to one's own rules.
As a supporter of the Elliott Wave Principle, I consider this methodology an invaluable tool for market analysis. After three yea
TLong

Bullish market in TeslaEsteemed analysts and traders,
I hope this correspondence finds you in good health and high spirits, prepared to tackle the upcoming week with renewed energy. I extend my best wishes for your continued success in all your business endeavors. It is worth noting that success in trading is largely dependent on the consistent definition and adherence to one's own rules.
As a supporter of the Elliott Wave Principle, I consider this methodology an invaluable tool for market analysis. After three yea

The double zigzag pattern will be completed or slightly expandedDear analysts and traders,
I hope you are doing well and are motivated for the week ahead. I wish you all the success in your business endeavors. Remember that success in trading lies in consistently defining and sticking to your rules.
As someone interested in the Elliott Wave Principle, I find it to be an invaluable tool for market analysis. I have developed my approach by combining this principle with my personal experience and by considering different scenarios that are likely to occur in
TLong

4 Accurate Predictions Made by AI for Tesla (TSLA)In the rapidly evolving landscape of financial markets, Artificial Intelligence (AI) has emerged as a pivotal force, transforming traditional trading strategies into sophisticated, data-driven methodologies. This article delves into the role of AI in identifying and capitalizing on market trends, focusing on recent successes in detecting bearish stock patterns in Tesla (TSLA) shares. Through a detailed analysis of three distinct patterns—Cup-and-Handle Inverse, Head-and-Shoulders Top, and Broade
TShort

TSLA in -12.68% downward trend, declining for three consecutive Moving lower for three straight days is viewed as a bearish sign. Keep an eye on this stock for future declines. Considering data from situations where TSLA declined for three days, in 206 of 266 cases, the price declined further within the following month. The odds of a continued downward trend are 77%.
PYTH:TSLA
Technical Analysis (Indicators)
Bearish Trend Analysis
The Momentum Indicator moved below the 0 level on December 29, 2023. You may want to consider selling the stock, shorting th
TShort

Innovations in Trading Bots Powered by AIIn the dynamic arena of stock trading, Tickeron has distinguished itself with the introduction of Virtual Accounts (VAs), a novel class of AI Robots designed for advanced risk management in the fluctuating financial market. This development signifies a major leap in the capabilities of AI-driven trading tools, offering traders and hedge funds enhanced risk management options.
The Generation of Tickeron's Virtual Accounts
Tickeron, a pioneer in AI trading technology, recognized the growing need
TLong

SND Concepts | Tesla Aiming HigherTSLA looks bullish at H1. The price has the potential to find meaningful resistance at the 260 area only to recover back up to the 280–290 area.
Strategy: SND & Wolfe Wave
K.
TLong

Tesla's 2000 Cybertruck Production Underway!As you may already know, Tesla has officially commenced the production of 2000 Cybertrucks this year, and we believe this development presents a unique opportunity for traders like yourself.
Tesla has consistently demonstrated its ability to disrupt the automotive industry, and the Cybertruck is no exception. With its futuristic design, cutting-edge features, and impressive performance capabilities, the Cybertruck has garnered immense attention and anticipation from consumers worldwide.
Give
TLong

Buy now for TSLS or wait for next dip
I am thrilled to share with you that Tesla chargers are gaining more supporters as the company's plug becomes the American standard. This is a significant milestone for Tesla and a clear indication of the company's commitment to providing sustainable transportation solutions.
Currently, the $210 level is acting as a support level, as it did on Friday and again on Monday. It's important to keep an eye on this level.
However, if the stock manages to break through this level, it's crucial to p
TLong
