
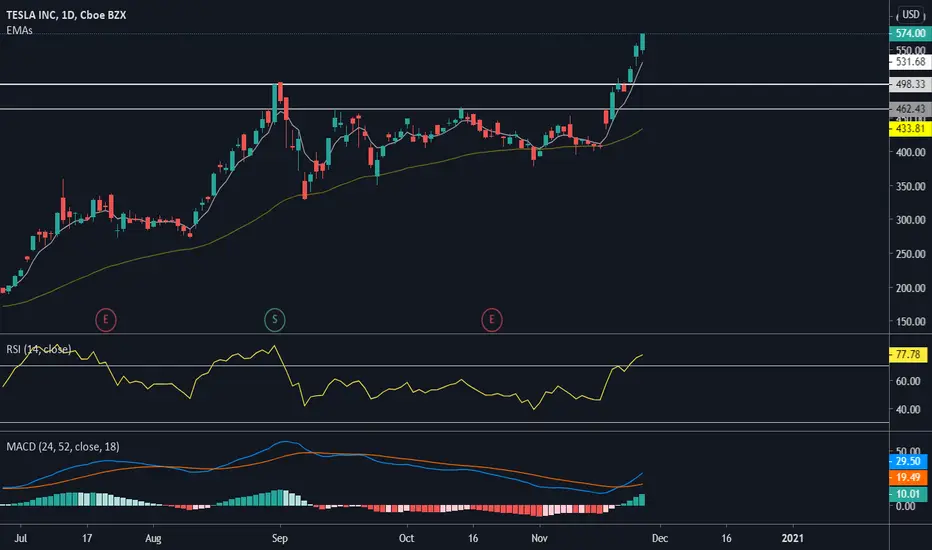
We are looking at a nice Day chart here, it's very appealing and dazzling. The latest bull run is exceptionally a nice rally with only a few ugly red candles. However, things' might not be as fine and dandily as you may (or may not) think. As diamonds are forever bull runs are not forever. On day chart RSI is gone above magical level (70), which usually indicates that the s**t is about to hit the fan soon, especially when this happens on a day chart. Lets take a closer look at 14/56 hour chart (15min chart for goofs).
Catatan
Here we have a handsome 14/56 chart that gives us further short-term information. As we manage to see the price has bounced a couple of times from the trendline that makes the trend even stronger. Concurrently the downward breakup shall also be more severe. Currently, I keep watching the trendline and moving averages. Fyi I use ema 5 and 50. This shall not be investing advice.
Catatan
Hola, Let's take a look at 5 minutes chart. Tesla reached new ATH soon after NASDAQ opening. However, soon after the opening, the price started to tumble and the stock couldn't make a new ATH anymore. Using lows and highs we can draw a triangle. RSI is still way over level 70 on the daily chart, which indicates there will be some more selling pressure during the next few days. RSI is showing a buy signal on the 5-minute chart (also soon on the 15-minute chart), which may lead to an upward breakup. If you are looking for short trades, you should concentrate on the triangle and look for short/long positions.Catatan

Pernyataan Penyangkalan
Informasi dan publikasi ini tidak dimaksudkan, dan bukan merupakan, saran atau rekomendasi keuangan, investasi, trading, atau jenis lainnya yang diberikan atau didukung oleh TradingView. Baca selengkapnya di Ketentuan Penggunaan.
Pernyataan Penyangkalan
Informasi dan publikasi ini tidak dimaksudkan, dan bukan merupakan, saran atau rekomendasi keuangan, investasi, trading, atau jenis lainnya yang diberikan atau didukung oleh TradingView. Baca selengkapnya di Ketentuan Penggunaan.