ZECUSD 2H Long Trade PlanZECUSD 2H Long Trade Plan
Trading Pair: ZECUSD
Timeframe: 2H
Direction: Long
Entry Price: Around 508.50 (Wait for pullback to enter)
Stop Loss: 480.50
Position Management
1. First Target: 605.00. Close half of the position and move stop loss for protection.
2. Second Target: 688.00. Close half of the remaining position and move stop loss for protection.
3. Third Target: 800.00. Close half of the remaining position and move stop loss for protection.
4. Remaining position: Hold and adjust pr
Bat
BAT Looks Super Bulish (8H)The price appears to be at the end of wave i within a symmetrical structure. Once this symmetrical pattern is fully completed, the market is likely to transition into either a bullish X wave or the beginning of a new bullish cycle.
At the same time, price is currently trading around a key level, which makes this area particularly important for determining the next directional move. A strong reaction from this zone could act as a catalyst for further upside momentum.
As long as BAT holds and re
BAT/USDT – Update : THE KNOWN WHALE BUILDING TOKEN📊 BAT/USDT – Update
BAT continues trading inside a stable accumulation structure while maintaining support and gradually building momentum. The current setup suggests buyers are holding control, increasing the probability of a continuation move if momentum continues strengthening.
🎯 TP 1: 0.1167
🎯 TP 2: 0.1292
🚀 TP 3: Runner target open — allowing the trend to capture maximum upside potential.
👉 As long as price remains above the support zone, the bullish scenario stays active.
This is our t
XAUUSD BUY 4189On the daily chart, XAUUSD continues to retreat, with the short-term bearish trend currently prevailing. Attention should now be focused on the support level near 4189; this level serves as the potential entry point for a bullish Bat pattern. Once this level is reached, look out for opportunities to go long.
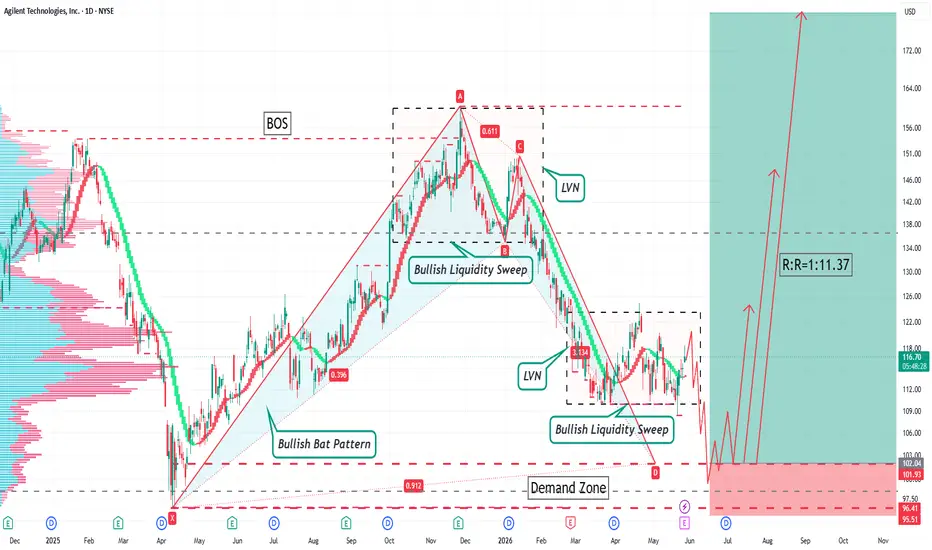
Trading Plan for ATrading Plan for A
Asset: NASDAQ Stock A
Timeframe: Daily Chart
Current Price: $116.39
Wait for pullback on lower timeframes to go long.
Entry: Around $102.00
Support & Stop Loss: $95.50
Profit Targets & Management
1. TP1: Around $125.00. Reduce half position and adjust stop loss to lock profits.
2. TP2: Around $148.00. Reduce half of the remaining position and trail stop loss.
3. TP3: Around $180.00. Reduce position further and trail stop loss. Hold the last position.
US Stock Trading Ri
Vipshop Holdings Limited (VIPS)Vipshop Holdings Limited (VIPS)
Timeframe: Daily Chart (Primary) / Lower Timeframe (Entry Execution)
Direction: Long
Entry: Enter long position on lower timeframe pullback to the key support zone around $12.80.
Stop-Loss: Set stop-loss at $11.80, below the demand zone swing low to invalidate the bullish setup.
Take Profit & Position Management:
1. First Target at $17.00: Close 50% of the position and move stop-loss to break-even to eliminate risk.
2. Second Target at $21.70: Close 50% of th
XAUUSD – 4H Update | May 26, 2026Market Structure
Price has been ranging within a key consolidation zone (yellow zone) between approximately 4,460 – 4,535. After completing a 450-pip bullish move, price has now rejected from a Fair Value Gap (FVG) and CHoCH (Change of Character) level near 4,535, signaling a potential bearish pullback phase.
A BOS (Break of Structure) to the downside was recently confirmed, shifting short-term bias bearish.
Target Levels (Short Setup)
LevelPriceTP14,515.37TP24,495.63TP34,473.35 – 4,470.73
Key
ETH/USD Crypto Trading Plan ETH/USD Crypto Trading Plan
Timeframe: Lower Timeframe
Trade Direction: Long Position
Entry Zone: Around 2000.00
Stop Loss: 1935.00
Take Profit Target 1: 2173.00
• Partial close 50% position, move stop loss to break-even level
Take Profit Target 2: 2338.00
• Partial close remaining 50% half position, trail stop loss higher
Take Profit Target 3: 2600.00
• Partial close another half position, continue trailing stop loss
• Let the remaining small position run freely with dynamic trailing p
Bullish Patterns Showing Signs of Reversal!BERG Analysis
Closed at 92.32 (18-05-2026)
Bullish Bat Pattern + Bullish Divergence; Both are signs of reversal.
Also ABCD chart pattern touched its Point D (PRZ) in Golden Pocket Range.
So if this time 80 is not broken, we may witness upside towards 97 - 100 &
then around 110 - 111.
THE KOG REPORT - UpdateEnd of day update from us here at KOG:
Yesterday we added the red arrow with the continuation of the projection and today we gave the bias levels with a bearish move on the break of 4470 which as you can see was tapped and then resulted in the move upside.
For now, we'll stick with it, we've added another red arrow and we'll say key level support is the 4504 level which will need to break to go lower.
From Camelot this morning:
RED BOXES:
BREAK ABOVE 4490 for 4504✅, 4510✅, 4520✅ and 4529✅
VVVusdt: Double top FormationHello Traders!
We were waiting for this rise in VVV and now market is here. Its a Double top formation and there are many bearish pattern which will not let VVV pump more. Its now at the top and bears will take control now.
Stoploss 21.688 (-20.1%)
Target 10.102(+44%)
My aim is to achieve highest win rate in tradingview trading community :) and we will definitely do that.
Trade Analysis Based on
> Fibonacci Tool (A1000x Way) – Custom Fibonacci approach for precise market analysis
> Candl
EURUSD BUY 1.1460On the daily chart, EUR/USD is trending lower amidst choppy price action, with short-term bearish forces currently holding the upper hand. Attention is now focused on the support level near 1.1460; this level serves as the potential entry point for a bullish Bat pattern and is also situated within a previous demand zone.
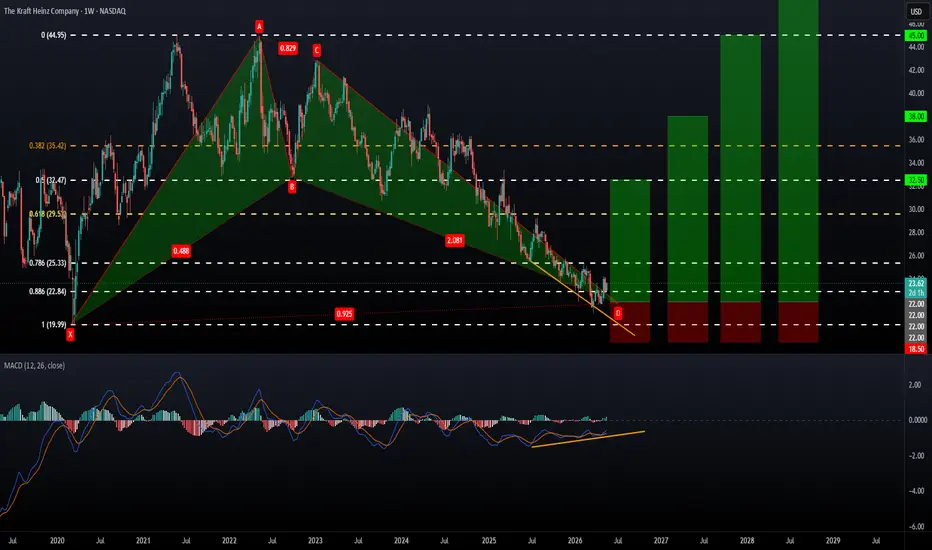
Bullish Harmonic Bat Pattern on KraftThis chart shows a popular strategy called harmonic trading. It uses specific shapes and math percentages (Fibonacci numbers) to predict when a falling stock is about to turn around and head back up.
Here is a simple breakdown of what is happening:
1. The "Bat" Shape is Complete
The red lines form a geometric pattern shaped like a bat (labeled X-A-B-C-D).
The stock started at a low point (X), shot up to (A), bounced around, and then slid all the way down to (D).
Point D is the magic zone whe
KLong
Bullish Bat Pattern in PAXGUSDTPAXGUSDT Analysis
CMP 4562.97(19-05-2026 02:59am PST)
Bullish Bat Pattern along with Bullish
Divergence showing signs of reversal.
However, 4488 is an Important Support.
Upside resistance is around 4800 - 4900 initially.
Crossing & Sustaining this range may lead it towards
5200 - 5300.
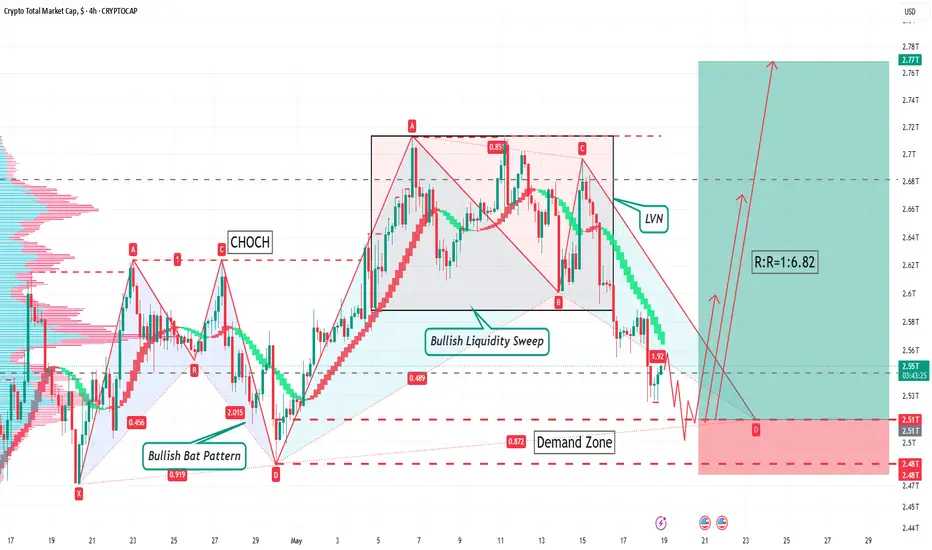
TOTAL 4H Trading PlanTOTAL 4H Trading Plan
Timeframe: 4-Hour
Trade Direction: Long
Entry Price: 2.51T
Stop Loss: 2.48T
First Target: 2.60T
• Close half position, move stop loss to break even
Second Target: 2.67T
• Reduce half holdings again and raise stop loss level
Third Target: 2.80T
• Cut partial position further and trail stop loss upward
• Keep the last part of position floating with dynamic stop protection
Trading Risk Warning
Cryptocurrency trading involves high market volatility and huge investment
BTC/USDT 4H Crypto Trading Plan BTC/USDT 4H Crypto Trading Plan
Timeframe: 4-Hour
Trade Direction: Long Position
Entry Zone: Around 75946.39
Stop Loss: 74797.33
Take Profit Target 1: 79272.00
• Partial close 50% position, move stop loss to break-even level
Take Profit Target 2: 82103.75
• Partial close remaining 50% half position, trail stop loss higher
Take Profit Target 3: 84861.00
• Partial close another half position, continue trailing stop loss
• Let the remaining small position run freely with dynamic trailing p
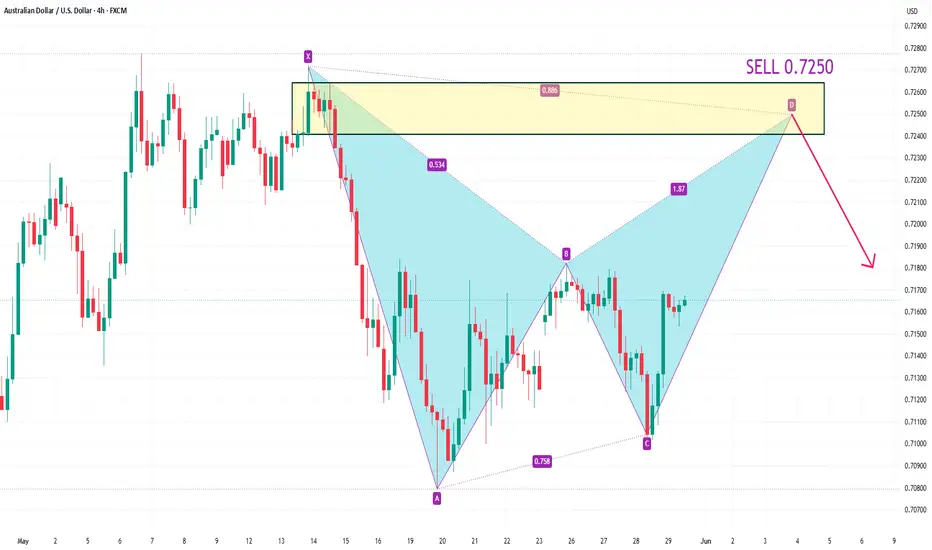
XAUUSD: Gold start a Bat pattern🦇 Gold Retrace Bat Pattern Setup
This idea shows a potential Gold Retrace Bat Pattern forming with price reacting from a deep harmonic retracement zone. Point B retraces near the 0.886 Fibonacci level of the XA leg, creating the foundation for a possible Bat structure continuation.
The projection anticipates:
A move toward point C
Harmonic symmetry development
Final bearish completion into point D
The setup focuses on:
✔ Bat Pattern retracement behavior
✔ Fibonacci harmonic ratios
✔ AB=CD pr
ADAUSDT 4H Trading PlanADAUSDT 4H Trading Plan
Timeframe: 4-Hour
Trading Pair: ADAUSDT
Trade Direction: Long, wait for pullback to enter
Entry Zone: 0.24260
Stop Loss: 0.23676
First Target: 0.26010
Cut half position and move stop loss to protect profits.
Second Target: 0.27600
Reduce half remaining positions and adjust stop loss level.
Third Target: 0.30000
Make further position reduction and trail stop loss.
Hold the last position and follow the trend with dynamic protection.
Crypto Trading Risk Warning
Cryptoc
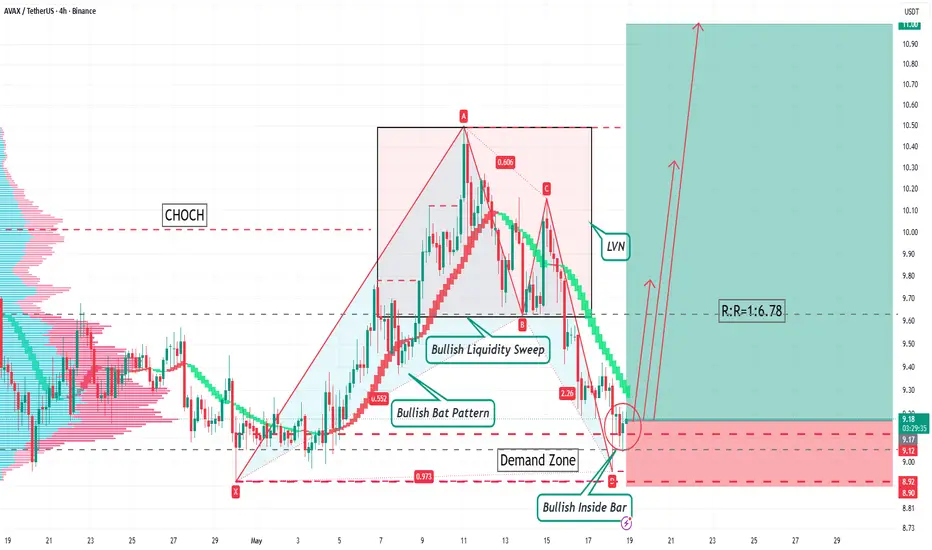
AVAXUSDT 4H Trading PlanAVAXUSDT 4H Trading Plan
Timeframe: 4-Hour
Trading Pair: AVAXUSDT
Trend Direction: Long
Entry Price: 9.17
Stop Loss Level: 8.90
First Take Profit: 9.80
Cut half position, move stop loss upward for risk protection
Second Take Profit: 10.30
Reduce half of the remaining positions, continue trailing stop loss
Third Take Profit: 11.00
Further reduce partial positions and adjust stop loss
Keep the last small position and follow the trend with dynamic stop protection
Crypto Trading Risk Warning
C
ETHUSD TP 1998On the daily chart, ETH/USD is trending downward in a choppy manner, with the bearish trend currently dominant. Attention should be focused on the resistance level near 2160; if a rebound encounters resistance at this point, consider initiating or maintaining short positions, targeting the support level near 1998. Should the price reach the vicinity of 1998, watch for a potential bullish Bat pattern; notably, this level also coincides with a previous demand zone.
Buying & Selling Confluence on the EURUSDThis week on EUR/USD, things got a little messy—but the structure is actually giving us some clean opportunities.
We saw price sell off, form a wedge, break to the upside, fail to follow through, and then break back below key support. That last move is important because it shifts the short-term bias back toward the downside.
🧠 What I’m really watching now
After the break of structure, the natural assumption is “price goes lower.” But the better question is where it wants to go.
That’s where