VBL LONGI was aways from the markets for few weeks but here i am back again. Market have been very choppy too in recent times hence positions should be taken with keeping all the risk measure in mind.
VBL has been moving good and after a trendline breakout it has retested and now it is again looking good for a long setup. (Keep in mind nifty is still weak hence take this trade accordingly)
ENTRY- 505-503
SL- 498
Target- 512, 515, 520.
Disclaimer- This is just for educational purpose.
JAI SHREE RAM.
Bullish Patterns
USD/CAD BULLS ARE GAINING STRENGTH|LONG
USD/CAD SIGNAL
Trade Direction: long
Entry Level: 1.373
Target Level: 1.376
Stop Loss: 1.372
RISK PROFILE
Risk level: medium
Suggested risk: 1%
Timeframe: 1h
Disclosure: I am part of Trade Nation's Influencer program and receive a monthly fee for using their TradingView charts in my analysis.
✅LIKE AND COMMENT MY IDEAS✅
DAX 4H — Bias Starting to ShiftThree consecutive BOS to the upside built a clean bullish structure. That was the trend. But price has now retraced the entire move and is sitting right near the structured lows at the 1 level. When price gives back everything that fast, you have to pay attention.
If we lose this level cleanly, my bias flips bearish and I'm not interested in longs anymore on the swing timeframe.
That said, we're not there yet. Right now price is compressing near a significant zone and I could still see a short term bounce from here. If we get a reaction I'll be looking for a quick long back toward the 0.71 or 0.5, but I'm not holding that trade with conviction. It's a scalp against what could be a larger shift in structure.
The honest answer is this is a decision point. Bullish until it isn't. If structure breaks down I follow it lower.
Not financial advice. Manage your risk.
4H Swing Structure Remains Bullish — Waiting on Confirmation Structure is bullish. We got a BOS to the upside on the 4H and that's the baseline until proven otherwise. I'm not looking for shorts right now.
Price has pulled back to the 0.5 retracement of the full swing range. Clean discount zone, exactly where buyers should show up if this move has legs. The 0.71 sits just below as a deeper level if we get one more push down before reversing.
Not entering yet though. I want to see a lower timeframe shift in momentum before committing. A reclaim of this zone with intent is what I'm watching for.
Bias is bullish. Looking for longs, not sells. Will update when I see confirmation.
Not financial advice. Manage your risk.
GBP/USD BULLS ARE STRONG HERE|LONG
Hello, Friends!
Bullish trend on GBP/USD, defined by the green colour of the last week candle combined with the fact the pair is oversold based on the BB lower band proximity, makes me expect a bullish rebound from the support line below and a retest of the local target above at 1.346.
Disclosure: I am part of Trade Nation's Influencer program and receive a monthly fee for using their TradingView charts in my analysis.
✅LIKE AND COMMENT MY IDEAS✅
EUR/USD LONG FROM SUPPORT
Hello, Friends!
EUR/USD is trending up which is clear from the green colour of the previous weekly candle. However, the price has locally plunged into the oversold territory. Which can be told from its proximity to the BB lower band. Which presents a classical trend following opportunity for a long trade from the support line below towards the supply level of 1.169.
Disclosure: I am part of Trade Nation's Influencer program and receive a monthly fee for using their TradingView charts in my analysis.
✅LIKE AND COMMENT MY IDEAS✅
XAUUSD: Reload Zone or Deeper Flush?Gold is approaching a real decision zone here.
On the lower timeframe, the gray bullish sequence still has an unreached C target , and price is now moving down into its valid BC zone . In a healthy bullish structure, that BC is often where price reloads before pushing higher toward C.
But the path into that zone is not random.
Price first reacted from the bearish red WCL , and from there it developed a bearish pink sequence with an active C target still below . Inside that same move, a smaller black bearish sequence also formed, and its C target sits inside the gray bullish BC zone .
That matters.
It means the current bearish pressure may simply be the mechanism that drives price into the exact area where the larger bullish structure wants to refuel.
Now zoom out.
On the higher timeframe, the purple bullish sequence also remains incomplete , and price is currently trading inside its BC zone . So from a broader structural point of view, gold is still sitting in a location where upside continuation remains very much alive.
That said, there’s a catch.
The turquoise HTF bullish sequence already completed its C target , but its WCL below has never been reached . That leaves unfinished business underneath the market. So while the current drop can absolutely become a bullish reload, traders should not ignore the risk of a deeper flush if the gray BC fails to hold.
So this is how I read it:
Near term, bearish continuation still makes sense as long as price is working to complete the pink and black C targets .
But if that completion happens inside the gray BC / purple BC region and buyers show acceptance there, the chart opens the door for a bullish continuation toward the gray and purple unreached C targets .
In other words:
This is not just a support zone.
This is a multi-timeframe decision pocket .
Bearish sequences are pulling price lower into target
Bullish BC zones are waiting underneath
HTF upside structure is still active
But deeper WCL risk remains if support fails
So I’m not interested in chasing price in the middle of nowhere.
The smarter read is to let the bearish legs finish their job, then watch whether the bullish structure actually defends.
If it does, this becomes a very interesting continuation setup.
If it doesn’t, gold may need to sweep lower first before the bigger bullish story resumes.
Not financial advice.
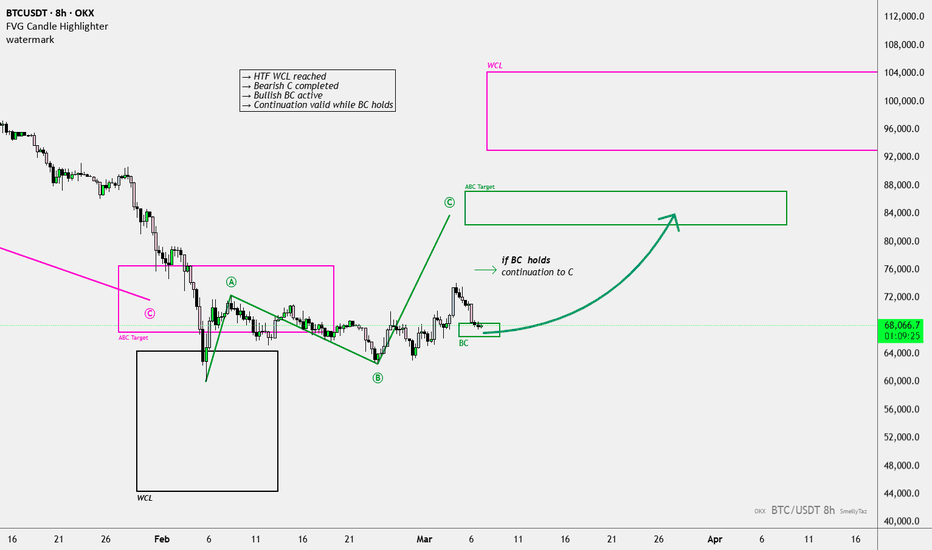
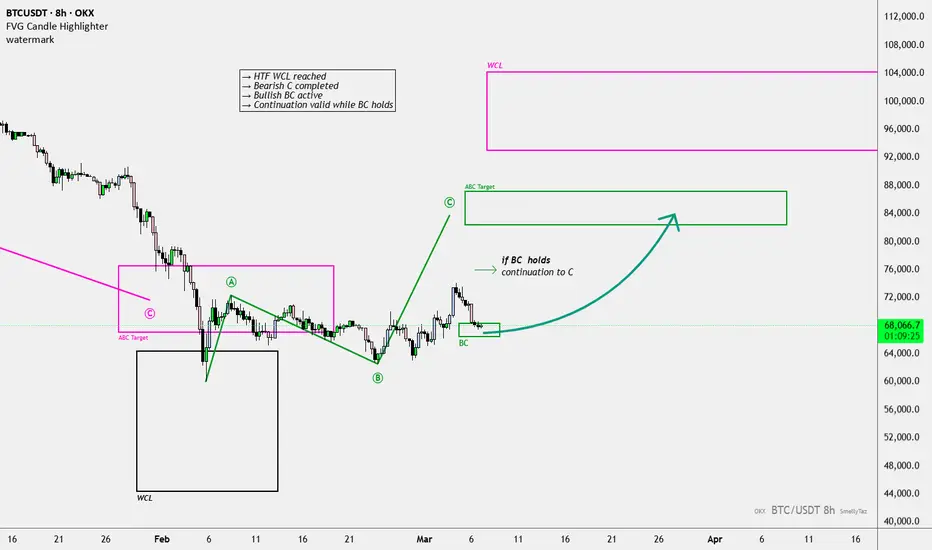
BTC Bulls Have a Job to Do HereBTC has reached the kind of zone where the chart stops joking around.
The HTF bullish WCL has been tagged.
The bearish pink sequence already completed C .
And from that reaction, price built a new bullish green sequence with a valid upside target still open.
Now price is pulling back into the bullish BC .
That matters because in a valid bullish sequence, BC is often the reload point that carries price toward C. So this is not just “support.” This is a live structural test.
What makes the setup better is the context:
Macro still looks tense. Oil, war risk, and inflation fears are keeping pressure on risk assets. So yes, headlines are still a headwind. But Bitcoin itself is not acting dead. Institutional flows have returned, which means this market still has buyers underneath the fear.
So here’s the read:
If bulls defend this BC, then the market has a clean path to continue toward the green C target.
If they lose it, the idea loses strength.
For now, I’m watching this as a continuation setup sitting right where it should sit .
Not financial advice.
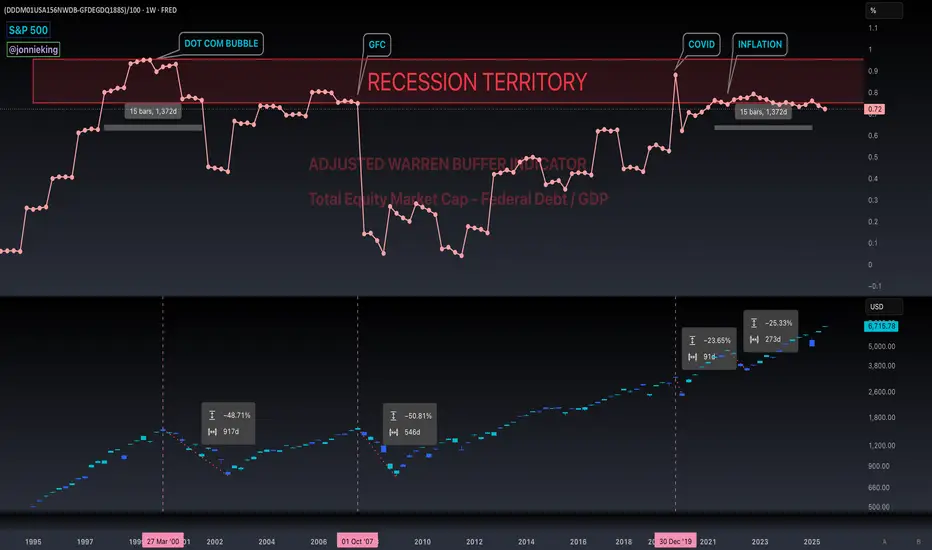
Adjusted Warren Buffer Indicator Flirting With RecessionThe Adjusted Warren Buffer Indicator has been flirting with a recession for the past 4+ years.
We have still yet to see the big 50% corrections in the stock market like we saw in the Dot Com Bubble and GFC.
We had small glimpses into it with covid and the inflation aftermath that gave us 25% corrections in the market, but those were much faster and tamer than the latter.
Is this the new norm in the QE-era? The Fed simply refuses to let the market and economy reset.
Newly appointed Fed Chair Kevin Warsh has been notorious for his strong stance against expanding the Fed Balance Sheet, so it will be very interesting to see his reaction to the global economic crisis that is knocking on the door.
HYPE Breakout After Circle Support — Bullish Continuation SetupHYPE has shown strong momentum after our previous analysis, where the token surged almost 35%. The latest breakout is being supported by positive fundamental news, as Circle announced expanded support for Hyperliquid and also increased its exposure by staking HYPE. This has strengthened market sentiment around Hyperliquid and helped push HYPE higher.
The token was already up around 20% on the news, showing clear buying interest from the market. With stronger ecosystem support, rising attention, and bullish momentum, HYPE could continue moving higher if it holds above key support levels. However, after a strong breakout, chasing the price directly can be risky.
In our opinion, the better trade setup is to wait for a retest of the major support zone before entering. If HYPE holds the $43.70–$44.80 area and buyers step back in, the next upside targets could be $50.50 and $56.40. A break below $40.83 would weaken the bullish setup.
Trade Levels
Entry Zone: $43.70 – $44.80
Take Profit 1: $50.50
Take Profit 2: $56.40
Stop Loss: $40.83
Bias: Bullish above support
Gold Intraday Outlook, Reversal or Just Retracement?Market Context
Gold delivered aggressively lower after failing to hold premium pricing.
Price is now reacting from the -3 STDV area, which often acts as an exhaustion zone during expanded moves.
Sell-side pressure is still dominant, but momentum is slowing after the sharp displacement down.
👉 Current move looks more like profit-taking and short-term rebalancing rather than confirmed bullish continuation, for now.
What I’m Watching
H1 dealing range SIBI is the key level on this chart.
I want to see price reclaim that imbalance and confirm CISD on the lower timeframe.
If buyers can shift delivery above that area, then gold can retrace deeper into premium pricing.
Bullish Scenario
Hold current lows after the liquidity sweep
Confirm H1 CISD and accept back above the imbalance
Expand toward the nearby inefficiency / premium zone
👉 That would suggest the selloff was overextended and smart money is re-accumulating at discount.
Bearish Scenario
Weak retracement + failure to reclaim H1 imbalance
Continued acceptance below current structure
Expansion lower toward deeper sell-side liquidity
👉 If buyers fail to shift delivery soon, this becomes continuation lower, not reversal.
Additional Confluence
Silver still sitting inside the 3rd May NWOG adds bullish intermarket context for gold.
SMT at the lows also hints that downside momentum may be weakening.
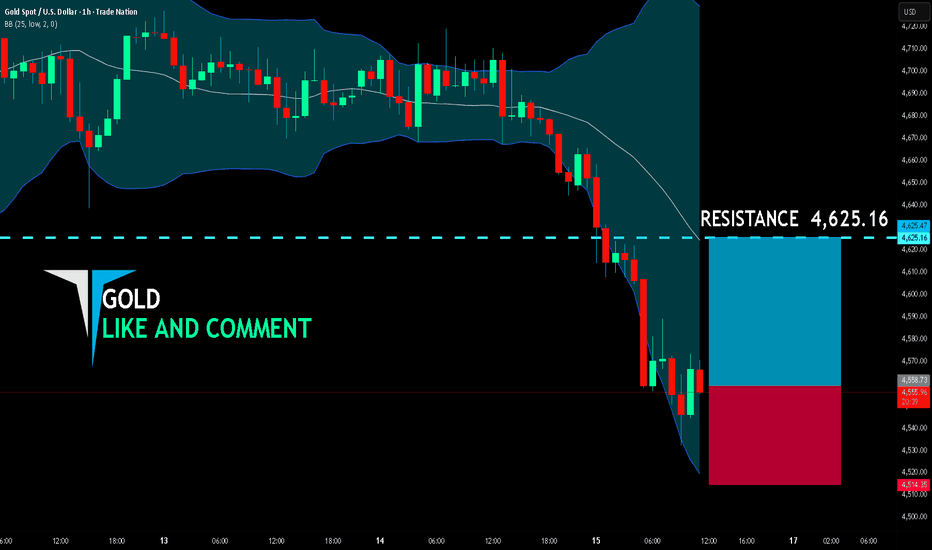
GOLD SENDS CLEAR BULLISH SIGNALS|LONG
GOLD SIGNAL
Trade Direction: long
Entry Level: 4,558.73
Target Level: 4,625.16
Stop Loss: 4,514.35
RISK PROFILE
Risk level: medium
Suggested risk: 1%
Timeframe: 1h
Disclosure: I am part of Trade Nation's Influencer program and receive a monthly fee for using their TradingView charts in my analysis.
✅LIKE AND COMMENT MY IDEAS✅
GBP/CAD BULLS ARE GAINING STRENGTH|LONG
Hello, Friends!
GBP/CAD pair is trading in a local downtrend which we know by looking at the previous 1W candle which is red. On the 4H timeframe the pair is going down too. The pair is oversold because the price is close to the lower band of the BB indicator. So we are looking to buy the pair with the lower BB line acting as support. The next target is 1.850 area.
Disclosure: I am part of Trade Nation's Influencer program and receive a monthly fee for using their TradingView charts in my analysis.
✅LIKE AND COMMENT MY IDEAS✅
AUD/JPY BUYERS WILL DOMINATE THE MARKET|LONG
AUD/JPY SIGNAL
Trade Direction: long
Entry Level: 113.561
Target Level: 114.076
Stop Loss: 113.218
RISK PROFILE
Risk level: medium
Suggested risk: 1%
Timeframe: 1h
Disclosure: I am part of Trade Nation's Influencer program and receive a monthly fee for using their TradingView charts in my analysis.
✅LIKE AND COMMENT MY IDEAS✅
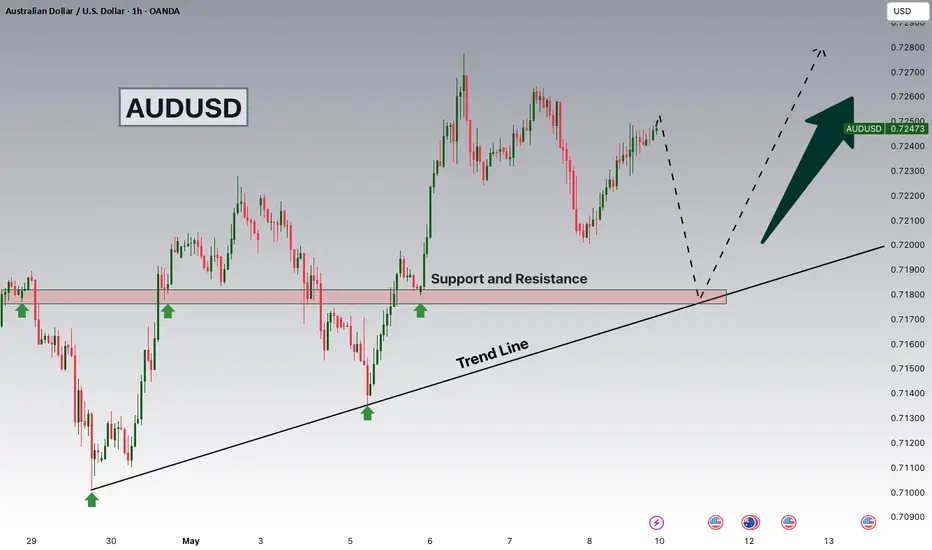
AUDUSD is Nearing a Strong Support!Hey Traders, in today's trading session we are monitoring AUDUSD for a buying opportunity around 0.71900 zone, AUDUSD is trading in an uptrend and currently is in a correction phase in which it is approaching the trend at 0.71900 support and resistance area.
Trade safe, Joe.
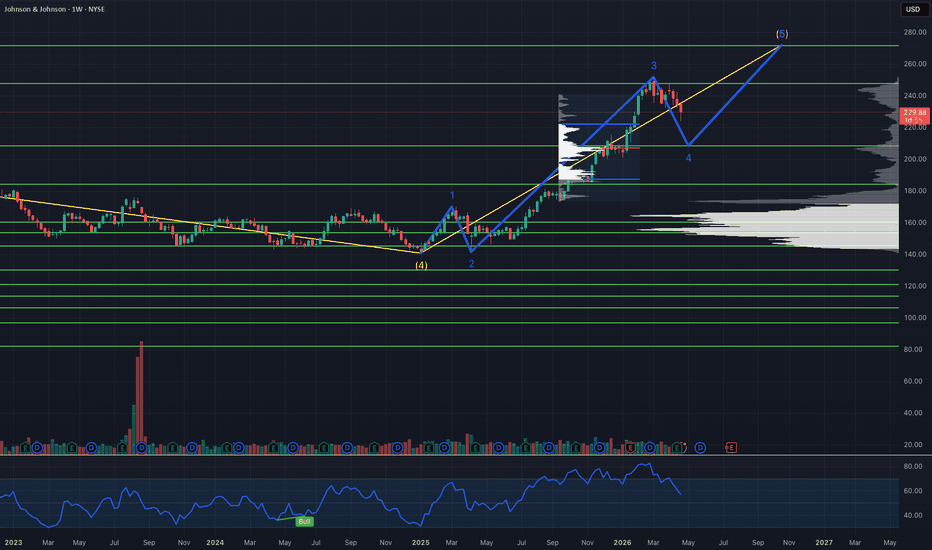
Could we see another push higher for JNJWhile many believe there is a convincing top on JNJ at the 251 zone, which would indicate a much more meaningful correction below the 200 zone, evidence suggests that the 251 zone is more likely to be a lower degree, and that support in the 208 - 215 zone should hold. That said, from that support, Elliott Wave guidelines would suggest we look for another five-wave structure to the upside, in what would be a larger degree extended wave five. I base this on the following evidence:
-Elliott wave guidelines suggest there should be bearish divergence between wave 3 and 5, and we should look for that divergence on a fractile basis to support the count. Keep in mind that the higher the timeframe of divergence, the more confirmation provided. That said, there is a lack of bearish weekly divergence between the December 15th 2025, weekly high at 215, and the March 2nd 2026, weekly high at 251, which would suggest that the 251 high is more likely not a wave 5 top, and instead a wave 3 top. Therefore, we would be looking for a pullback and one more high to the upside to create that weekly divergence.
- While volume is one of the most simple indicators, it is often overlooked, which is a huge mistake. Volume is provided in real time and is not based on lagging information, like so many other indicators. It must be noted that approximately 90% of market volume is created by informed institutional activity. That said, when we look at the weekly volume coming down from the 251 high, it does not indicate a more meaningful correction. In fact, it is declining in a manner that would suggest declining interest in lower prices, which is a clue that the nearest support is more likely to hold. The nearest weekly support is in the 209 area. Therefore, I would look for the market to pivot in that zone of support.
- Lastly, Elliott Wave guidelines also suggest that wave four pullbacks typically target the previous lower degree's wave four target zone, which the target of 209 is in. This further supports the case for a pullback to 209, where JNJ may pivot and head toward a new all-time high.
If JNJ holds support and we see a push for one more all-time high to complete the higher degree impulse structure, where should we look to forecast the new all-time high? To answer that, we must look at the larger degree structure, and the lower next degree wave five structure we are likely currently in, which would suggest the 300% extension around 272 as a likely forecasted target for the top.
GBP/NZD BULLISH BIAS RIGHT NOW| LONG
Hello, Friends!
We are targeting the 2.286 level area with our long trade on GBP/NZD which is based on the fact that the pair is oversold on the BB band scale and is also approaching a support line below thus going us a good entry option.
Disclosure: I am part of Trade Nation's Influencer program and receive a monthly fee for using their TradingView charts in my analysis.
✅LIKE AND COMMENT MY IDEAS✅
EUR/GBP SENDS CLEAR BULLISH SIGNALS|LONG
Hello, Friends!
EUR/GBP pair is trading in a local downtrend which we know by looking at the previous 1W candle which is red. On the 4H timeframe the pair is going down too. The pair is oversold because the price is close to the lower band of the BB indicator. So we are looking to buy the pair with the lower BB line acting as support. The next target is 0.867 area.
Disclosure: I am part of Trade Nation's Influencer program and receive a monthly fee for using their TradingView charts in my analysis.
✅LIKE AND COMMENT MY IDEAS✅
AUDJPY Potential Resistance Breakout Building Above 114.50AUDJPY is building a potential resistance breakout above the 114.50 area, with price trading near 114.493 and holding close to the breakout zone. The pair has been gaining over the last 5 days, and the short-term structure still favors buyers.
This idea is based mainly on price action and resistance behavior, not positioning. The market is pressing into the 114.50 resistance area, and a clean break with acceptance above that level could open room for continuation.
The broader model supports the bullish setup. The 5-day outlook is bullish at +0.377, while the 20-day swing view is also bullish at +0.544. Technical context also shows a bullish 5-day trend, with AUDJPY up +0.913% over that period.
Macro conditions are mixed but still allow the upside case. AUD has support from rising growth, while JPY remains weaker in the currency strength matrix. JPY policy is hawkish, so confirmation above resistance matters before treating the move as clean continuation.
Trade view:
AUDJPY is a potential breakout idea above 114.50. A sustained hold above that zone supports bullish continuation, while a rejection back below 114.50 would weaken the setup.
Bias:
Bullish continuation above 114.50.
EUR/CAD BULLS ARE STRONG HERE|LONG
Hello, Friends!
We are now examining the EUR/CAD pair and we can see that the pair is going down locally while also being in a downtrend on the 1W TF. But there is also a powerful signal from the BB lower band being nearby indicating that the pair is oversold so we can go long from the support line below and a target at 1.612 level.
Disclosure: I am part of Trade Nation's Influencer program and receive a monthly fee for using their TradingView charts in my analysis.
✅LIKE AND COMMENT MY IDEAS✅
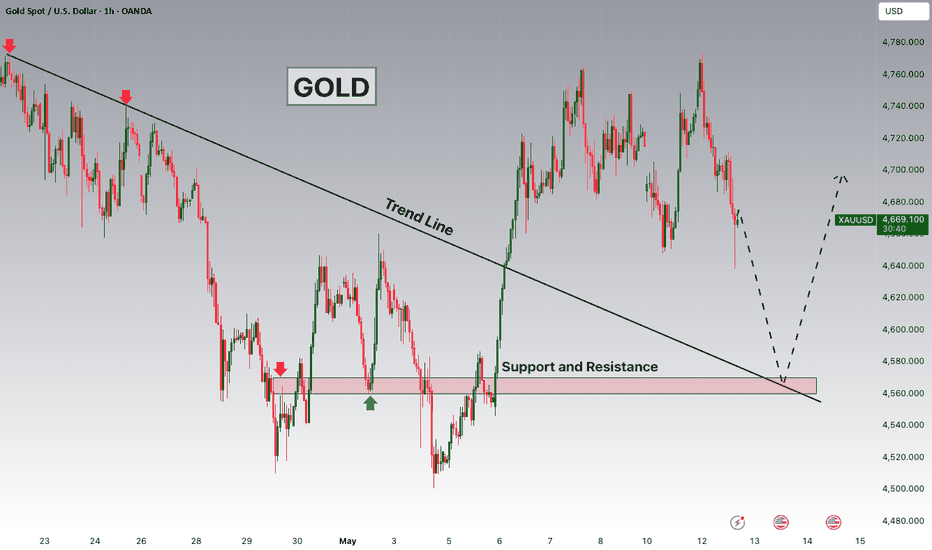
GOLD Breakout and Potential Retrace!Hey Traders, in today's trading session we are monitoring XAUUSD for a buying opportunity around 4,600 zone, GOLD was trading in a downtrend and successfully managed to break it out. Currently is in a correction phase in which it is approaching the retrace area at 4,600 support and resistance area.
Trade safe, Joe.
USD/CHF BEST PLACE TO BUY FROM|LONG
Hello, Friends!
USD/CHF is making a bearish pullback on the 2H TF and is nearing the support line below while we are generally bullish biased on the pair due to our previous 1W candle analysis, thus making a trend-following long a good option for us with the target being the 0.780 level.
Disclosure: I am part of Trade Nation's Influencer program and receive a monthly fee for using their TradingView charts in my analysis.
✅LIKE AND COMMENT MY IDEAS✅