Bullish Divergence
Gold Spot ($XAUUSD) Daily: Testing Key 200-EMA InstitutionalGold Spot ( OANDA:XAUUSD ) Daily: Testing Key 200-EMA Institutional Floor at 4,318 as Price Action Reaches Make-or-Break Confluence
### 🪙 Gold Spot / U.S. Dollar ( OANDA:XAUUSD ) Daily Technical Matrix (Ref: XAUUSD_2026-09-07_08-44-07.png)
We are releasing an updated Daily (1D) technical study for Gold Spot ( OANDA:XAUUSD / OANDA). Following a pull-back off recent local resistance levels, price action has dropped to test a major structural decision node, compressed directly between fast dynami
AAON: Major Support + Bullish Divergence = Reversal?? AAON is testing a major historical support zone around $73–75. Meanwhile, RSI is showing a bullish divergence, suggesting downside momentum may be weakening.
Today’s candle is shaping up as a potential bullish engulfing candle — but the daily close will matter.
🔎 Key levels to watch:
• $84.50 → Initial resistance / first confirmation
• $97.50 → Major bullish reversal confirmation
• $73–75 → Critical support zone
• SL: Below $75; preferably a daily close below $73
If support holds and price re
QXO: Bullish Divergence Meets Trendline Support & Double BottomQXO, Inc is quietly signaling a major shift at a critical structural boundary. After a multi-month leg down, price action is consolidating right on macro trendline support—and momentum indicator is showing classic sign of seller exhaustion.
📊 Technical Breakdown: Aligning the Reversal Confluences
🟢 Double Bottom at Macro Support ($13.1): Price has bounced off the long-term rising trendline support, forming a clear Double Bottom around $13.1. This key green line marks strong structural demand wh
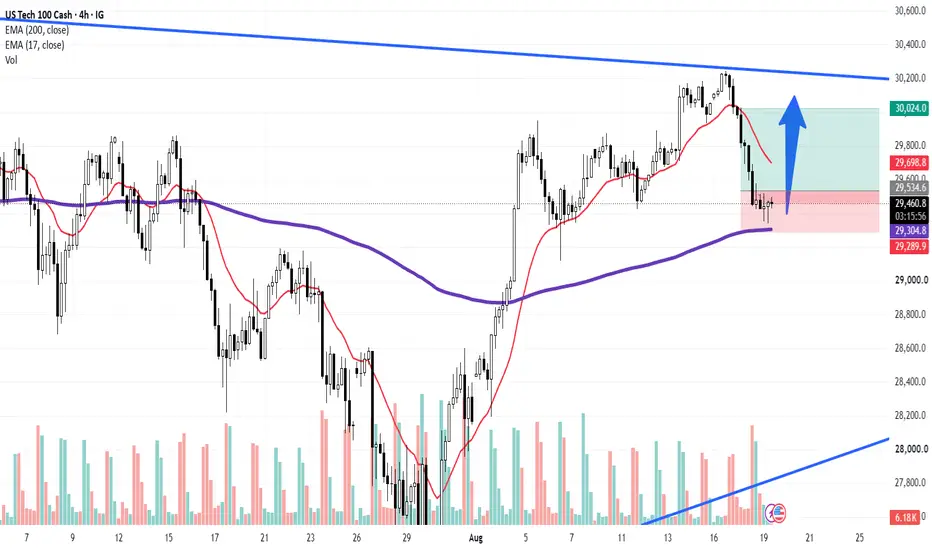
US Tech 100 ($NDX) 4H: 200-EMA Dynamic FloorUS Tech 100 ( NASDAQ:NDX ) 4H: 200-EMA Dynamic Floor Offers 2RR Tactical Rebound Against Daily Corrective Backdrop
### 🇺🇸 US Tech 100 Cash ( NASDAQ:NDX / US100) 4H Technical Matrix (Ref: NASDAQ_2026-08-19_08-34-20.png)
We are releasing an updated 4-Hour (4H) intraday execution study on the US Tech 100 Index ( NASDAQ:NDX / US100). Following a sharp sell-off from the upper descending trendline (LTB), price action has reached its primary intraday institutional anchor: the **200-period 4H EMA (pu
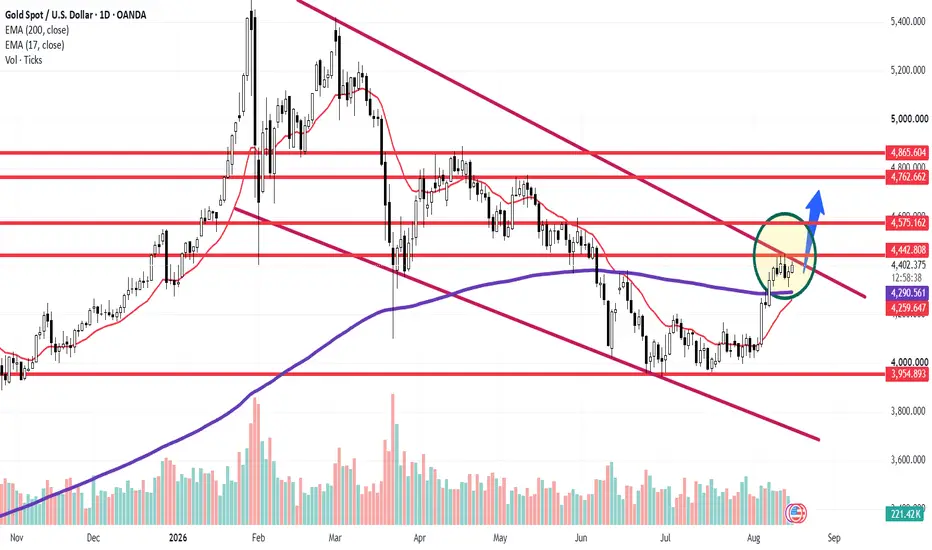
Gold ($XAUUSD) Daily: Dynamic Support Reclaim Sets Up PivotalGold ( OANDA:XAUUSD ) Daily: Dynamic Support Reclaim Sets Up Pivotal Test Against Confluent LTB & 4,442 Resistance Barrier
### 🟨 Gold Spot / U.S. Dollar ( OANDA:XAUUSD ) Daily Technical Matrix (Ref: XAUUSD_2026-08-17_08-58-39.png)
We are releasing an updated Daily (1D) structural study on Gold ( OANDA:XAUUSD ). Following a successful defense and reclaim of its institutional moving average baseline, price action has built a tight accumulation structure (highlighted zone) above dynamic support,
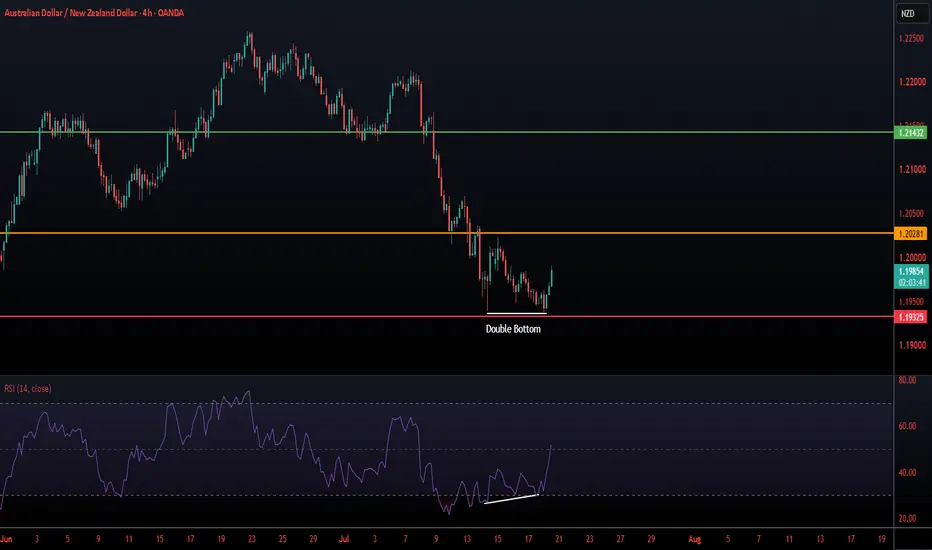
AUDNZD Long Opportunity based on Chart CharacteristicsTrade idea based on chart characteristic
AUDNZD had given a bullish divergence on 1D in Apr25
After that it rallied by 15% disrespecting many bearish divergences
Chart shows a long term strength of AUD against NZD
Trade plan on 1D timeframe with 1% risk
Bullish divergence
Entry upon breakout from last LH
SL on last LL
TP open (BE at RR1)
Gold: Trendline Breakout + Bullish Divergence— Rally Ahead?Presenting another high-probability story. This time for GOLD:
After weeks of respecting a descending trendline, Gold has finally broken above it, potentially signaling that the recent /short term corrective phase is coming to an end.
What's even more interesting is what happened after the breakout.
Instead of immediately running higher, price pulled back to retest the broken trendline, which has now flipped from resistance into support. Right at this confluence, Gold printed a Doji candle, s
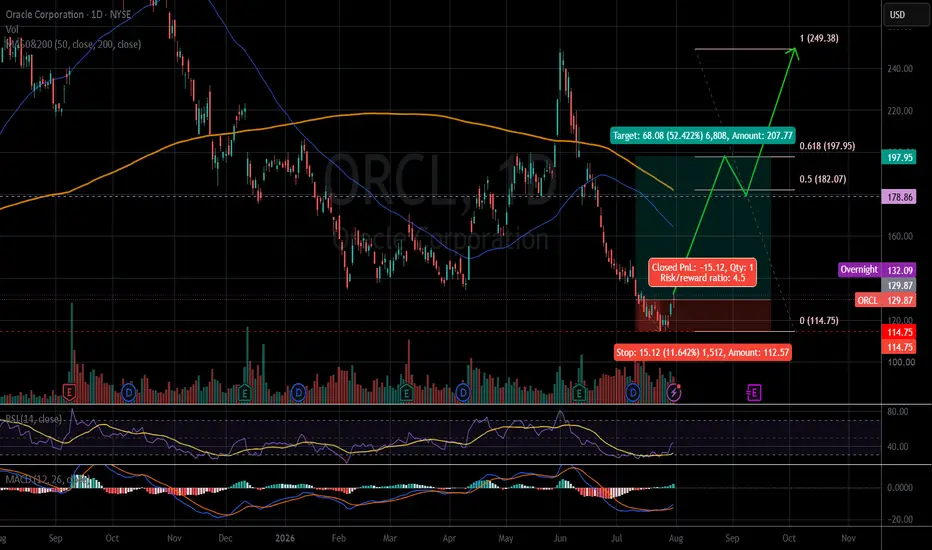
ORCL bullishThe weekly chart shows a bullish divergence with the RSI.
There were signs of a price increase last week, according to the RSI and MACD indicators.
The price closed on 07.31.2026: $129.87.
Price target: $197.95/ $249.38
Stop loss: $114.75 (-11.6%)
R/R: 4.5
IMO, amateur trader.
Good luck!
Watani Iron Steel (9513) : Confirmation Before the Next Move !!TADAWUL:9513
📈 Weekly Trendline Retest: Waiting for Confirmation Before the Next Move 🇸🇦
The stock has successfully retested its long-term weekly trendline, placing it at a critical technical decision point.
While the setup is becoming increasingly constructive, confirmation is still required before considering a high-conviction entry.
🔍 Technical Outlook
The current price action suggests that the market is attempting to convert the previous resistance into support.
However, rather than
GGG: Double Breakout After Quiet Accumulation – Next Leg Higher?Presenting another high-probability chart story.
After months of persistent selling pressure, GGG appears to have completed a textbook accumulation phase. Price spent several weeks moving sideways inside a tight range while volume gradually picked up, suggesting that stronger hands may have been accumulating shares rather than distributing them.
Now the technical picture is becoming much more interesting.
The stock has achieved a double breakout:
✅ Breakout above the local consolidation / ac
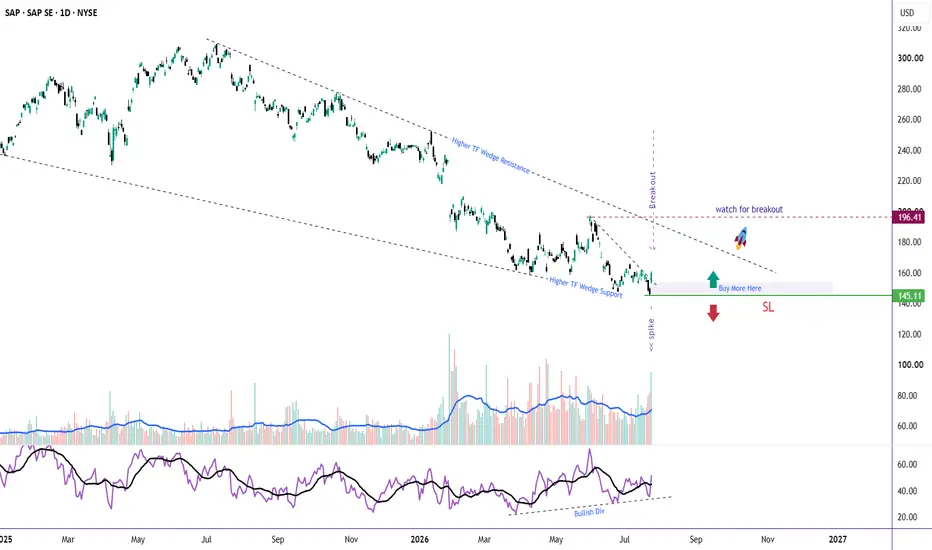
SAP: Bullish Reversal or Setting a Trap?SAP delivered strong earnings, and the market responded with conviction. The stock surged on exceptionally high volume, breaking out of its short-term downtrend—a sign that institutional buyers may be stepping back in.
But there's a bigger story unfolding.
📊 The Story
After almot a year of correcting within a higher-timeframe falling wedge, SAP has finally shown its first meaningful sign of strength.
The recent breakout came with:
🟢 A strong volume spike, adding credibility to the move.
🟢 B
The 9-21-41 EMA Strategy I Recommend Every Beginner Should LearnMost traders don't lose money because their entries are bad.
They lose money because they enter too early...
Exit too early...
Or trade against the trend.
A simple trading strategy should answer only three questions.
When should I enter?
Where should I place my stop loss?
When should I exit?
This strategy is designed to answer all three.
━━━━━━━━━━━━━━━━━━━━━━━━━━━━━━━━━━
The Logic Behind This Strategy
Every moving average has a different purpose.
9 EMA
Represents short-term momen
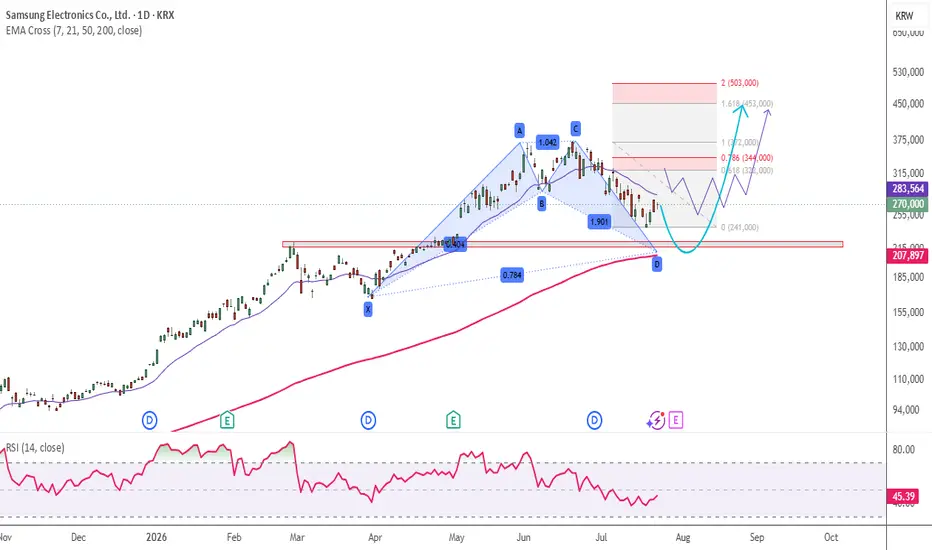
Samsung Electronics : Pullback Before the Next Rally ?KRX:005930 Daily Chart
📈 Key Decision Zone Ahead: Pullback Before the Next Rally? 👀
The stock has staged an impressive recovery after rebounding from the 0.55 Fibonacci retracement zone, confirming strong buying interest from a major technical support area.
However, the next challenge has arrived.
🔍 Technical Outlook
Price is now testing the Daily 20 EMA, which is acting as an immediate resistance level.
A decisive breakout above this dynamic resistance would strengthen the short-term bul
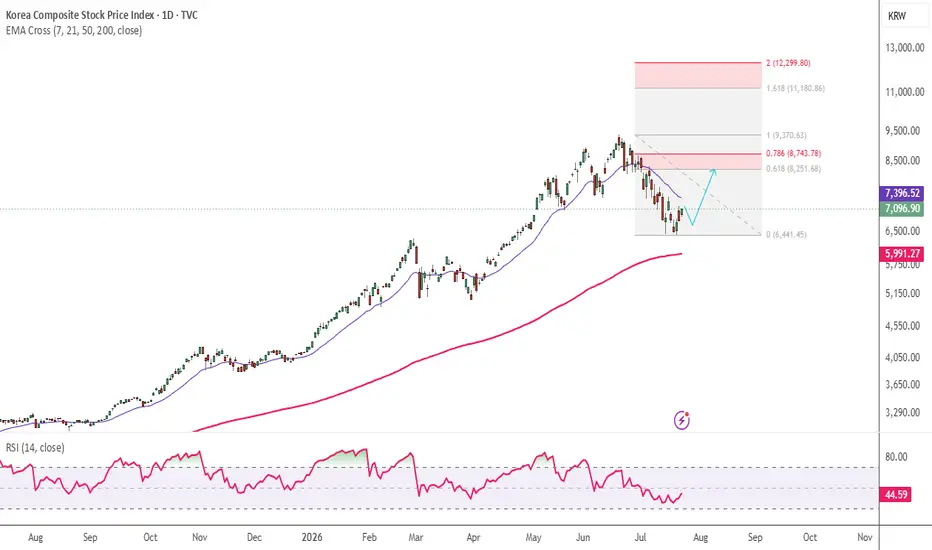
KOSPI : Bull Trap or Continuation Rally ?TVC:KOSPI
📈 Korea's "Talk of the Town" Index at a Critical Inflection Point — Breakout or Bull Trap? 🇰🇷
After forming a convincing double bottom near the 6,440 zone, the index has staged a healthy rebound and is now approaching the 20-day EMA, a key dynamic resistance level that could determine the next major trend.
The coming weeks may define whether this recovery evolves into a sustained uptrend—or proves to be another relief rally.
🔍 Technical Outlook
The recent double-bottom formation
National Medical Care : Is the Long-Term Trend Still at Risk?TADAWUL:4005
📉 Distribution Above 150–220: Is the Long-Term Trend Still at Risk? ⚠️
Price spent a considerable period in a distribution range between 150 and 220, suggesting significant supply was being absorbed by the market.
The 200 EMA remained in a strong uptrend until October 2024. However, the subsequent breakdown below this key long-term moving average marked a significant shift in market structure.
The brief recovery above the 200 EMA may have acted as a bull trap, attracting long-
XLU Bullish Divergence: Utilities Are Starting to Show StrengthXLU is showing improving momentum after forming a bullish divergence on the Stochastic Oscillator near the June low. More recently, price has held a higher low while Stochastic revisited a lower level—another constructive sign that selling pressure may be weakening.
Price is now testing the $45.60–$45.70 resistance area. A decisive close above this zone could confirm renewed strength and open the way for a continuation toward the previous swing highs. The rising trendline and the $44.40–$44.50
PEGA: Bullish Divergence at Support – Is the Downtrend Ending?PEGA has been in a steady downtrend since reaching its October 2025 high near 68. After months of selling pressure, the stock has finally reached a strong long-term support zone, where buyers are beginning to show signs of strength.
A bullish divergence has developed on the daily timeframe, indicating that downside momentum is weakening. This was followed by a powerful bullish engulfing candle, suggesting demand has returned at this key support level.
The first challenge for the bulls is the 3
KVYO: Bullish Divergence at Bottom – Is a Trend Reversal BrewingKVYO continues to trade within a long-term downtrend, but the technical picture might start improving from here.
The stock has formed a bullish divergence while forming strong support around 12.5, suggesting that bearish momentum is weakening. Adding to the bullish case, this week's price action produced a strong bullish engulfing candle accompanied by a significant surge in trading volume—often an early sign of institutional accumulation.
The 12.5 level now stands out as a well-defined suppor
Bullish EMA Cross Trapped Under the 200: Fading the Bear RallyBINANCE:ETHUSDT
The 20 EMA just crossed above the 50 EMA on the daily — normally a bullish signal. But context kills it. Price is printing this crossover ~17% below the 200 EMA ($2,200), deep inside a macro downtrend that's been in control since late April.
This is a bear rally, not a trend reversal.
📍 Setup:
After dropping from $2,700 to $1,500 in May–June, ETH bounced sharply. The 20/50 crossover confirms short-term momentum — but it's happening under heavy overhead resistance with the 20