XAUUSD — Doji Reversal From Psychological Buy Zone
Fundamental Analysis
Gold remains sensitive after a strong bearish move into lower liquidity. The market is still watching USD strength, Treasury yields, and upcoming U.S. data, which may create volatility around the current support zone.
For now, the broader pressure is still bearish, but the reaction from the psychological buying zone shows that a short-term recovery may develop if buyers confirm control.
Technical Analysis
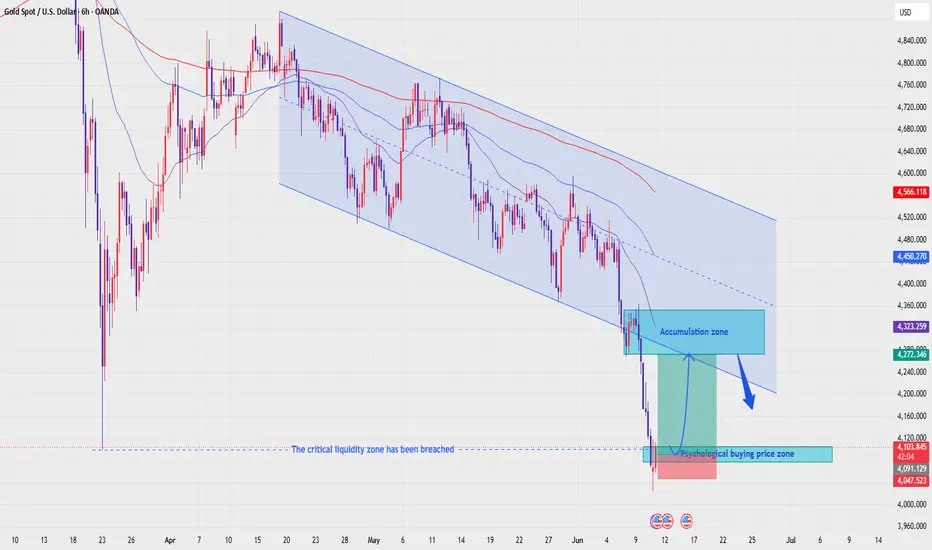
On the 6H chart, XAUUSD is still moving inside a descending channel, with EMA 34, EMA 89, and EMA 200 above price. This means the main trend has not fully turned bullish yet.
However, price has reached the 4,090 - 4,110 psychological buying zone and formed a doji-style reversal candle. This shows seller hesitation and may support a corrective bounce.
If buyers defend this zone, gold may recover toward 4,200 first, then 4,270 - 4,320, where the accumulation zone and descending trendline are located. This area will be important for the next reaction.
Important Key Levels
Current price area: 4,107
Psychological buying zone: 4,090 - 4,110
Doji reversal area: 4,090 - 4,110
Invalidation below: 4,047
Nearest recovery level: 4,200 - 4,220
Accumulation zone: 4,270 - 4,320
Trendline reaction zone: 4,270 - 4,320
EMA reaction area: 4,323 - 4,450
Higher EMA resistance: 4,566
Trading Scenario
Main Buy Scenario
Entry: 4,090 - 4,110
Stop Loss: 4,047
Take Profit 1: 4,200
Take Profit 2: 4,270
Take Profit 3: 4,320
Buy Condition
The preferred setup is to wait for gold to hold the 4,090 - 4,110 psychological buying zone. The doji candle near this area is an early sign that bearish momentum may be slowing down.
A buy setup becomes more valid if price confirms the doji reversal with bullish follow-through, such as a strong bullish candle close, higher low formation, or a reclaim above 4,120 - 4,140.
If this confirmation appears, the recovery move may target 4,200 first, then 4,270 - 4,320.
Alternative Sell Scenario
Entry: 4,270 - 4,320
Stop Loss: 4,360
Take Profit 1: 4,200
Take Profit 2: 4,110
Take Profit 3: 4,047
Sell Condition
This is not the main immediate view, but it should be monitored. If gold recovers into the accumulation zone and fails to break above the descending trendline, sellers may react again.
A sell setup becomes more valid if price forms bearish rejection from 4,270 - 4,320, such as a long upper wick, bearish engulfing candle, failed breakout, or lower high below the EMA structure.
Entry Conditions
Wait for bullish confirmation after the doji candle.
A reclaim above 4,120 - 4,140 would strengthen the buy setup.
If price breaks below 4,047, the recovery setup is invalid.
Watch for rejection if price reaches 4,270 - 4,320.
Always manage risk because gold can sweep liquidity before reversing.
Overall, the current view is that gold may attempt a corrective recovery after forming a doji reversal candle near the psychological buying zone. If buyers defend 4,090 - 4,110, XAUUSD may recover toward 4,200 first, then 4,270 - 4,320 where the accumulation zone and trendline reaction area are located.
Do you share the same view that gold may recover from this psychological buying zone, or are you waiting for stronger confirmation above 4,140?
Doji
Strong bullish signals on high timeframes = a market convinced INTRODUCTION:
This is a microcap bio so risk should be managed by strictly limiting position size. I won't bother talking about any fundamentals. We all know what makes startup bios move.
THE TA:
The above 1M chart provides a clean structure and a view of the following base bullish observations:
1. Overall downtrend is still intact but showing signs of imminent breaking.
2. The structural low at circa $0.54 was followed by a break of local downward diagonal resistance and the opening of a multi-year local uptrend.
3. The multi-year uptrend has printed three local higher lows so far.
4. After the last local higher high from March '24, price action entered a period of distribution/consolidation within a falling wedge pattern.
5. The last two higher lows printed as support on past resistance (gold ellipses).
6. The falling wedge extension provides a forecast to the top of local uptrend for a third local higher high.
7. The falling wedge extension reaches the horizontal area of the legacy gap-down from December '21. This means price action may not stop at the ceiling of the local uptrend and instead continue upward to close the gap and top out in the horizontal channel of market resistance at circa $13.
Supplemental TA:
1. 4W stochastic RSI is crossing up 20. Look left to see what price action had done the last two times that happened.
2. Multiple DOJIs on high timeframes. On the 3M, one has already printed and another one or a hammer likely confirms it at the end of June (this month). On the 5M, a DOJI has already printed and it will confirm in 5 more months. On the 6M, a DOJI prints at the end of June (this month); it could end up being a hammer. Every monthly timeframe from 7M to 12M has a DOJI printing right now.
FINAL WORDS:
Positions should be kept small and closed depending on whether diagonal resistance at the third implied local higher low holds or not. If it shows signs of holding, exit there. If price action breaks through, exit no later than $13. Should the market resistance area violently break to the upside, don't push your luck above $31.
The idea is invalidated if the multi-year local uptrend in which price action is currently moving breaks down to become a confirmed bear flag inside the overall downtrend. This will be signaled by price action closing markedly below the horizontal area of support/resistance in which it is firmly rooted at present.
***
The above was written by hand.
The above is not investment advice.
I am not a professional analyst or trader.
Part 1: Doji Trap - Why Traders Misread Market IndecisionHello Traders, this article has two parts: theory for understanding the concept, and practical for real market application.
What is a Doji?
---------------------
A Doji candlestick forms when the open and close prices are nearly equal. It shows that buyers and sellers fought, but neither side gained clear control. Think of it like a tug of war ending in a draw.
Psychology Behind It
----------------------------
A doji tells you:
1. Buyers pushed the price
2. Sellers pushed back
3. Market paused
4. Uncertainty exists
This often happens:
1. Before reversals
2. During trend exhaustion
3. Before breakouts
4. During consolidation
Yet, doji alone means nothing without context.
Types of Doji:
--------------------
1. Standard Doji
It has a small body with upper and lower wicks.
Meaning: pure indecision.
Setup: Wait for the confirmation candle.
2. Long-Legged Doji
It has Long upper and lower shadows.
Meaning: extreme battle between buyers and sellers.
Setup: Often appears before big moves.
3. Dragonfly Doji
It Looks like a “T.”
Open, close, and high are nearly the same.
The lower shadow is long.
Meaning: Sellers pushed down, but buyers rejected lower prices.
Setup: Usually bullish if found at support
.
4. Gravestone Doji
It looks like an upside-down “T.”
Long upper wick.
Meaning: Buyers pushed higher, but sellers rejected it.
Usually bearish at resistance.
5. Four Price Doji
It shows almost no movement.
It's Rare.
It shows an extreme lack of activity.
It usually has low liquidity.
How to Read Doji Correctly?
-------------------------------------
1. Where did it form?
At support = reversal
At resistance = rejection
At the middle of the range = often noise
2. What trend came before it?
After a strong uptrend? = Possible exhaustion
After a strong downtrend, = Possible buyer absorption
In the Sideways market, = Usually meaningless
3. Volume:
High volume doji = stronger signal
Low volume doji = weak signal
4. Confirmation candle:
Bullish confirmation - Next candle closes above the doji high
Bearish confirmation - Next candle closes below the doji low
Best Doji Trading Setups
---------------------------------
1. Reversal Setup
This setup appears after the market has already moved strongly in one direction and begins to lose momentum.
A doji forms near an important support or resistance zone, showing that the dominant side is starting to weaken.
It reflects hesitation as buyers and sellers reach a temporary balance after an extended trend.
The setup becomes valid only when the next candle confirms the reversal by breaking strongly in the opposite direction.
This is considered a high-probability setup because it often marks exhaustion before a trend change.
2. Breakout Pause Setup
This setup develops when the price is consolidating within a narrow range before making its next move.
A doji appears near a key breakout area, signaling temporary indecision and reduced momentum.
This pause often represents the market gathering energy before a strong expansion.
If the next candle breaks decisively above resistance or below support, it confirms the breakout direction.
Traders use this setup to identify explosive moves that begin after short periods of compression.
3. Fakeout Trap Setup
This setup occurs when the price briefly breaks above resistance or below support, creating the illusion of a real breakout.
A doji then forms, revealing hesitation and lack of conviction in the breakout attempt.
This often signals that the move was designed to attract breakout traders into weak positions.
Once trapped traders enter, the price sharply reverses back inside the range.
This setup is highly effective for spotting false breakouts and trading the reversal back toward liquidity.
4. Smart Money Trap Setup
This setup happens when institutional players intentionally push prices beyond obvious technical levels.
The purpose is to trigger retail stop-losses and create liquidity for larger market participants.
A doji often forms at this point, showing indecision as smart money absorbs positions from emotional traders.
The sharp rejection that follows confirms the liquidity sweep and reveals the true market direction.
This setup is especially powerful for traders who understand market structure, stop hunts, and liquidity-based price action.
Common Beginner Mistakes
-----------------------------------------
❌ Trading every doji as if it is a direct buy or sell signal without first analyzing the overall market context and structure.
❌ Ignoring the surrounding market structure, such as trend direction, key support and resistance zones, and liquidity areas where the doji is forming.
❌ Entering trades immediately after spotting a doji without waiting for a confirmation candle to validate the market’s next direction.
❌ Overlooking volume analysis, which often reveals whether the doji represents genuine indecision or simply weak market participation.
❌ Relying only on very low timeframes, where doji candles frequently appear as random market noise rather than meaningful price action signals.
A doji is a clue, not a complete trading signal, and its real value comes only when it is combined with context, confirmation, and proper market analysis.
Practical Trading Rules
--------------------------------
Always identify the overall market trend before acting on a doji signal.
Mark nearby support, resistance, and liquidity zones where a doji forms.
Wait for confirmation from the next candle before entering a trade.
Use stop-loss placement beyond the doji wick for better risk control.
Never trade a doji in isolation without a supporting market context.
A Doji is not a buy or sell signal by itself. It is a message from the market that momentum is pausing and a decision is approaching. Traders who combine doji analysis with structure, volume, confirmation, and liquidity concepts can transform a simple candlestick into a powerful decision-making tool.
Please wait for the next part, where we will cover the practical side in detail.
Most Traders Ignore This… But It Moves Price█ Most Traders Ignore This… But It Moves Price
Everyone watches the price.
Almost no one watches where real trading actually happens.
And that’s the difference.
█ The Signal Most People Misread
When you see a doji, most think:
“Indecision… nothing happened.”
That’s wrong.
If that doji forms with rising, high volume, something very important just happened:
Price tried to move.
A lot of traders got involved.
But neither side won.
That’s a battle with size behind it.
█ What It Actually Means
This is what you’re really seeing:
Orders getting absorbed
Positions are being built or unloaded
Liquidity is being exchanged heavily
But price doesn’t move.
Why?
Because someone is willing to take the other side in size.
That leaves a footprint.
█ The Edge (Simple Version)
High volume + no movement = unfinished business
And markets LOVE to come back to unfinished business.
That’s why these zones often:
Get revisited
Cause reactions
Act as support or resistance
Not because of magic…
Because that’s where real transactions happened.
█ Why This Works (Without Overcomplicating It)
Markets move when there’s an imbalance.
They pause when there’s balance.
These candles show a temporary balance at high participation.
And once the price leaves that balance?
It often comes back to test it again.
This aligns with:
Volume Profile (high volume nodes)
VWAP behavior
Auction Market Theory
Different tools… same principle.
█ How to Actually Use It
⚪ In Trends:
Uptrend → look for signals on pullbacks (support)
Downtrend → look for signals on bounces (resistance)
You’re spotting where the dominant side is likely defending.
⚪ In Ranges:
Top zones → look for rejection
Bottom zones → look for support
You’re mapping where rotation is most likely.
█ The Real Setup
The best trades don’t come from the signal itself.
They come from the retest.
Look for:
Price is returning to the zone
A clear reaction (hold, reject, or break)
Alignment with trend or range
That’s where the edge is.
█ Final Thought
Most traders chase movement.
Smart traders watch where movement failed with volume.
Because that’s where the next move often starts.
⚪ Spot these setups with our free Doji Volume Map (Zeiierman) indicator.
-----------------
Disclaimer
The content provided in my scripts, indicators, ideas, algorithms, and systems is for educational and informational purposes only. It does not constitute financial advice, investment recommendations, or a solicitation to buy or sell any financial instruments. I will not accept liability for any loss or damage, including without limitation any loss of profit, which may arise directly or indirectly from the use of or reliance on such information.
All investments involve risk, and the past performance of a security, industry, sector, market, financial product, trading strategy, backtest, or individual's trading does not guarantee future results or returns. Investors are fully responsible for any investment decisions they make. Such decisions should be based solely on an evaluation of their financial circumstances, investment objectives, risk tolerance, and liquidity needs.
Indecision on the Chart: What These Candles Really MeanIndecision in the market? You're not alone. Every trader has faced those moments when the charts seem to scream confusion. But here's the thing: indecision candlestick patterns aren't just noise. They hold secrets that, when decoded, can give you the upper hand. Let's dive in and learn how to spot these patterns and use them to your advantage.
Mastering Indecision Candlestick Patterns
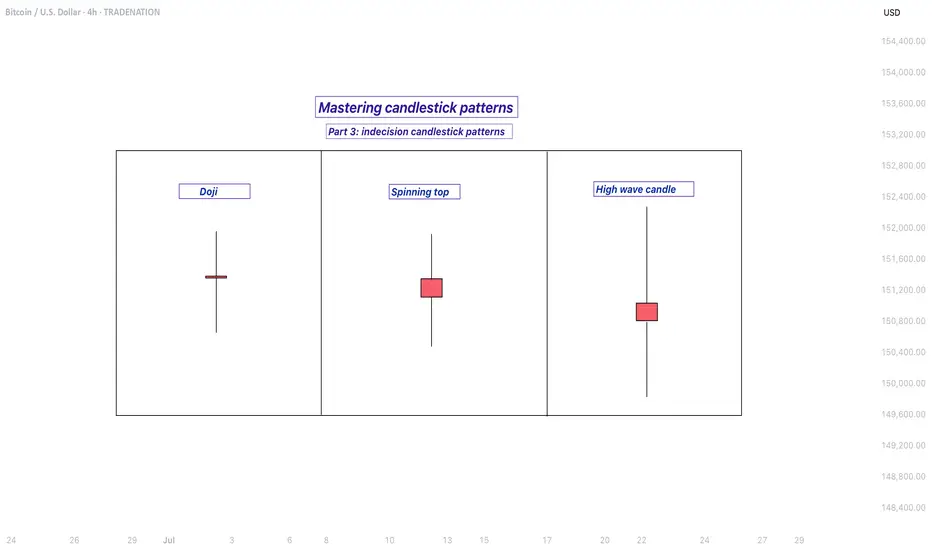
The most well-known indecision candles are the Doji, Spinning Top, and High Wave Candle. These candlesticks might seem tricky at first, but once you learn to recognize them and understand their context, they can serve as valuable tools in your trading strategy.
Doji
A Doji has a small body with nearly identical open and close prices, and long upper and lower wicks, indicating market indecision—neither buyers nor sellers gain control during that period.
When to look for confirmation: A Doji alone isn’t enough to trade. Wait for confirmation from the next candle: a bearish one after an uptrend may signal a reversal, while a bullish one after a downtrend might indicate the start of a rally.
Spinning Top
A Spinning Top is an indecision candle with a small body and longer upper and lower shadows. It indicates uncertainty, with more volatility than a Doji.
When to look for confirmation: A Spinning Top is more meaningful after a strong trend. Following an uptrend, it could signal weakening momentum. Wait for the next few candles to confirm the market’s direction.
High Wave Candle
The High Wave Candle is like the Spinning Top but with even longer wicks. It shows high volatility with no clear direction, as the price fluctuates widely but the open and close remain close, indicating indecision.
When to look for confirmation: Use the High Wave Candle with trend analysis. If it appears during consolidation or after a major move, it may signal a breakout. As with other indecision candles, wait for confirmation before acting.
Combining Indecision Candles with Indicators
While indecision candle patterns can provide useful insights, they are most effective when combined with other technical indicators. Here are some ways to use them in combination:
Moving Averages: Use moving averages (like the 50-period or 200-period) as a trend filter. If a Doji or Spinning Top forms above a moving average and the next candle confirms a reversal, it may signal trend continuation.
Relative Strength Index (RSI) : If an indecision candle forms when RSI is at extreme levels (above 70 or below 30), it may signal an upcoming pullback or reversal.
Volume: A high-volume candle following an indecision candlestick often confirms strong follow-through. Without volume, these patterns may be less reliable.
Where to Avoid Using Indecision Candles
While indecision candles are useful, there are some scenarios where relying on them without confirmation can be misleading:
Choppy Markets: Indecision candles appear frequently and may not signal real reversals.
During News Events: Sharp price spikes can create false indecision signals.
Lack of Context: A Doji in sideways price action has less significance than one after a strong trend.
Indecision candles signal uncertainty, but don’t act on them blindly. Always combine them with other analysis and make decisions based on your own judgment!
Doji Candlestick: A Key to Market ReversalsAlright, let’s break down the Doji candlestick pattern.
If you're trading crypto, you've probably bumped into this little guy at some point. It’s not a wild trendsetter on its own, but it definitely has something to say about the market’s mood 🤔. The Doji is one of those candlestick patterns you’ll want to pay attention to if you're trying to catch reversals or just understand what's going on in the market.
What is the Doji Candlestick Pattern?
A Doji candlestick pattern forms when the opening and closing prices are almost identical. The body of the candle becomes tiny, while the shadows (the lines extending above and below the body) are long. It might look like a cross, plus sign, or even an “✖️.” The key point is that the market is indecisive, which is why this pattern gets so much attention.
🐂Bullish Doji Candlestick Pattern
So, what happens when you spot a Doji after a downtrend? You might be looking at a potential reversal, signaling that the bears are running out of steam. A bullish Doji candlestick pattern forms when the market closes near the opening price but after a steady downtrend. It’s like the bulls are just waiting for the right moment to step in. But don’t jump in too quickly! A single Doji doesn't mean the market's ready to flip. Look for confirmation in the following candles — ideally, a strong bullish candle that closes above the previous high.
🐻Bearish Doji Candlestick Pattern
Now, flip the script. If you see a bearish Doji candlestick pattern after a nice uptrend, it’s time to pay attention. This signals that the bulls might be running out of energy, and the bears could be gearing up for a push. It’s not an instant signal to sell, but it’s a red flag that the market’s strength is weakening. After spotting the Doji, wait for confirmation — usually in the form of a bearish candle that closes below the previous low.
How to Use the Doji Trading Pattern Effectively?
So you’ve spotted a Doji chart pattern. Now what? This pattern is all about context. If it shows up in the middle of a strong trend, it’s probably just a pause in the action — not a reversal. But, if it appears after a big rally or a significant drop, it could indicate that market sentiment is shifting.
Here’s the key: Confirmation is king. The Doji itself doesn’t tell you where the market is going. It only tells you that the market is uncertain. Look for the next few candles to see if they support a reversal — a bullish follow-up candle after a bearish Doji or a bearish candle after a bullish Doji.
🏁Final Thoughts
The Doji candlestick pattern can be a valuable addition to your trading strategy, offering insights into market sentiment when combined with other indicators. While it highlights moments of indecision, it's essential to exercise caution and not rely solely on a single signal. In trading, context, confirmation, and proper risk management are key. Remember, tools like the Doji are meant to inform your decisions, but ultimately, it's your judgment and strategy that will guide your moves. Happy trading!
SENSEX: Intraday Levels for 10th SEP 2025 (BSE30)SENSEX Spot: Intraday Levels for 10th SEP 2025
^^^^^^^ Plot Levels Using 3 Min, 5 Min Time frame in your Chart for Better Analysis ^^^^^^^
L#1: If the candle crossed & stays above the “Buy Gen”, it is treated / considered as Bullish bias.
L#2: If the candle stays above “Sell Gen” but below “Buy Gen”, it is treated / considered as Sidewise. Aggressive Traders can take Long position near “Sell Gen” either retesting or crossed from Below & vice-versa i.e. can take Short position near “Buy Gen” either retesting or crossed downward from Above.
L#3: If the candle crossed & stays below the “Sell Gen”, it is treated / considered a Bearish bias.
L#4: Possibility / Probability of REVERSAL near RL#1 & UTgt
HZ => Hurdle Zone, Specialty of “HZ#1 & HZ#2” is Sidewise (behaviour in Nature)
Rest Plotted and Mentioned on Chart
Color code Used:
Green =. Positive bias.
Red =. Negative bias.
RED in Between Green means Trend Finder / Momentum Change
/ CYCLE Change and Vice Versa.
Notice One thing: HOW LEVELS are Working.
Use any Momentum Indicator / Oscillator or as you "USED to" to Take entry.
📢 Disclaimer
I am not a SEBI-registered financial adviser.
The information, views, and ideas shared here are purely for educational and informational purposes only. They are not intended as investment advice or a recommendation to buy, sell, or hold any financial instruments.
Please consult with your financial advisor before making any trading or investment decisions
Trading and investing in the stock market involves risk, and you should do your own research and analysis. You are solely responsible for any decisions made based on this research.
Ethereum climbing, but RSI throwing shade stay sharpGuys, I’ve also put together an Ethereum analysis for you.
Ethereum is an amazing coin that’s not up for debate. But it’s already climbed quite a bit. I haven’t bought in at this point, but if it drops to the 3,538.0 – 3,357.0 range, I’d definitely be looking to buy.🔥
Right now, we’re in an uptrend, but on the 1‑day chart I spotted a divergence on the RSI indicator. It looks like this divergence might be playing out. If the price falls below the 4,000 level, that would confirm the divergence is in effect.
Guys, I would like to thank everyone who supports my analyses with their likes. Your likes boost my motivation, and that's why I share these analyses.
Indecision - The Human Experience of Being A DojiContext : Daily Chart ETHUSD.
Uptrend intact.
Price sitting right on the trend line.
Price consolidating into a series of dojis.
Imagine this scenario.
You have a plan.
You're a trend trader.
You're looking to get long.
You start to observe the context…
We’re into September.
Tech showing signs of correcting.
Gold heading up.
This chart... right here, right now is consolidating.
And so you experience a little flicker.
A small niggle …
There it is.
The voice of doubt.
"I should get long but maybe this is the one that gives way".
You feel a moment of indecision.
And you’re stuck frozen
The human version of a doji.
Indecision has a cost and takes a toll.
Not just in lost opportunity BUT in energy and confidence.
A simple practice to help guard against this:
Pre-decide the conditions.
Write down before you enter what tells you to stay in and what tells you to step aside.
Separate the signal from the noise.
Notice the flicker of doubt, but act on your plan, not the passing thought.
Doubt will always show up.
The edge comes from knowing what you’ll do when it does.
AMD — Watch for Pivot Reversal or Trend ContinuationMarket view
Actual volatility is high, confirmed by the Volatility Bars indicator.
The rate of change in the SMA is decreasing, suggesting momentum is weakening.
The previous candle was a Doji, indicating short-term indecision.
Price closed below the prior day’s low, adding bearish pressure.
A potential Pivot Point reversal is forming.
This reversal setup is confirmed by increasing Convolution Probability, supporting a higher chance of a directional move.
Trade plan
Long (trend continuation): buy on a break above the August 19, 2025 open.
Short (reversal): sell on a break below the pivot reversal at 158.25.
Stop-loss and position sizing: use volatility-based stops (e.g., ATR multiple) and risk no more than a small fixed percentage of capital per trade.
Mastering indecision candlestick patterns - How to use it!In this guide I will explain the indecision candlestick patterns. The next subjects will be discussed:
- What are indecision candlestick patterns?
- What is the doji?
- What is the spinning top?
- What is the high wave candle?
What are indecision candlestick patterns?
Indecision candlestick patterns are formations on a price chart that suggest uncertainty in the market. They appear when neither buyers nor sellers have full control, meaning the price moves up and down during the trading period but closes near where it opened. This creates a candle with a small real body and often long wicks on either side, showing that the market explored both higher and lower prices but ended up not committing strongly in either direction. These patterns are often seen during periods when traders are waiting for more information before making bigger moves.
What is the doji?
One of the most well-known indecision candles is the doji. A doji forms when the opening price and the closing price are almost identical, resulting in a very thin body. The wicks, which show the highest and lowest prices of the period, can be long or short depending on market activity. A doji tells us that buying and selling pressure were almost equal, which can happen during pauses in trends or before major reversals.
What is the spinning top?
Another type is the spinning top. A spinning top also has a small body, but unlike the doji, the open and close are not exactly the same. The wicks on both sides are typically of similar length, indicating that the market moved both up and down significantly before settling close to the starting point. This pattern reflects hesitation and a balanced struggle between bulls and bears.
What is the high wave candle?
The high wave candle is a more dramatic version of indecision. It has a small real body like the other patterns but features very long upper and lower shadows. This means the market swung widely in both directions during the period, but ultimately closed without making strong progress either way. The high wave candle signals strong volatility paired with uncertainty, which can often precede sharp moves once the market chooses a direction.
When you see these types of candles, they are essentially the market saying “I’m not sure yet.” They often appear at turning points or before big news events and can warn that the current trend may be losing strength. However, they are not guarantees of reversal or continuation on their own. Traders usually combine them with other technical signals or chart patterns to confirm whether the market will break out in one direction or the other.
-------------------------
Disclosure: I am part of Trade Nation's Influencer program and receive a monthly fee for using their TradingView charts in my analysis.
Thanks for your support. If you enjoyed this analysis, make sure to follow me so you don't miss the next one. And if you found it helpful, feel free to drop a like 👍 and leave a comment 💬, I’d love to hear your thoughts!
Mastering bullish candlestick patterns - How to use it!In this guide, we will explore some of the most important bullish candlestick patterns used in technical analysis. These patterns are essential tools for traders and investors who want to better understand market sentiment and identify potential reversal points where prices may start moving upward.
What will be explained:
- What are bullish candlestick patterns?
- What is the hammer?
- What is the inverted hammer?
- What is the dragonfly doji?
- What is the bullish engulfing?
- What is the morning star?
- What is the three white soldiers?
- How to use bullish candlestick patterns in trading?
What are bullish candlestick patterns?
Bullish candlestick patterns are specific formations on a candlestick chart that signal a potential reversal from a downtrend to an uptrend. These patterns are used by traders and investors to identify moments when the market sentiment may be shifting from bearish to bullish. Recognizing these patterns can help traders time their entries and make more informed decisions based on price action and market psychology. While no single pattern guarantees success, they can provide valuable clues when combined with other forms of analysis such as support and resistance, trendlines, and volume.
What is the Hammer?
The Hammer is a single-candle bullish reversal pattern that typically appears at the bottom of a downtrend. It has a small real body located at the upper end of the trading range, with a long lower shadow and little to no upper shadow. The long lower wick indicates that sellers drove the price lower during the session, but buyers stepped in strongly and pushed the price back up near the opening level by the close. This shift in momentum suggests that the downtrend could be coming to an end, and a bullish move might follow.
What is the Inverted Hammer?
The Inverted Hammer is another single-candle bullish pattern that also appears after a downtrend. It has a small body near the lower end of the candle, a long upper shadow, and little to no lower shadow. This pattern shows that buyers attempted to push the price higher, but sellers managed to bring it back down before the close. Despite the failure to hold higher levels, the buying pressure indicates a possible reversal in momentum. Traders usually look for confirmation in the next candle, such as a strong bullish candle, before acting on the signal.
What is the Dragonfly Doji?
The Dragonfly Doji is a special type of candlestick that often indicates a potential bullish reversal when it appears at the bottom of a downtrend. It forms when the open, high, and close prices are all roughly the same, and there is a long lower shadow. This pattern shows that sellers dominated early in the session, pushing prices significantly lower, but buyers regained control and drove the price back up by the end of the session. The strong recovery within a single period suggests that the selling pressure may be exhausted and a bullish reversal could be imminent.
What is the Bullish Engulfing?
The Bullish Engulfing pattern consists of two candles and is a strong indication of a reversal. The first candle is bearish, and the second is a larger bullish candle that completely engulfs the body of the first one. This pattern appears after a downtrend and reflects a shift in control from sellers to buyers. The bullish candle’s large body shows strong buying interest that overpowers the previous session’s selling. A Bullish Engulfing pattern is even more significant if it occurs near a key support level, and it often signals the beginning of a potential upward move.
What is the Morning Star?
The Morning Star is a three-candle bullish reversal pattern that occurs after a downtrend. The first candle is a long bearish one, followed by a small-bodied candle (which can be bullish, bearish, or a doji), indicating indecision in the market. The third candle is a strong bullish candle that closes well into the body of the first candle. This formation shows a transition from selling pressure to buying interest. The Morning Star is a reliable signal of a shift in momentum, especially when confirmed by high volume or a breakout from a resistance level.
What is the Three White Soldiers?
The Three White Soldiers pattern is a powerful bullish reversal signal made up of three consecutive long-bodied bullish candles. Each candle opens within the previous candle’s real body and closes near or at its high, showing consistent buying pressure. This pattern often appears after a prolonged downtrend or a period of consolidation and reflects strong and sustained buying interest. The Three White Soldiers suggest that buyers are firmly in control, and the market may continue moving upward in the near term.
How to use bullish candlestick patterns in trading?
To effectively use bullish candlestick patterns in trading, it’s important not to rely on them in isolation. While these patterns can signal potential reversals, they work best when combined with other technical tools such as support and resistance levels, moving averages, trendlines, and volume analysis. Traders should also wait for confirmation after the pattern forms, such as a strong follow-through candle or a break above a resistance level, before entering a trade. Risk management is crucial—always use stop-loss orders to protect against false signals, and consider the broader market trend to increase the probability of success. By integrating candlestick analysis into a comprehensive trading strategy, traders can improve their timing and increase their chances of making profitable decisions.
Thanks for your support. If you enjoyed this analysis, make sure to follow me so you don't miss the next one. And if you found it helpful, feel free to drop a like 👍 and leave a comment 💬, I’d love to hear your thoughts!
#TAOUSDT #4h (ByBit) Ascending trendline near breakdownBittensor printed an evening doji star deviation, a retracement down to 200 MA support seems next.
⚡️⚡️ #TAO/USDT ⚡️⚡️
Exchanges: ByBit USDT
Signal Type: Regular (Short)
Leverage: Isolated (5.0X)
Amount: 5.0%
Entry Targets:
1) 430.38
Take-Profit Targets:
1) 362.01
Stop Targets:
1) 464.64
Published By: @Zblaba
GETTEX:TAO BYBIT:TAOUSDT.P #4h #Bittensor #AI #DePIN bittensor.com
Risk/Reward= 1:2.0
Expected Profit= +79.4%
Possible Loss= -39.8%
Estimated Gaintime= 1 week
How to Trade Doji Candles on TradingViewLearn to identify and trade doji candlestick patterns using TradingView's charting tools in this comprehensive tutorial from Optimus Futures. Doji candles are among the most significant candlestick formations because they signal market indecision and can help you spot potential trend reversal opportunities.
What You'll Learn:
• Understanding doji candlestick patterns and their significance in market analysis
• How to identify valid doji formations
• The psychology behind doji candles: when buyers and sellers fight to a draw
• Using volume analysis to confirm doji pattern validity
• Finding meaningful doji patterns at trend highs and lows for reversal setups
• Timeframe considerations for doji analysis on any chart period
• Step-by-step trading strategy for doji reversal setups
• How to set stop losses and profit targets
• Real example using E-Mini S&P 500 futures on 60-minute charts
This tutorial may help futures traders and technical analysts who want to use candlestick patterns to identify potential trend reversals. The strategies covered could assist you in creating straightforward reversal setups when market indecision appears at key price levels.
Learn more about futures trading with Tradingview: optimusfutures.com
Disclaimer:
There is a substantial risk of loss in futures trading. Past performance is not indicative of future results. Please trade only with risk capital. We are not responsible for any third-party links, comments, or content shared on TradingView. Any opinions, links, or messages posted by users on TradingView do not represent our views or recommendations. Please exercise your own judgment and due diligence when engaging with any external content or user commentary.
This video represents the opinion of Optimus Futures and is intended for educational purposes only. Chart interpretations are presented solely to illustrate objective technical concepts and should not be viewed as predictive of future market behavior. In our opinion, charts are analytical tools—not forecasting instruments. Market conditions are constantly evolving, and all trading decisions should be made independently, with careful consideration of individual risk tolerance and financial objectives.
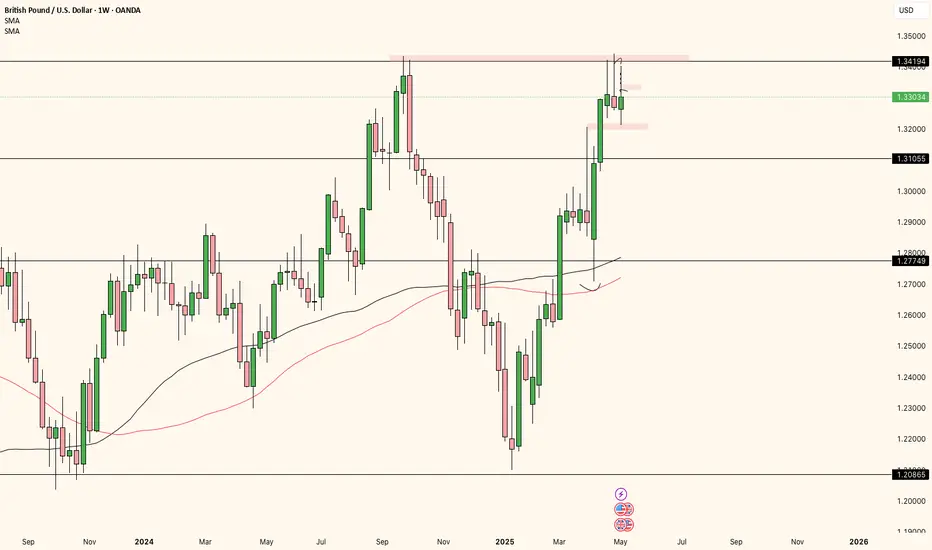
GBPUSD ANALYSISThe weekly candle rejected weekly resistance and closed as a doji for consecutive weeks, which could mean price could be transitioning to a bearish market. Overall price is still bullish, but it did form an H4 LH so I'd look for price to retrace to the H4 support. If price breaks & retest minor M15 support around 1.32970, I'd start looking for sells with my TP being 1.32100.
Daily and weekly poised for a bull run, BULL FLAG $SKLZPersonally see 6.89-7.33 in the coming weeks potentially 9$-10$ by summer with momentum and positive ER. SKLZ is a sleeping giant
Many analyst say its a buy and the chart is bullish for a 6month swing trade easy or a great long term position. Final time we see south of 5$ !?
We shall see, in time
SLong
$GLD - bullish momentum soon to stallHello, I was bullish on AMEX:GLD for a bit and now examining the charts, multiple frames, this may be setting up for a good short. If geopolitics and tariff talks deescalate then this should cool off. The Elliot wave placed indicates some time for a correction/pull back on this hot commodity and the candle on the Daily from Friday is a spinning stop doji which can indicate reversal in an uptrend. Also, we have so many gaps up that happened in 3 day span, crazy actually. I labeled areas of targets to fill these gaps. Expecting a retracement to $280.
WSL.
Mastering Candlestick Patterns for better trades!Candlestick patterns are a powerful tool for identifying market sentiment and potential reversals. Let's break down some key single and double candlestick formations seen in this chart:
🕯️Single Candlestick Patterns:
- Doji – Represents indecision in the market, signaling a potential reversal.
- Inverted Hammer – A bullish reversal pattern after a downtrend, indicating buyers are stepping in.
- Long-Legged Doji – Suggests market uncertainty; watch for confirmation before taking a position.
- Bearish Closing Marubozu – A strong bearish signal showing sellers' dominance, with no upper wick.
- Bullish Opening Marubozu – A strong bullish candle with no lower wick, signaling a potential uptrend.
🕯️Double Candlestick Patterns:
- Bullish Engulfing – A strong bullish reversal pattern where the green candle fully engulfs the previous red candle, signaling buying pressure.
- Bullish Harami – A potential trend reversal where a small green candle is "inside" the previous large red candle, indicating a slowdown in selling.
- Cross Doji – Suggests hesitation between buyers and sellers, often appearing before a reversal.
How to Use Them in Trading?
✔️ Combine candlestick patterns with indicators like RSI, MACD, or Moving Averages for stronger confirmations.
✔️ Look for patterns near key support and resistance levels to increase reliability.
✔️ Always wait for confirmation before entering a trade!
Mastering Candlestick Patterns: Visual Guide for Traders
🔵 Introduction
Candlestick charts are among the most popular tools used by traders to analyze price movements. Each candlestick represents price action over a specific time period and provides valuable insights into market sentiment. By recognizing and understanding candlestick patterns, traders can anticipate potential price reversals or continuations, improving their trading decisions. This article explains the most common candlestick patterns with visual examples and practical Pine Script code for detection.
🔵 Anatomy of a Candlestick
Before diving into patterns, it's essential to understand the components of a candlestick:
Body: The area between the open and close prices.
Upper Wick (Shadow): The line above the body showing the highest price.
Lower Wick (Shadow): The line below the body showing the lowest price.
Color: Indicates whether the price closed higher (bullish) or lower (bearish) than it opened.
An illustrative image showing the anatomy of a candlestick.
🔵 Types of Candlestick Patterns
1. Reversal Patterns
Hammer and Hanging Man: These single-candle patterns signal potential reversals. A Hammer appears at the bottom of a downtrend, while a Hanging Man appears at the top of an uptrend.
Engulfing Patterns:
- Bullish Engulfing: A small bearish candle followed by a larger bullish candle engulfing the previous one.
- Bearish Engulfing: A small bullish candle followed by a larger bearish candle engulfing it.
Morning Star and Evening Star: These are three-candle reversal patterns that signal a shift in market direction.
Morning Star: Occurs at the bottom of a downtrend, indicating a potential bullish reversal. It consists of:
- A long bearish (red) candlestick showing strong selling pressure.
- A small-bodied candlestick (bullish or bearish) indicating indecision or a pause in selling. This candle often gaps down from the previous close.
- A long bullish (green) candlestick that closes well into the body of the first candle, confirming the reversal.
Evening Star: Appears at the top of an uptrend, signaling a potential bearish reversal. It consists of:
- A long bullish (green) candlestick showing strong buying pressure.
- A small-bodied candlestick (bullish or bearish) indicating indecision, often gapping up from the previous candle.
- A long bearish (red) candlestick that closes well into the body of the first candle, confirming the reversal.
2. Continuation Patterns
Doji Patterns: Candles with very small bodies, indicating market indecision. Variations include Long-Legged Doji, Dragonfly Doji, and Gravestone Doji.
Rising and Falling Three Methods: These are five-candle continuation patterns indicating the resumption of the prevailing trend after a brief consolidation.
Rising Three Methods: Occurs during an uptrend, signaling a continuation of bullish momentum. It consists of:
- A long bullish (green) candlestick showing strong buying pressure.
- Three (or more) small-bodied bearish (red) candlesticks that stay within the range of the first bullish candle, indicating a temporary pullback without breaking the overall uptrend.
- A final long bullish (green) candlestick that closes above the high of the first candle, confirming the continuation of the uptrend.
Falling Three Methods: Appears during a downtrend, indicating a continuation of bearish momentum. It consists of:
- A long bearish (red) candlestick showing strong selling pressure.
- Three (or more) small-bodied bullish (green) candlesticks contained within the range of the first bearish candle, reflecting a weak upward retracement.
- A final long bearish (red) candlestick that closes below the low of the first candle, confirming the continuation of the downtrend.
🔵 Coding Candlestick Pattern Detection in Pine Script
Detecting patterns programmatically can improve trading strategies. Below are Pine Script examples for detecting common patterns.
Hammer Detection Code
//@version=6
indicator("Hammer Pattern Detector", overlay=true)
body = abs(close - open)
upper_wick = high - math.max(close, open)
lower_wick = math.min(close, open) - low
is_hammer = lower_wick > 2 * body and upper_wick < body
plotshape(is_hammer, title="Hammer", style=shape.triangleup, location=location.belowbar, color=color.green, size=size.small)
Bullish Engulfing Detection Code
//@version=6
indicator("Bullish Engulfing Detector", overlay=true)
bullish_engulfing = close < open and close > open and close > open and open < close
plotshape(bullish_engulfing, title="Bullish Engulfing", style=shape.arrowup, location=location.belowbar, color=color.blue, size=size.small)
🔵 Practical Applications
Trend Reversal Identification: Use reversal patterns to anticipate changes in market direction.
Confirmation Signals: Combine candlestick patterns with indicators like RSI or Moving Averages for stronger signals.
Risk Management: Employ patterns to set stop-loss and take-profit levels.
🔵 Conclusion
Candlestick patterns are powerful tools that provide insights into market sentiment and potential price movements. By combining visual recognition with automated detection using Pine Script, traders can enhance their decision-making process. Practice spotting these patterns in real-time charts and backtest their effectiveness to build confidence in your trading strategy.
AES Corporation - Short term view with strong supportSo first of all both price and indicators are confirming the downtrend.
Today NYSE:AES opened with a gap succeeding yesterday's equilibrium in price with doji candles.
The price is still in the middle of the regression line and in the next few days the price don't seems to be close to upper 2 SD.
In the print above the yellow line shows the support at $11.43. The image's time horizon starts at the end of 2006.
Furthermore looking at short ratio available online the value is about 2,7 from mid October as well as more than 22M short interest
Short term trading : Be carreful of this candlestick config !!!You can acknowledge with me the absolutely astonishing XRP perf but when it's too nice to be true, a pull back does occur at some point. Please consider this not as a financial advice but educational content
Take care _
Do sport _
Take profit _