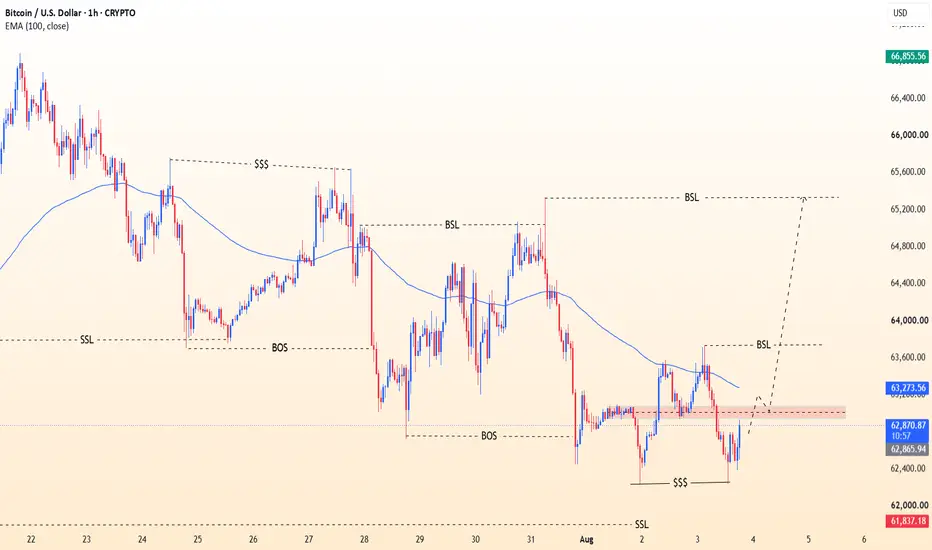
BTC/USD Update: Liquidity Swept & Bullish Reversal Loading!Bitcoin just delivered a classic Smart Money Concepts (SMC) setup on the 1-Hour chart!
Price took out the equal lows ($$$) to sweep sell-side liquidity (SSL) below $62,400 and is now building momentum toward the upside, forming a solid Double Bottom structure inside a key support zone.
We are eyeing a breakout above the local resistance zone around $63,600 (BSL) to confirm the shift in momentum toward upper Buy-Side Liquidity targets! 🎯
🟢 TRADE SIGNAL SETUP: BTC/USD (Spot / Futures)
Entry Zon
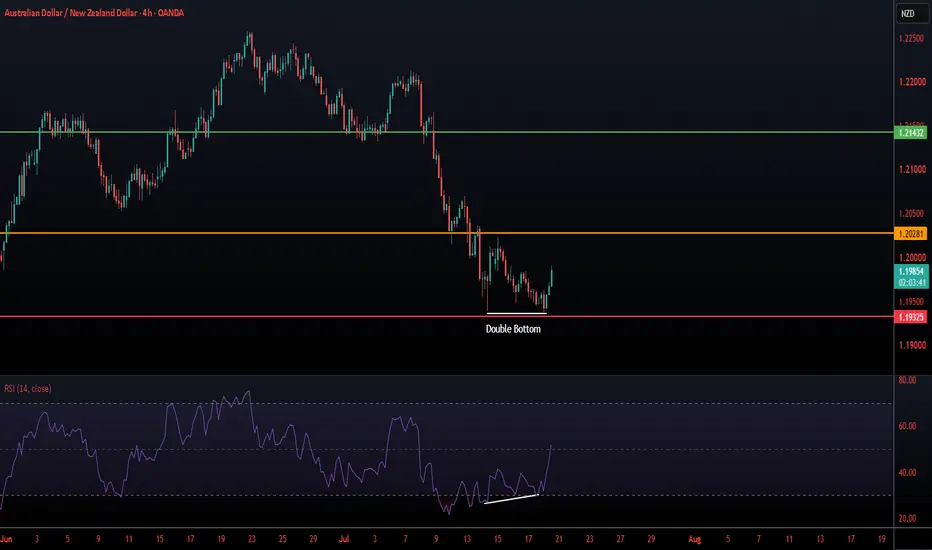
Double Bottom
NVDA - Resistance Retest and Double Bottom Setup💡 Swing setup idea
Resistance retest / double bottom breakout
🔎 Analysis summary:
The price is back near resistance again, but this time the setup looks stronger. We can see a double bottom closing, a cross above the 50 SMA, and buyers volume starting to step in.
👀 Levels to watch:
Entry trigger: Break above $213.80
Target: $236.54
Stop: Under the breakout level
💬 Will the price break resistance this time? Let me know in the comments! 👇
Good luck!
⚠️ Note: This is for educational
KKR - 50 SMA Reclaim and Double Bottom💡 Swing setup idea
50 SMA reclaim
🔎 Analysis summary:
The price moved above the 50 SMA, came back to test it, and then continued higher into resistance while closing a double bottom pattern. That gives the chart a constructive look if price can confirm above the trigger.
👀 Levels to watch:
Entry trigger: Break above $108.40
Target: $133.20
Stop: Under the breakout level
💬 What do you think about this setup? Let me know in the comments! 👇
Good luck!
⚠️ Note: This is for educational
NVDA Bounced Off 188.79 Again - Still Below The Base.NVDA Bounced Off 188.79 Again - Still Below The Base.
NVDA found the low again and bounced, turning up from 188.79 to 193.55 with the hourly conviction back to top-quartile. But this is the second bounce off the same low, and price is still well below the 202.20 base and even below the nearer 199.89 shelf. The bear print that fired into yesterday's drop is already underwater, which is constructive, but a double-bottom near 189 does not become a recovery until it reclaims something overhead. A b
$SPCX two patterns, two directionsNASDAQ:SPCX
Interesting short-term setup here. Friday’s post-market price was hovering around the $112 mark, keeping the descending triangle in play.
Conversely, a double bottom pattern is currently in the making and would validate on a break of $118.26 to project a rebound target of $125.
Neither setup is valid until price breaks out.
The most likely direction usually aligns with the prevailing trend, so the triangle may prove the more favorable one here.
A potential DOUBLE-BOTTOM patternAs it can be seen on the chart, a potential double bottom chart pattern could be formed in the (near) future. In order for it to be a reality requires some conditions :
1) The two bottoms that can be viewed should be in the same area of value , the support area.
We can see that this is real at this point , as it is also marked on the chart.
2) The price should break and eventually get above the previous resistance level (4,202.638$)
-the neck- which is marked in the orange rectangle. So, that i
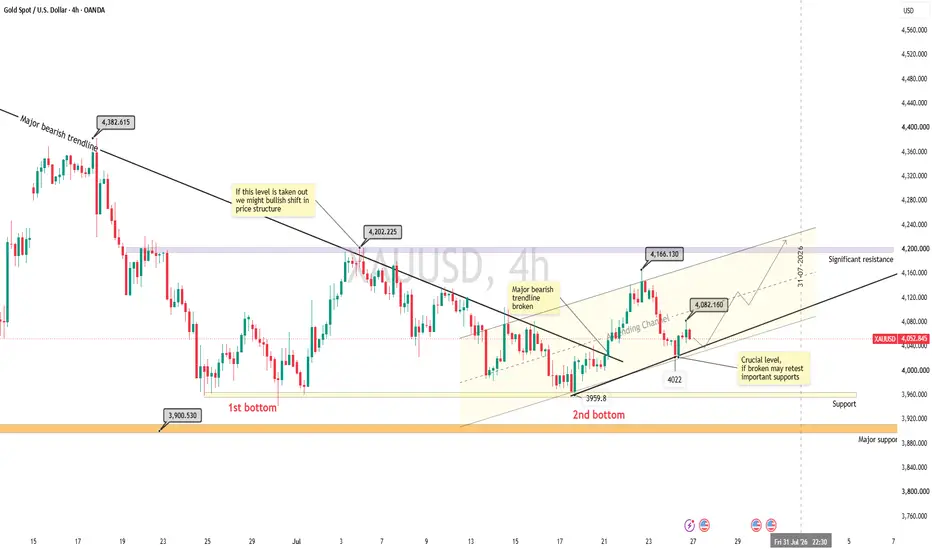
Gold(XAUUSD) Outlook for the upcoming weekIn current week Gold went through a roller coaster ride where after the breakout form a major bearish trendline at 4030, it retested the level 4166 and again returned back the 4022, structurally gold seems to be moving within a ascending channel, currently taking support of lower boundary, bounce is expected following to which price might retest the significant resistance zone.
However breaking of the channel below the level of 4022 can lead for deeper corrections as trend on the higher timefra
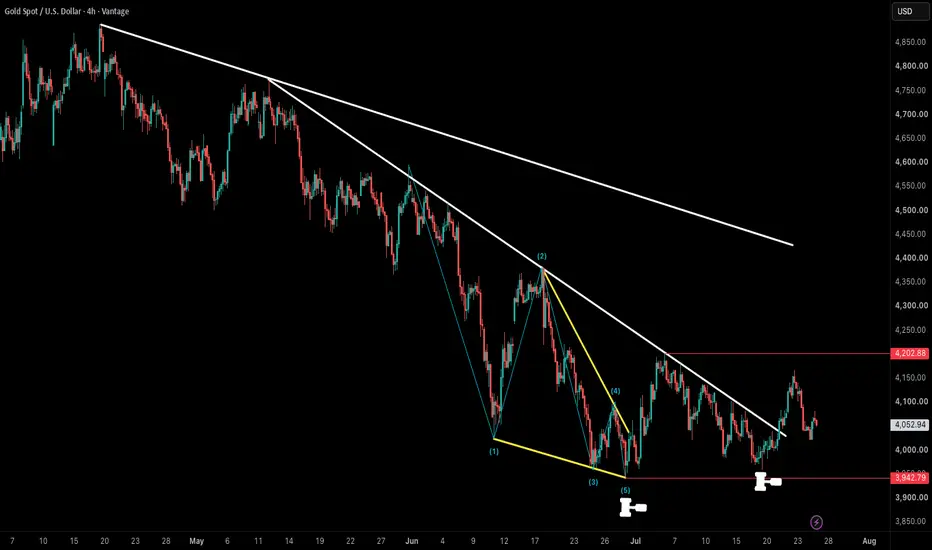
ending diagonal vs fed rate pausegold still under selling pressure below 4200 ahead of fomc week
despite recent two cool inflation report fed warsh said this is not mission acomlished and trump iran war, tariff both continue
but price first made elliott wave ending diagonal near 4k area then retest that low again
4200 most important level to confirm this breakout or just correction in bear market
trendline also breakout last week but gold immediately fall back to trend line
I got stopped on gold two weeks ago. I'm buying it againXAU/USD, long swing setup (1D)
THE SETUP
Gold has now bounced off the same floor three times. The two clean daily lows print at 3,959.08 and 3,960.28, one dollar and twenty cents apart, with a third test near 3,963 in late June. Price has drifted up to just above 4,020 through the session, so this is a limit order back into the base rather than a chase.
The tell is momentum. On the first test of the base RSI read 30.43. On the second test, at effectively the identical price, it read 36.02. Sel
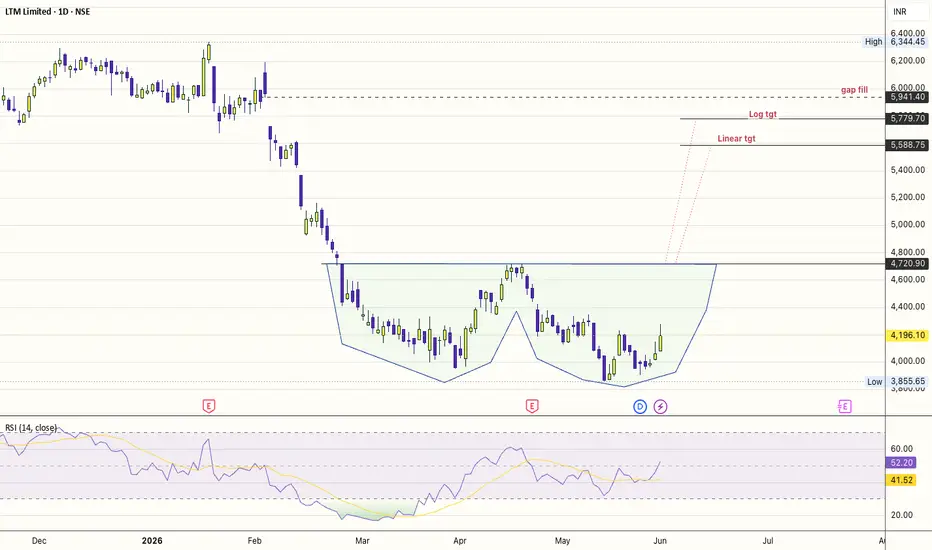
$LTM: Classic complex Double Bottom...with a defined neckline at 4,720 INR.
The Fundamental "Why": The Next Growth Leg
LTM isn't just a legacy IT provider; it is the structural beneficiary of the "Second Wave" of the AI transition.
ERP to AI Integration: LTM specialiaes in the complex plumbing of enterprise data.
As companies move past "chatbots" and into autonomous AI agents, LTM's role in migrating legacy ERP systems to AI-ready cloud environments becomes a non-discretionary expense.
Operating Leverage: After the merger of
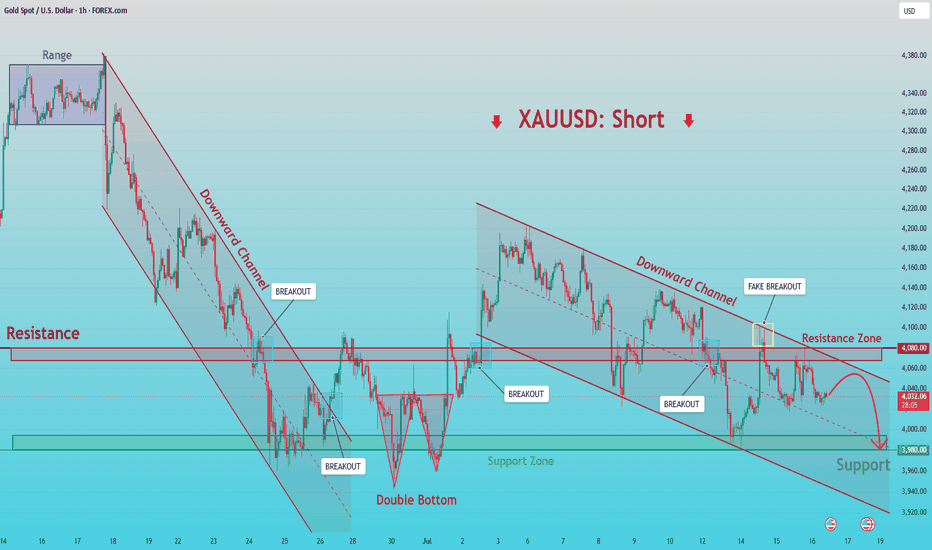
XAUUSD: Faces Resistance Again — Bears Target 3,980$ SupportHello everyone, here is my breakdown of the current XAUUSD setup.
Market Analysis
XAUUSD previously traded inside a range before breaking lower and developing a broad descending channel, confirming a bearish market structure. After finding support near the 3,980 Support Zone, buyers formed a Double Bottom pattern and pushed price back toward the 4,080 Resistance Zone.
Currently, XAUUSD is trading above the 3,980 Support Zone while remaining below the 4,080 Resistance Zone. A recent fake brea
Double Bottom: Short-Term Bounce or the Start of a New Trend?Chart patterns are among the most recognizable tools in technical analysis, and few are as widely followed as the double bottom. The pattern often signals that selling pressure may be fading after a prolonged decline, with buyers beginning to challenge the prevailing trend. Once price breaks above the pattern's neckline, many traders immediately focus on the traditional measured-move target, expecting the market to travel the projected distance before momentum fades.
However, an important quest
$BTCUSDT Double BottomBTCUSDT is displayed on the 1D timeframe and the chart highlights a double bottom structure, with two major swing lows marked as Bottom 1 and Bottom 2. This pattern is commonly monitored as a potential bullish reversal if price confirms a breakout above resistance.
The current price is trading around 64,180 USDT, while the chart shows a major resistance zone near 82,500 USDT. The recent recovery from the second bottom suggests buyers are attempting to push price back toward this key level.
Key
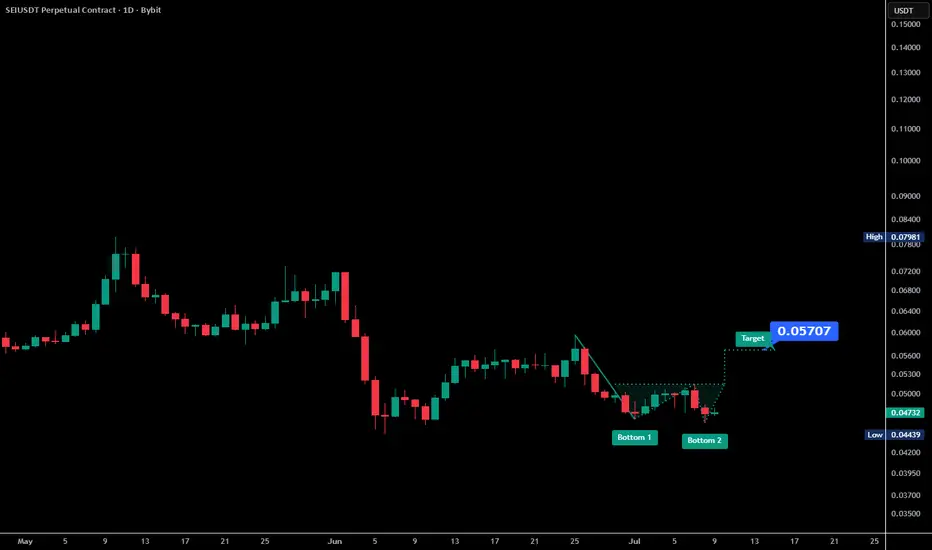
$SEIUSDT Double Bottom RecoverySEIUSDT Perpetual Contract (1D) is showing a potential double bottom formation after an extended downtrend. Two lows have formed around the same support area, suggesting that selling pressure may be weakening if buyers continue to defend this zone.
The current price is trading near 0.0474 USDT, with the primary support located around 0.0440–0.0450 USDT, where both bottoms have developed. This area is important because a loss of support would invalidate the current bullish structure.
The neares
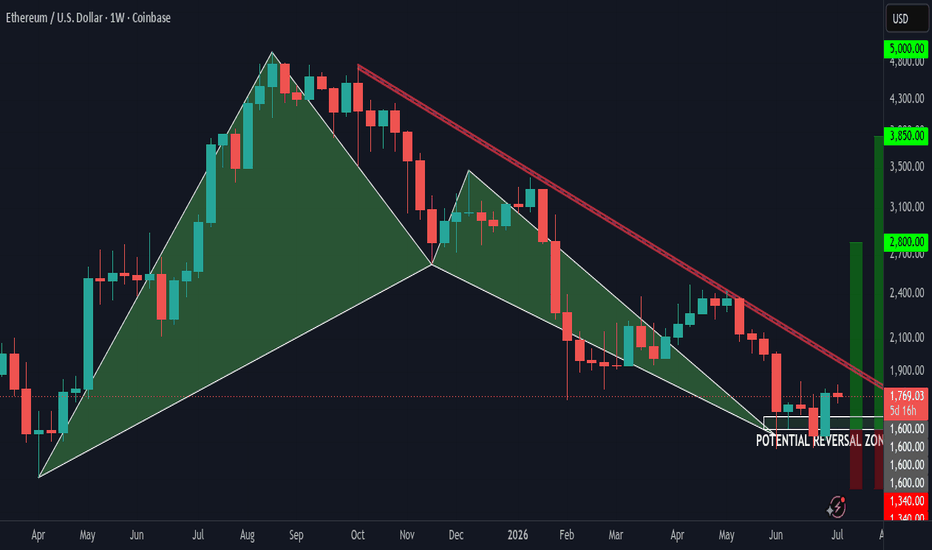
Ethereum's Bullish Bat Pattern Near CompletionEthereum's daily chart is forming a Bullish Bat Harmonic Pattern, with price now trading inside a key Potential Reversal Zone (PRZ). This area represents the completion of the pattern and coincides with a strong historical support level, making it a critical zone to watch for a bullish reversal.
A confirmed breakout from the descending trendline could shift momentum in favor of buyers, opening the door to upside targets at $2,800, $3,850, $5,000, and potentially $7,200 if the pattern fully play
$LINKUSDT Double BottomThe chart shows LINKUSDT Perpetual Contract on the 1D timeframe with a developing double bottom pattern after a prolonged downtrend. Two comparable lows are marked as Bottom 1 and Bottom 2, indicating a potential reversal structure if price continues to hold above the recent support area.
The current price is trading around 7.94 USDT, with the two major support areas visible near 6.99 USDT (marked low) and the second bottom around the same zone. Holding above this support keeps the pattern vali
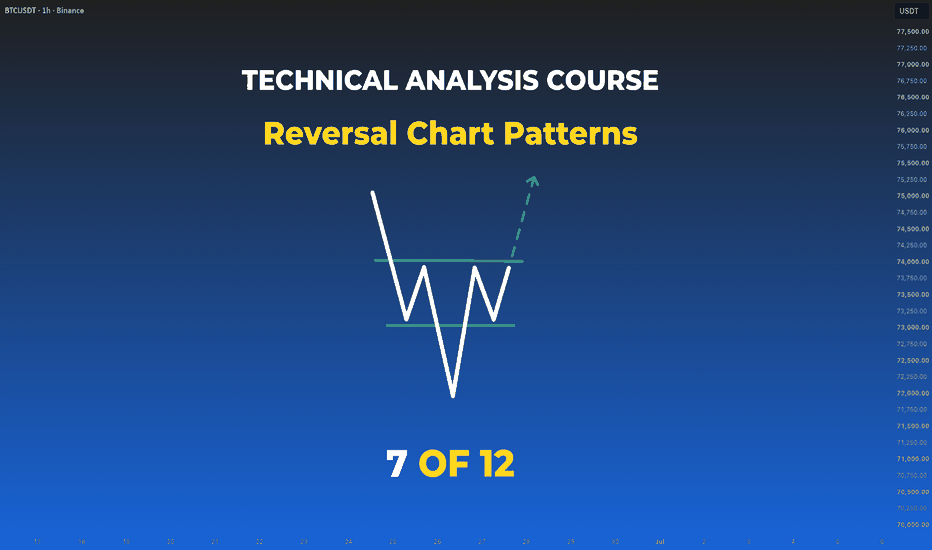
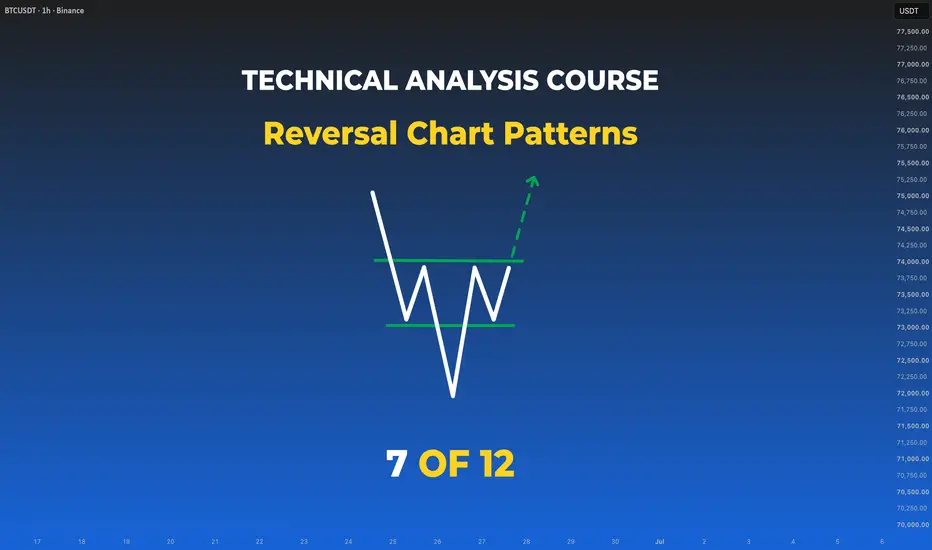
Trading Roadmap | Classical TA·Lesson 07—Reversal Chart PatternsLesson 7 - Reversal Chart Patterns: How Trends End
Difficulty: (Beginner–Intermediate)
Many major trend reversals leave recognizable structures on the chart — shapes that professionals have been reading for a century. Head & Shoulders, Double Tops, Triple Tops, and Rounding patterns are the classical reversal formations. Learn to recognize them early, and you can prepare for possible trend changes with more structure.
🔵 RECAP — WHERE WE LEFT OFF
In Lesson 6, you learned multi-c
ETH/USD: Bullish RSI Divergence + Potential Double BottomETH is showing a bullish RSI divergence on the daily timeframe, suggesting that bearish momentum is weakening. At the same time, price is forming a potential double-bottom.
Note: This setup is based on technical analysis and requires breakout confirmation before considering a bullish continuation.
#Ethereum #ETH #Crypto #TechnicalAnalysis #RSI #BullishDivergence #DoubleBottom #TradingView
Ethereum breaks $1,670 and 20 MA on a potential double bottomCRYPTOCAP:ETH just reclaimed $1,670 and the 20-day - double bottom setting up?
First low printed at 1,510 in mid-June, second at 1,505 late June. That second low briefly took out the first and immediately snapped back - that's a textbook bear trap.
The neckline sits at 1,848, and this level is stacked: it's the swing high between the two lows, it's the old February–March support that's now flipped to resistance, and the 50-day MA is parked right there at 1,836. Triple confluence. This is THE le
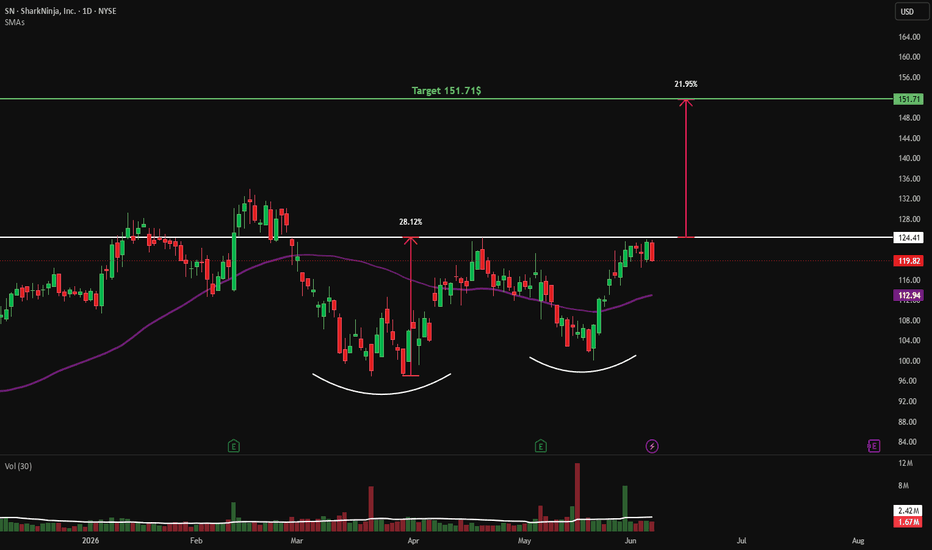
$SN - Double Bottom and 50 SMA Breakout Watch💡 Swing setup idea
Bullish breakout
🔎 Analysis summary:
The stock broke above the 50 SMA, officially closing a double bottom pattern. Watch for a potential breakout continuation from these levels.
🔔 Friendly reminder: The S&P 500 is currently trending down, so please keep the broader market weakness in mind before entering any new trades.
👀 Levels to watch:
Entry trigger: Break above $124.41
Target: $151.71
Stop: Under the breakout level
💬 What do you think of this setup? Let me kno
USDT Dominance Double Top | USDT.DUSDT Dominance (USDT.D) on the 1D timeframe is testing a major resistance zone around 9.3%–9.5%, where price has formed a visible Double Top structure.
The chart shows two swing highs (Top 1 and Top 2) developing within the same resistance area. This pattern is commonly monitored as a potential reversal formation if price breaks below the neckline.
Current price is trading near 9.07%, just beneath the highlighted resistance zone. A sustained rejection from this area could keep the double-top s