LIGHTER - Trading Setup Case Study and Price TargetsHey, everybody. This is Brett. We're going to do a case study here on Lighter.
Lighter has had quite a run here, coming back since May, down here around a dollar all the way up to $3 there. So if we put the date and price range up, it's about 275% up, which is pretty good.
A couple of things here we're going to kind of unpack at the same time.
Originally, we were watching this and watching a bull flag pattern, and so the bull flag is where you have a flag pole, is the terminology, and then
Fibonacci Confluence
SPCX: Bearish Sequence Unfolding Toward Downside Target CFollowing the completion of the prior bullish sequence into the overhead target zone near 150.00, NASDAQ:SPCX has shifted market structure to begin a corrective phase. Price action has formed a clear bearish sequence from the highs, defining an initial impulse into Point A followed by a corrective bounce to Point B.
The aggressive breakdown from the upper consolidation confirms active continuation toward the bearish Point C target. This projected target box sits between 125.50 and 129.00, rep
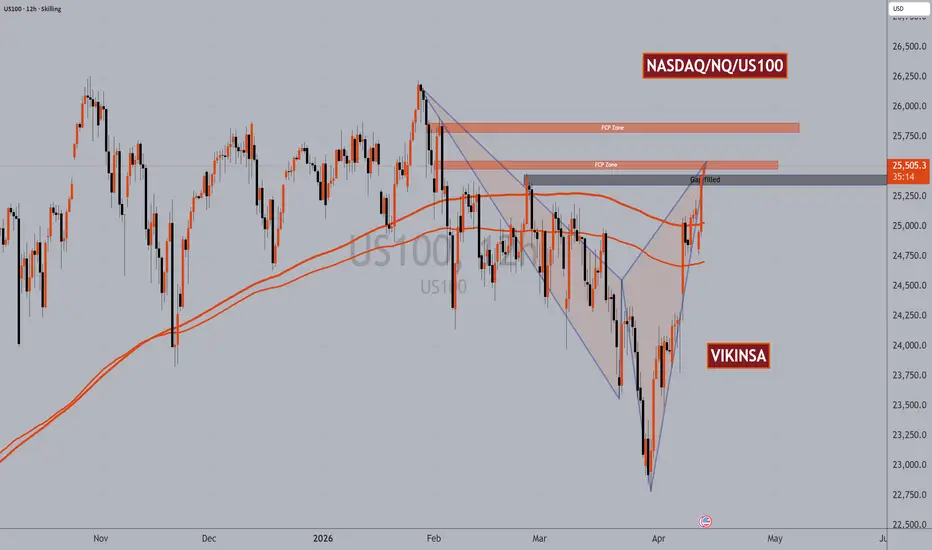
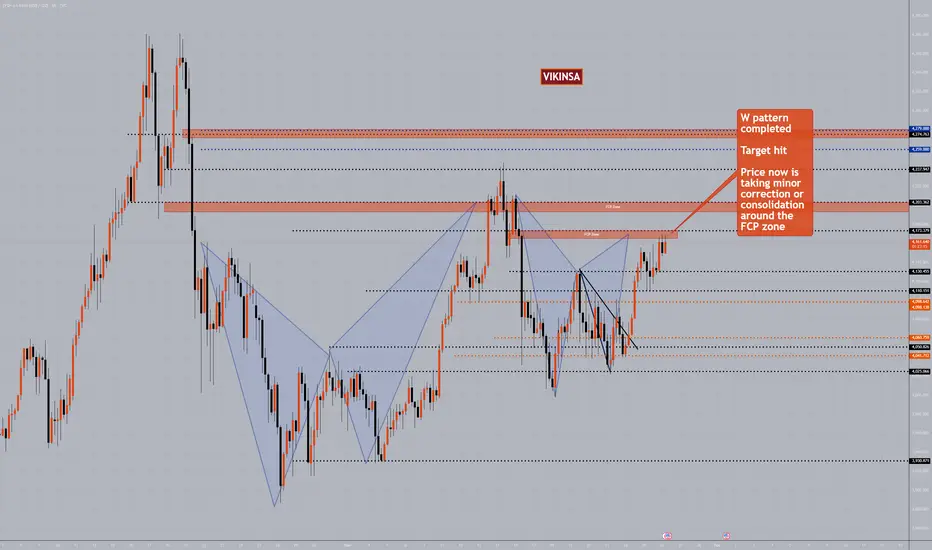
NQ NASDAQ Has Completed A W Pattern We have been bullish in NASDAQ as you know.
NQ (NASDAQ/US100/USTECH) now has filled the daily time frame gap and has completed a W pattern. it is still bullish so for any short opportunities, we need confirmation. We have 2 FCP zone which we need to watch out for.
No an advice as usual!
Be careful of the geopolitical situation though and manage the risk.
Follow for more. Please support this analysis by liking, commenting, and sharing with friends, colleagues, traders, and trading communitie
OIL Can make a bullish move againCrude OIL (WTI) can make a bullish move if can break through some of the resistance areas shown on the chart. As it has a huge up and then down move it may very well consolidate for sometime and then make it move. If it start to move upwards, it can form a W pattern and close the left over gap.
No an advice as usual!
Be careful of the geopolitical situation though and manage the risk.
Follow for more. Please support this analysis by liking, commenting, and sharing with friends, colleagues,
USDCAD Must be watched closely for Great Long OpportunityUSDCAD does not get its fair share of recognition.
It is one of the most underrated currency pairs but from my experience, when it works, it works beautifully especially with patterns. An a lot of analyst do not realise that it is a great indicator for the OIL prices.
At the moment on the weekly time frame, I see that it trying to breakout. If this is successful and confirmed, we can see completing a smaller W and even a bigger W pattern. This will means that USD will gain strength even from
US30 Dow Jones Is At An Important LevelStock Market this weeks opened with larges gaps and over all looking like ready for a correction. However, Dow Jones on daily time frame (as per my data feed) is sitting at 200 sma along with a few fibs. This can be the only chance for the market make a bounce from here. If this levels is broken with strength or broken and confirmed, we will see further larger correction.
Already posted about SNP500
Be careful of the geopolitical situation though and manage the risk.
Follow for more. Pleas
SNP500 Stock Market In Trouble?SNP500 seems to be showing signs of little troubles. It has formed a rounding top and this week it has opened with a major gap. Whilst gaps are not uncommon, this is still looking very bearish.
DAX (Germany 30), NASDAQ and all other major indices seem to have followed a similar pattern this week open.
Seems like market is about to take a correction.
Be careful of the geopolitical situation though and manage the risk.
Follow for more. Please support this analysis by liking, commenting, and
GOLD XAUUSD $GC Important Levels and Zones - UpdatedHell all,
Here are the updated levels and zones for the coming days and possibly weeks. read one level/zone at a time with price action.
Be careful of the geopolitical situation though and manage the risk.
Follow for more. Please support this analysis by liking, commenting, and sharing with friends, colleagues, traders, and trading communities. Thanks👍🙂
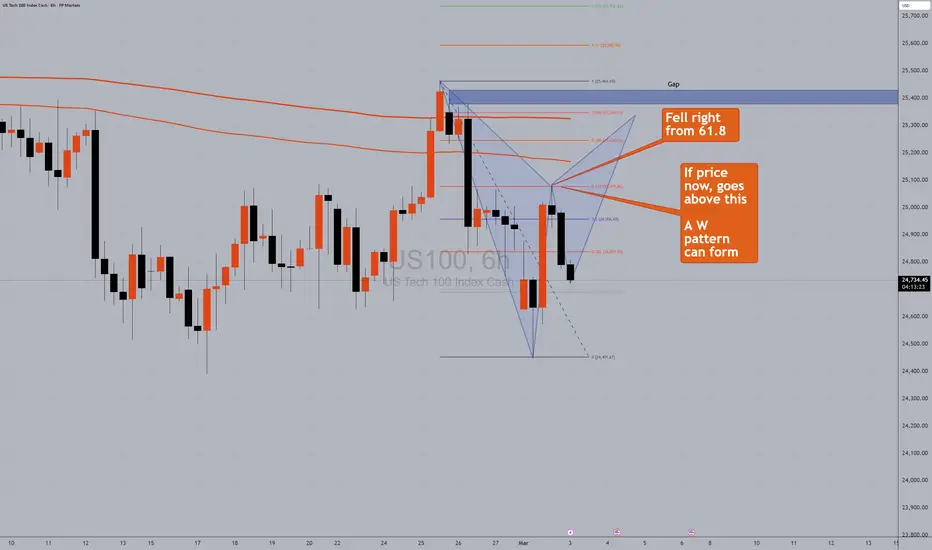
US100 NQ USTECH NASDAQ Can form a W PatternYesterday, price went higher reached 6.18 fib level. It fell exactly from there. Now if the price comes back up and challenges that point again, it can form an W pattern. We also have a gap open which may get filled.
Ba careful of the geopolitical situation though and manage the risk.
Follow for more. Please support this analysis by liking, commenting, and sharing with friends, colleagues, traders, and trading communities. Thanks👍🙂
Silver XAGUSD Has completed a W patternAlthough Silver XAGUSD has more room to rise further, it is at the moment completing a W pattern. This can push the price down a bit at least in a short term.
Ba careful of the geopolitical situation though and manage the risk.
Follow for more. Please support this analysis by liking, commenting, and sharing with friends, colleagues, traders, and trading communities. Thanks👍🙂
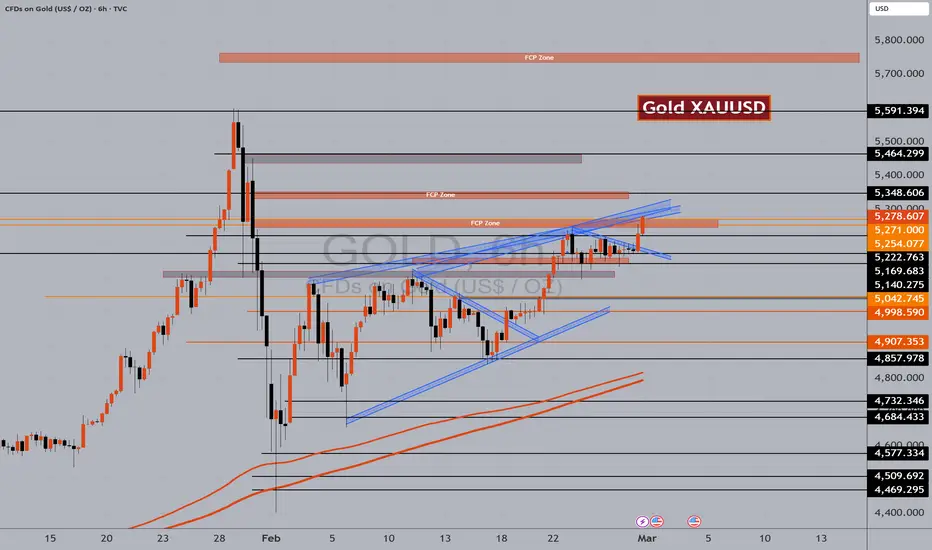
GOLD $GC XAUUSD Important Levels and ZonesGold has ended the month of Feb 2026 on a bullish note. In the last 2 days, it broker out and reached the next higher level which was there in our analysis. Right now it is still sitting at a trend line resistance level along with FCP zone. Lets wait and watch how the market opens in the month of March.
Here are some important levels and zones which we need to monitor.
Follow for more. Please support this analysis by liking, commenting, and sharing with friends, colleagues, traders, and tradi
GOLD XAUUSD Important Levels and ZonesGold XAUUSD has been bullish in the past couple of years but after hitting an all time high around 5600, it had a massive correction. Since then it has been consolidating and last week it tried to resume the bullish trend.
So far it has recovered 50 percent of the lost ground and is now sitting a major resistance level. This means only 3 scenarios:
1. Bullish all the way to complete a W pattern (levels and zones are there on the chart)
2. Bullish for smaller extended W pattern and then revert
NASDAQ NQ A Breakout Can Come, Wait For The ConfirmationAs I posted earlier, all of our FCP levels and zones have been working great and have given us tremendous opportunities. Now NQ is back at the upper zone and the momentum is looking great. If this breakouts we can test previous high and possibly go to all time highs.
I have updated a few new levels on the chart.
Trade what you see, wait for the confirmations and manage the risk as always.
Follow for more. Please support this analysis by liking, commenting, and sharing with friends, colleague
USDCAD Possible W Pattern and other scenariosUSDCAD has been very bullish in recent times.
However it is now forming and nearly has completed a W pattern. Tuis can create a correction.
If the price stay bullish and the previous high become support then it can rise much higher the the anticipated level.
Trade what you see.
Please support this analysis by liking, commenting, and sharing with friends, colleagues, traders, and trading communities. Follow me for more of these. Thanks👍🙂
GBPUSD Swing Reversal Trade Possible ZonesGBPUSD has reached an FCP zone which can act as resistance. A W pattern has alco completed there.
If this one does not gold, then we have a level and another FCP zone above which should make the market go in to a correction at least for a little while.
Trade what you see, manage the risk.
ZEC — Another -50% Drop AheadZEC has had one of the wildest runs this year, a +2000% explosion from August to November, all in just 80 days, before topping out at $750. Moves that go vertical like this tend to unwind just as aggressively, and ZEC did exactly that: a sharp –60% correction back into the $300 support zone.
That reaction wasn’t random, $300 was a major confluence level:
0.618 Fib retracement of the entire +2000% move
Weekly level lining up cleanly
0.786 Fib of the smaller impulsive wave
Altogether, an i
GOLD $GC XAUUSD Target Hit - UpdateTraders and Investors,
W pattern completed as expected and posted about a few days ago. This has given us a great long swing opportunity and then several long and short opportunities on smaller time frames. We have been trading around the levels and zones taking one of them at a time. Whereas one swing long position has been running for this W pattern completion target.
When W pattern completes the market take a correction, this is why today price fell a bit from the FCP zone as expected. It
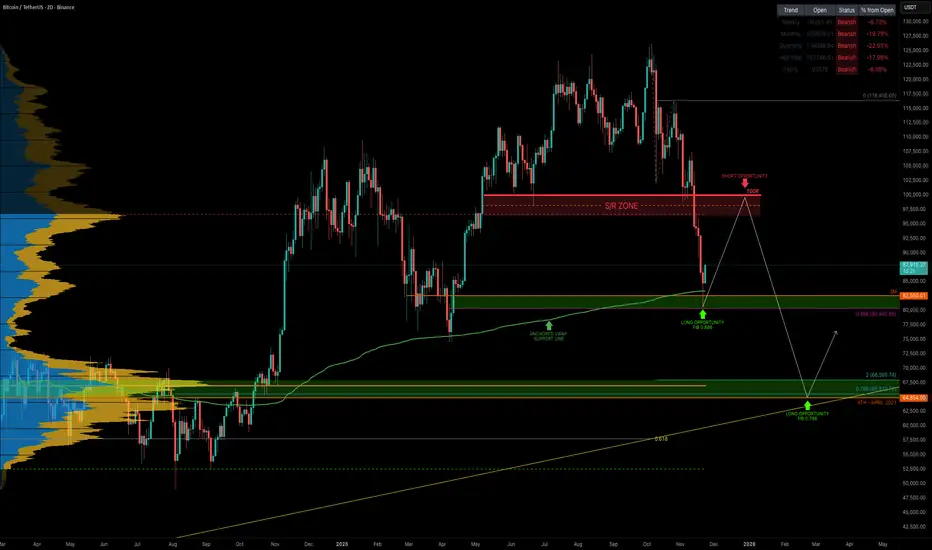
BTC Euphoria to Fear: Is This the Start of the Bitcoin Winter?Is the Bitcoin bear market here? A deep dive Into cycles, tech risks & what comes next.
Bitcoin has now dropped –36% from its all-time high in just 46 days, and naturally the big questions emerge:
Has the bear market officially begun?
How long could it last?
And what catalysts could accelerate it?
Let’s break this down from cycle structure to macro-technological risks.
BTC Has Turned Bearish Across All Major Timeframes
Bitcoin is now trading below the yearly open at $93,576, flipping all m
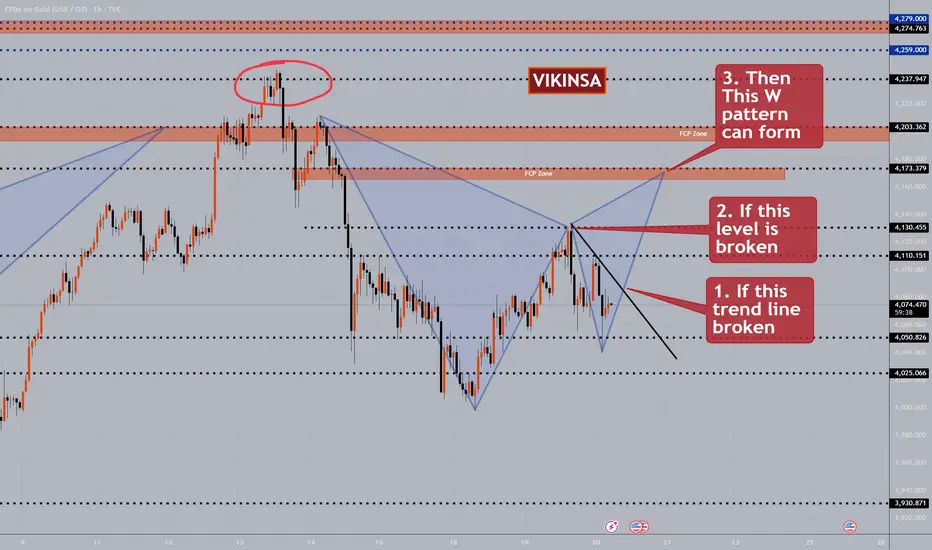
GOLD $GC Levels and Patterns AnalysisTraders and Investors,
Gold (XAUUSD) has been consolidating mostly but still has been giving a lot of great short term and swing trade opportunities.
I have updated the important levels and zones which can act as support and resistance. They should guide us a bit for the best possible trade opportunities.
There as possible W pattern forming. It has not formed or completed yet. It must first break the trend line and confirm the break. BTW, that trend line can also give us a good opportunitie
ZECUSDT - Testing Support For Potential Relief BouncePrice is reacting to a strong demand zone after forming an M-top pattern on the higher timeframe. Watching for a short-term relief move toward the 0.5–0.618 retracement levels (around 470–490) before deciding whether this becomes a full reversal or just a retest.
If the 450 level holds, continuation to 520–540 is possible. If 450 breaks cleanly, I’ll look for a deeper long setup near 399–371.
Stop loss for the short-term long is below 450.
NQ volatility likely to persist until retest of 13k buy zonechart shows it all...expect more volatility this month, likely a retest of 61.8 fib level at 15k & 78.6 fib levels (based on lows from 2023) near 13k before we finally run to the highs again into 2026!
tariffs have similar impact as rate hikes...overall will be digested by markets just fine & we'll head back to the highs as fed sees more freedom to cut given those effects...very incentivized to prevent a "hard landing" economically without also boosting inflation too much, so this is all actual