ETHUSD 1H: Range Breakout & Liquidity Sweep Reclaim (Long Setup)
1. Market Context
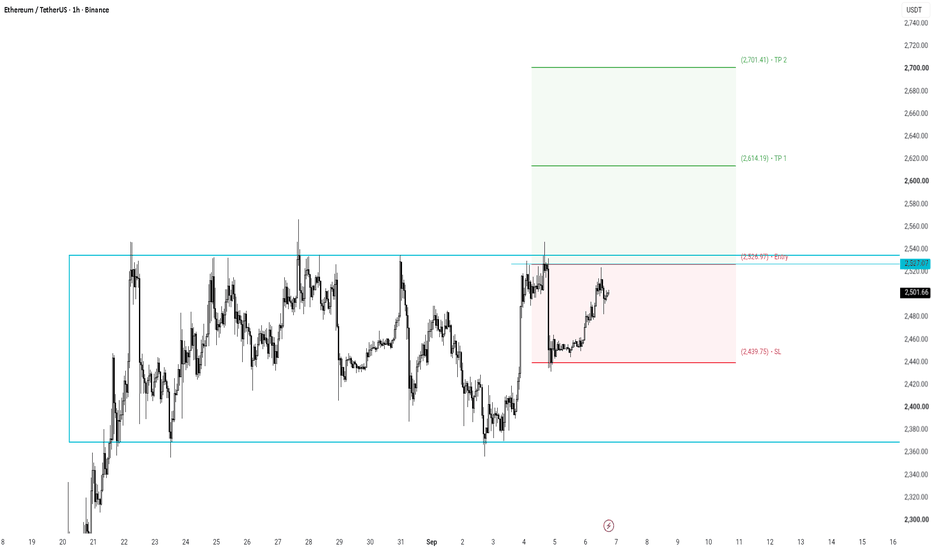
On the 1H chart, ETH/USDT has been consolidating inside a wide horizontal range bounded between 2,370.00 and 2,530.00 for over two weeks. After sweeping liquidity down to the 2,439.75 support floor, price is aggressively pushing back up to test and break out above the range resistance ceiling at 2,526.97.
2. Sentiment & House Trap Analysis
Where Traders Place Orders: Retail traders seeing the upper resistance boundary holding repeatedly around 2,526.97 – 2,540.00 opened SELL positions, expecting ETH to reject again and fall back toward the range mid-level or bottom.
Trader Stop-Loss & Target: Shorters placed their Stop-Loss orders tightly above the range ceiling at 2,540.00 – 2,550.00, while early buyers placed SLs beneath 2,439.75.
How the House Plays It: The House flushed price down to 2,439.75 to liquidate weak long positions and collect sell-side liquidity. Once absorbed, the House engineered a strong V-shaped recovery. A 1H breakout above 2,526.97 will trigger a short-squeeze (forced buy-stop market orders from trapped shorters), fueling an expansion toward 2,614.19 (TP1) and 2,701.41 (TP2).
3. Trade Setup
Entry: 2,526.97 (Confirmed 1H close breaking above horizontal range resistance)
Stop Loss (SL): 2,439.75 (Placed safely below the liquidity sweep swing low)
Take Profit 1 (TP1): 2,614.19
Take Profit 2 (TP2): 2,701.41
Risk-to-Reward Ratio (R:R): Approx 2.0:1 (Calculated toward TP2)
Gann Box
DECODING BTC TOPS & BOTTOMS: THE ANATOMY OF PRICE TRAPS1. Core Philosophy: How Tops & Bottoms Are Formed
The market does not run on textbook technical indicators. The market runs on Liquidity.
Top: Not a safe buying zone, but where the House triggers retail FOMO to DUMP inventory onto late buyers at the highest possible price.
Bottom: Not where the market dies, but where the House creates extreme panic to STEAL cheap bags from panicking sellers.
2. Breaking Down the 4 Trap Phases on the Daily (1D) Chart
Phase 1: Top Buying Trap (Macro High ~124,696 USDT)
Retail Sentiment: Retail sees BTC break $100,000 and surge to $124,696, aggressively buying out of FOMO expecting $150,000 – $200,000+.
House Execution: Once retail buying capacity reaches its peak at the most expensive price, the House quietly unloads inventory. Buying volume dries up, locking in the macro top at $124,696.
Phase 2: Structural Breakdown & The "Kill Zone" (84,000 – 86,000 USDT)
Retail Sentiment: As price drops from the peak, the $84,000 – $86,000 region acts as a major support floor where retail clusters to buy the dip.
House Execution: The House slices right through this floor, flipping support into major resistance. This $84,000 – $86,000 area officially becomes the "Kill Zone"—a trap zone designed to neutralize both sides.
Phase 3: Panic Sell Trap at Macro Bottom (49,024 – 53,880 USDT)
Retail Sentiment: The House slams price through $53,880 down to $49,024 (cyan bottom box). Retail panics, cuts losses, and crowds into short positions (marked "Seller") expecting BTC to crash to $30,000.
House Execution: The House absorbs all maximum panic-sell liquidity at rock-bottom prices. Once no retail trader dares to BUY anymore, the House engineers a rapid V-shaped recovery out of the accumulation zone.
Phase 4: New Expansion into the "Kill Zone" (~77,190 -> 84,000 USDT)
Current Market: BTC breaks out of the red accumulation box, completely wiping out late bottom shorters.
The Next Trap: Price is driving straight toward the critical Kill Zone (84,000 – 86,000 USDT). This is where the House decides: collect remaining short liquidity to push toward $101,004, or reverse to trap late breakout buyers.
3. Street Rules for Traders
Never predict price with emotion. Always ask: Whose money is the House trying to take right now?
Don't BUY when price looks too pretty; don't SELL when price looks too scary.
The highest probability entry: Right after the Liquidity Sweep completely wipes out retail stop-losses.
SOYUSD 4H: Lower-High Rejection & Trendline Breakdown (Short Set1. Market Context
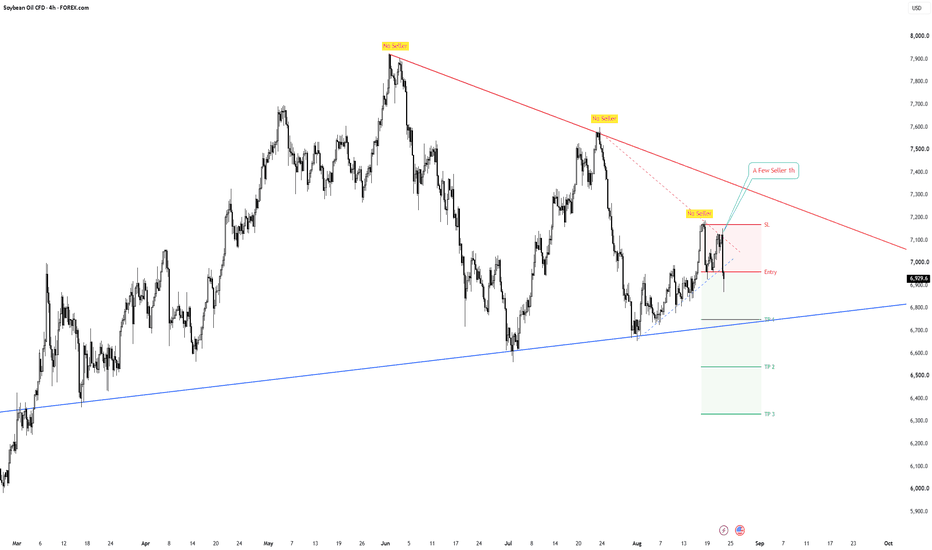
On the 4H chart, Soybean Oil (SOYUSD) is forming a clear series of lower highs marked by "No Seller" along the major red descending trendline. Price rejected the latest lower-high peak near 7,180.0 and has broken below local 1H trendline support ("A Few Seller 1h") around 6,950.0.
2. Sentiment & House Trap Analysis
• Where Traders Place Orders: Seeing the bounce off the lower blue trendline, retail traders opened BUY orders around 6,950.0, expecting a breakout above the red trendline toward 7,400.0+.
• Trader Stop-Loss & Target: These buyers placed their Stop Loss orders immediately below 6,900.0, while short-sellers placed SLs above the 7,180.0 peak.
• How the House Plays It: The House capped price at 7,180.0 ("No Seller") to establish another lower high. As retail crowds into buy orders at support, the House pushes price down to slice through 6,950.0. Trapped buyers cutting losses trigger forced sell-stop orders, fueling a drop toward 6,750.0 (TP1 - retesting the major blue trendline), 6,520.0 (TP2), and 6,350.0 (TP3).
3. Trade Setup
• Entry: 6,950.0 (Confirmed close breaking below 1H dotted trendline / local support)
• Stop Loss (SL): 7,180.0 (Placed safely above the "No Seller" rejection peak)
• Take Profit 1 (TP1): 6,750.0 (Retesting major blue ascending trendline)
• Take Profit 2 (TP2): 6,520.0
• Take Profit 3 (TP3): 6,350.0
• Risk-to-Reward Ratio (R:R): Approx 2.6:1 (Calculated toward TP3)
BTCUSDT 4H: Parabolic Spike into Resistance Zone & Macro Short 1. Market Context & Update
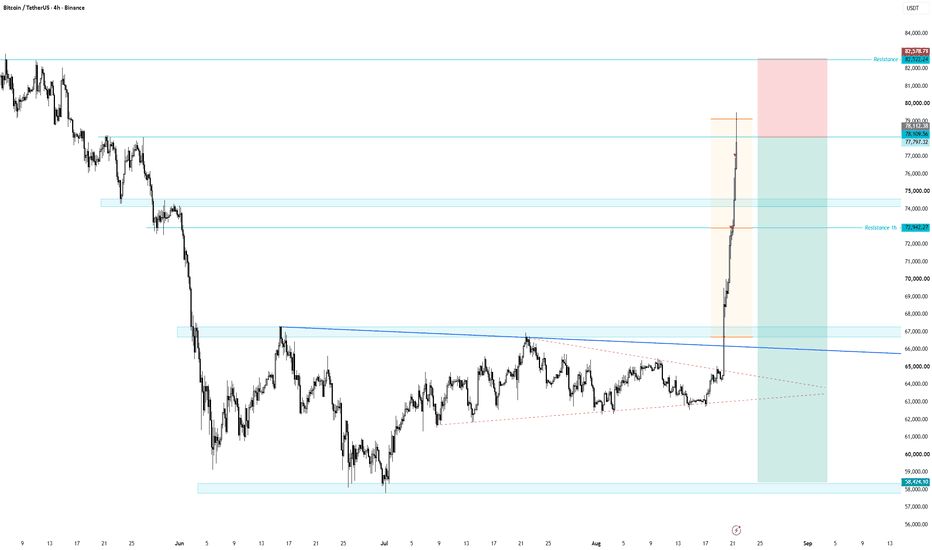
BTC executed an explosive parabolic surge straight out of the 67,000.00 consolidation floor, slicing through 72,942.27 and hitting the top of the orange expansion box at 78,112.38. Price is now pressing up toward the macro resistance ceiling at 82,522.24.
2. Sentiment & House Trap Analysis
• Retail Buyers (FOMO Trap): Late retail traders are blindly opening BUY positions above 78,000.00 expecting an immediate moonshot, placing tight Stop Losses below 73,000.00.
• Retail Sellers (Wiped Out): Short-sellers were heavily liquidated during the vertical short-squeeze from 67,000.00 to 78,000.00.
• House Manipulation: The House engineered a rapid vertical pump to force short liquidations and lure late retail buyers into buying at overbought peaks. As price reaches the macro resistance ceiling (82,522.24), the House will cut buying pressure and dump price. This traps all late FOMO buyers, triggering cascading stop-loss sell orders back toward 72,942.27 and ultimately the macro base at 58,424.10.
3. Trade Setup (Short Plan)
• Entry: 78,112.38 – 79,000.00 (Shorting the overextended exhaustion peak)
• Stop Loss (SL): 82,578.71 (Placed safely above the major Resistance ceiling at 82,522.24)
• Take Profit 1 (TP1): 72,942.27 (Retest of key 1H breakout support)
• Take Profit 2 (TP2): 67,000.00 (Previous orange consolidation box top)
• Take Profit 3 (TP3): 58,424.10 (Sweeping macro bottom support floor)
• Risk-to-Reward Ratio (R:R): Approx 4.4:1 (Calculated toward TP3)
WHEAT 1H: Ascending Trendline Breakdown & Buyer Trap
1. Market Context
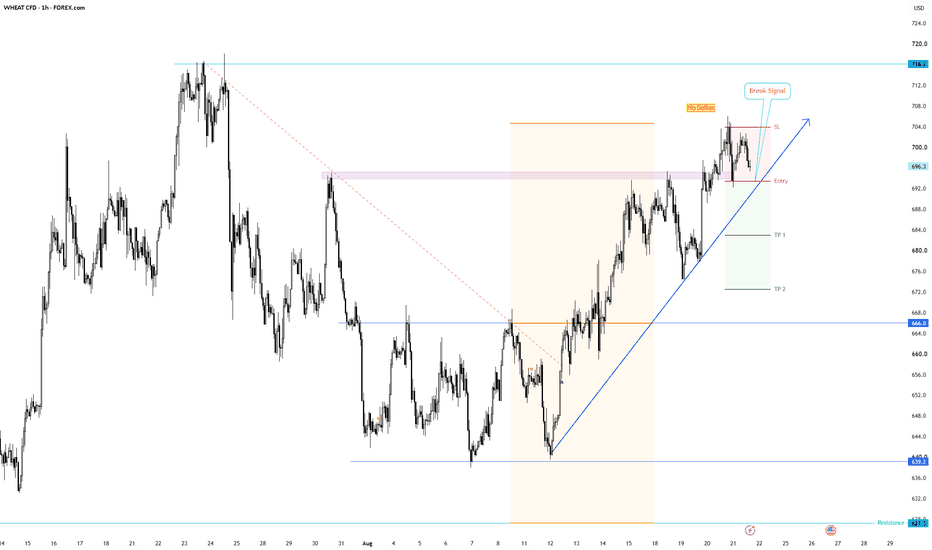
On the 1H chart, Wheat executed an extended rally from 639.2 up toward 705.0 along a blue ascending trendline. Price stalled at the 705.0 peak ("No Seller") and is now pressing down against the key purple support zone at 693.0.
2. Trader Behavior & House Trap Analysis
Where Traders Place Orders: Seeing the strong uptrend along the blue trendline, retail traders are opening BUY orders around 693.0 – 696.0, expecting a continuation bounce up toward 716.2.
Trader Stop-Loss & Target: These buyers have placed their Stop-Loss orders immediately below the purple zone around 690.0 – 692.0, targeting higher highs.
How the House Plays It: The House capped price at 705.0 ("No Seller") to trap late FOMO buyers at the top. As retail crowds into buy orders on the trendline support, the House will push price down to slice through 693.0 ("Break Signal"). The forced sell-stop market orders from trapped buyers cutting losses will fuel a fast decline straight into 682.5 (TP1) and 672.0 (TP2).
3. Trade Setup
Entry: 693.0 (Confirmed 1H close breaking below purple support zone & blue trendline / Break Signal)
Stop Loss (SL): 705.0 (Placed safely above the "No Seller" rejection high)
Take Profit 1 (TP1): 682.5
Take Profit 2 (TP2): 672.0
Risk-to-Reward Ratio (R:R): Approx 1.8:1 (Calculated toward TP2)
SILVER (XAG/USD - 4H Chart) Trade Plan – Liquidity Sweep & Bull
1. Market Structure & Price Trap Analysis
Silver is making a parabolic push toward the major psychological resistance level at 70.00000.
This upward push serves as a classic Bull Trap (Liquidity Sweep) designed to clear out short stop-losses and trap late breakout buyers.
Projected Scenario: Upon tapping 70.00000, buyer exhaustion will trigger a heavy reversal downward along the projected red path.
2. Trade Parameters
Trigger: 4H rejection wick at 70.00000 or a solid 4H candle close below 68.00000.
Entry Zone:
Aggressive: Sell Limit / Sell Stop around 69.80000 - 70.00000.
Conservative: Wait for a 4H breakdown below 68.00000 → Sell Retest at 68.20000 - 68.50000.
Stop Loss (SL): 71.20000 (Placed safely above the upper cyan resistance zone 71.00000 - 72.00000).
Take Profit (TP):
TP 1: 66.50000 (Intermediate local support zone).
TP 2: 62.70000 (Key cyan horizontal support line).
TP 3: 60.00000 (Major psychological round-number target).
3. Risk Management & Execution Rules
Do NOT Short Early: Current price (~68.87) is mid-range. Wait patiently for the liquidity sweep at 70.00000 or structural confirmation below 68.00000.
Risk-to-Reward ratio ranges from 1:2.5 to 1:4.5. Move SL to Breakeven once TP1 is hit.
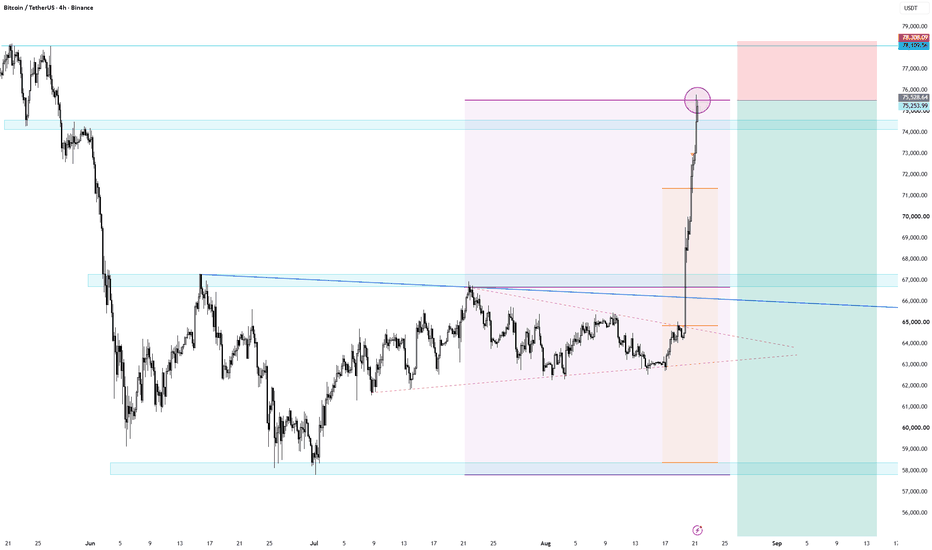
BTC/USDT (4H Chart) Trade Plan – Big Short Setup to 50,000
1. Price Trap & Liquidity Sweep Analysis
The parabolic impulse move from 64,000 straight into 75,500 is a textbook Buy Climax / Liquidity Grab. It was engineered to trigger short stop-losses and trap FOMO breakout buyers at the swing high.
Price has tapped directly into the major resistance zone (74,000 - 75,500 cyan box) and is showing immediate rejection wicks on the 4H timeframe.
2. Big Short Trade Parameters
Trigger: 4H reversal rejection wick at resistance or a solid 4H candle close below the local support at 72,800.
Entry Zone:
Aggressive: Short around 75,000 - 75,500 upon 4H rejection confirmation.
Conservative: Wait for a 4H close below 72,800 → Sell Retest around 73,200 - 73,500.
Stop Loss (SL): 78,310 (Placed safely above the liquidity sweep wick high).
Take Profit (TP):
TP 1: 67,000 (Previous breakout resistance turned key support).
TP 2: 58,000 - 58,500 (Major base support of the July-August consolidation).
TP 3 (Macro Target): 50,000 (Major psychological round-number demand zone).
3. Risk Management & Execution Rules
Counter-Trend Warning: Shorting against a strong parabolic impulse requires strict position sizing (maximum 1-2% account risk).
Position Management: Once price hits TP 1 (67,000), take 50% partial profits immediately and move SL to Breakeven (Entry) to risk-free hold the Big Short toward 50,000.
EUR/USD (H1 Chart) Trade Plan – Bull Trap Setup
1. Price Trap Mechanics
The recent surge above the 1.17100 - 1.17200 resistance zone was a classic Bull Trap (Liquidity Sweep). It was engineered to trigger early Sellers' stop losses while trapping late Breakout Buyers at the high.
The subsequent "No Seller" signal confirms Buyer exhaustion. Price is now printing a lower high structure, setting up for a sharp reversal toward the lower channel supports.
2. Trade Parameters
Trigger: H1 candle close strictly below 1.16731 (Break Signal).
Entry Zone: Sell at 1.16731 (or Sell Retest around 1.16750 - 1.16800 after the breakout).
Stop Loss (SL): 1.17080 (Placed safely above the recent trap high).
Take Profit (TP):
TP 1: 1.16400 (Upper channel trendline support).
TP 2: 1.16000 (Key psychological round number & dotted trendline).
TP 3: 1.15700 (Main lower channel boundary).
3. Risk Management & Execution Rules
Do NOT Front-Run: Current price (~1.16920) is mid-range. Wait strictly for the H1 close below 1.16731 to avoid secondary fakeouts.
Excellent Risk-to-Reward ratio (1:2.5 up to 1:4). Move SL to Breakeven once TP1 is hit.
WTICOUSD 1H: Trade Review & Dual-Scenario Game Plan
1. Previous Trade Review (Aug 10 - Aug 20)
Position: Long @ 79.058 | SL: 74.905
Status: TP1 hit at 83.500, currently approaching TP2 at 88.500 (Price @ ~87.363).
Execution: Move SL to Breakeven (79.058) or lock in 70% profits around 87.500 - 88.500. Let the remaining 30% runner play out based on the two scenarios below.
2. Sentiment & House Trap Analysis
The Retail Shorters: Crowding into short positions at the 88.500 - 89.158 resistance ceiling expecting an overbought pullback, placing SLs right above 89.200.
The Retail Buyers: Buying at the 85.000 floor along the blue ascending trendline, placing SLs beneath 85.000.
House Trap Scenarios:
Bullish Breakout (Green Path): The House drives price past 88.500 - 89.158 to trigger a massive short-squeeze. Forced stop-loss buy orders become fuel to propel Oil straight toward the upper GAP / TP3 at 93.000.
Bearish Breakdown (Red Path): The House intentionally dumps price below the 85.000 box floor and trendline, wiping out buyer stop-losses and triggering panic selling back down toward the original 79.000 entry floor.
3. Neutral 2-Way Execution Plan
Scenario 1: Bullish Breakout Long (Green Arrow - Trend Continuation)
Entry: 88.500 - 89.158 (Confirmed 1H close above consolidation box & resistance)
Stop Loss (SL): 85.000 (Below consolidation box support)
Take Profit (TP): 93.000 (Targeting upper GAP fill / TP3)
Risk-to-Reward (R:R): ~1.1:1 (Holding runner from 79.058 to 93.000 yields R:R > 3.4:1)
Scenario 2: Bearish Breakdown Short (Red Arrow - Short-Term Reversal)
Entry: 85.000 (Confirmed 1H close breaking below box support & blue trendline)
Stop Loss (SL): 88.500 (Above consolidation box ceiling)
Take Profit (TP): 79.000 (Targeting retest of original Entry support)
Risk-to-Reward (R:R): ~1.7:1
CORN 1H: Deep Liquidity Sweep & Support Reclaim (Long Setup)1. Market Context
On the 1H chart, Corn crashed through the ascending trendline after triggering multiple "Buyer Lose" liquidations. Price is currently dropping sharply toward the major bottom support floor between 439.86 and 427.37. We wait for the deep sweep into this support zone before entering long.
2. Casino / House Trap Analysis
• The Panic Sell Trap: The House broke the trendline to flush out early buyers ("Buyer Lose") and trick retail traders into opening late short positions at low prices.
• The House Buy Zone (435.39 - 427.37): The House is letting price plunge toward 435.39 - 427.37 to trap late shorters at the bottom and collect cheap inventory.
• Reversal & Squeeze: Once the sweep is finished, the House will aggressively reverse price back up toward 465.31 ("Kill Zone"). Forced stop-loss buying from trapped shorters will act as fuel for the rally.
3. Trade Setup (Conditional Long)
• Entry Zone: 427.37 - 435.39 (Buying the deep sweep into major support)
• Stop Loss (SL): 423.13 (Placed safely below the support floor)
• Take Profit 1 (TP1): 439.86
• Take Profit 2 (TP2): 458.60
• Take Profit 3 (TP3): 465.31 (Targeting the overhead "Kill Zone")
• Risk-to-Reward Ratio (R:R): Approx 3:1 (Calculated toward TP3)
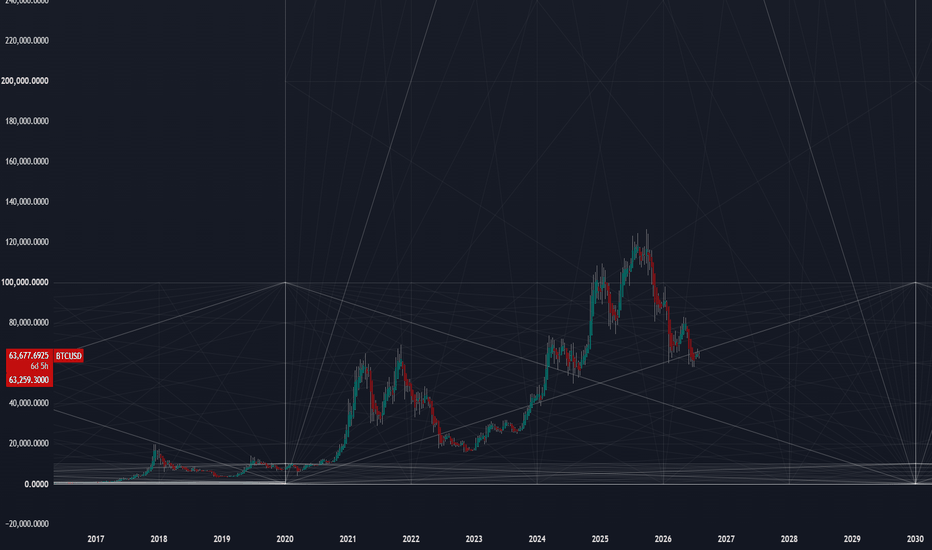
Decade 5thsUsing the Gann Box with 5ths ratios over a decade of time (currently 2020-2030) and plotting a simple price range that can "grow or shrink" as price moves over time.
I typically have the current range, one larger box and one smaller range box for each cycle (decade). You can see between 2010-2020 we were at lower prices, so I was using a range of 0-1,000 and also had 0-10,000 and 0-100,000.
The current time cycle (2020-2030) has earned the price overlay of 0-1,000,000 and still keeping the smaller price ranges, 0-100k and 0-10k until they're not needed or price comes back to them.
EURUSD 1H: Reclaiming Resistance & Trendline Seller Trap1. Market Context
On the 1H chart, EURUSD is showing a strong bullish structure. After executing a major deviation below the lower boundary of the parallel channel (marked "Fake Break Parallel Channel"), the price saw massive institutional absorption. Subsequent dips to local supports were immediately bought up, marked by successive "No Buyer" exhaustion signals. The market is now aggressively pressing against the key horizontal resistance zone at 1.14512 - 1.14583, preparing for a decisive breakout.
2. Sentiment & Price Trap Analysis
• The Fake Break & Retail Shakeout: The initial drop below the parallel channel support successfully trapped breakout retail sellers and washed out weak buyers. The rapid recovery back into the channel confirmed strong institutional demand.
• The Resistance Seller Trap: Retail shorters are aggressively defending the horizontal resistance zone between 1.14512 and 1.14583 (marked "Seller"), expecting the range top to hold. Their stop losses (buy stops) are concentrated heavily just above 1.14583, representing a massive pool of buy liquidity.
• The Squeeze Catalyst (Break Signal): A decisive 1H candle close above 1.14583 (marked "Break Signal") will trigger the accumulated buy stops of the trapped shorters. This forced liquidation will act as direct rocket fuel, driving the price rapidly upward toward the next expansion targets at 1.15000 (Level 2) and 1.15383 (Level 3).
3. Trade Setup
We target a high-probability long entry on a confirmed breakout of the key resistance zone to exploit the trapped sellers' liquidation momentum.
• Entry: 1.14583 (Buying the confirmed breakout close / Break Signal)
• Stop Loss (SL): 1.14154 (Placed safely below the recent "No Buyer" consolidation low)
• Take Profit (TP): 1.15383 (Targeting Level 3 near the upper parallel channel boundary)
• Risk-to-Reward Ratio (R:R): Approx 1.86:1
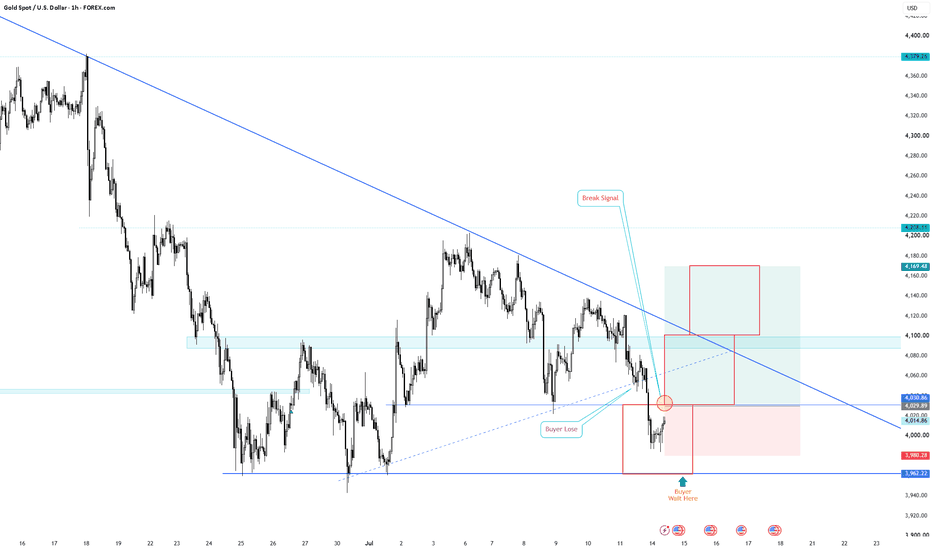
XAUUSD 1H: Reclaiming the Base & Short Squeeze (Long Setup)1. Market Context
On the 1H chart, Gold recently executed a rapid downswing to flush out retail buyers. After sweeping below the local support level, the price found strong institutional buying interest at the major support zone. It is now starting a V-shape recovery back above the key level of 4,029.89. A successful reclaim of this base confirms a bullish shift, opening the way for a rally toward the descending trendline resistance near 4,169.48.
2. Sentiment & Price Trap Analysis
• The Retail Buyer Shakeout (Buyer Lose): The sharp drop below the local ascending support successfully triggered the stop losses of weak retail buyers, forcing them out of their long positions at the worst possible prices.
• The Institutional Defense (Buyer Wait Here): Instead of continuing down, the selling pressure was completely absorbed by large market makers around the 3,980.28 - 4,000.00 demand zone. This area is heavily defended by smart money buyers who are ready to build their long positions.
• The Short Squeeze (Break Signal): As the price recovers aggressively above 4,029.89, early breakout short-sellers are getting trapped. The trigger of their stop losses (buy stops) combined with new institutional buying momentum will act as fuel to drive Gold rapidly higher toward the upper target.
3. Trade Setup
We target a high-probability long entry to ride the recovery momentum of the trapped sellers' stop hunt.
• Entry: 4,029.89 (Buying the confirmed reclaim / Break Signal)
• Stop Loss (SL): 3,980.28 (Placed safely below the manipulation spike low)
• Take Profit (TP): 4,169.48 (Targeting the upper consolidation resistance and trendline test zone)
• Risk-to-Reward Ratio (R:R): Approx 2.8:1
Daily Outlook || 13th July || CPI EveMarkets are sitting on a knife's edge heading into tomorrow's CPI print. Liquidity has been building on both sides of the market across forex, indices, gold, and Bitcoin — a setup that typically precedes a sharp directional resolution. Today's session is about mapping where that liquidity sits, not predicting which way it breaks.
In this video, we break down EURUSD, GBPUSD, XAUUSD (Gold), S&P 500, Nasdaq 100, and Bitcoin through the lens of:
Market Structure
Liquidity Mapping
Institutional Order Flow
ICT Concepts & Smart Money Concepts
Premium & Discount Zones
Fair Value Gaps
Order Blocks
Daily Bias Framework
With CPI on the calendar, this is a two-sided market — and knowing where the resting liquidity is matters more than guessing the headline number.
Why you should watch:
✔ Key liquidity pools above and below current price
✔ Areas where institutions are likely to react
✔ Risk management going into a high-impact news event
✔ Bullish and bearish scenarios mapped for both outcomes
✔ Confirmation levels to validate direction post-CPI
This analysis is for educational purposes only and does not constitute financial advice. Always manage risk and trade your own plan.
CPI tomorrow means big moves are coming — but which side gets swept first? Drop your bias below: are you leaning long or short into the print? Let's compare notes before the data hits.
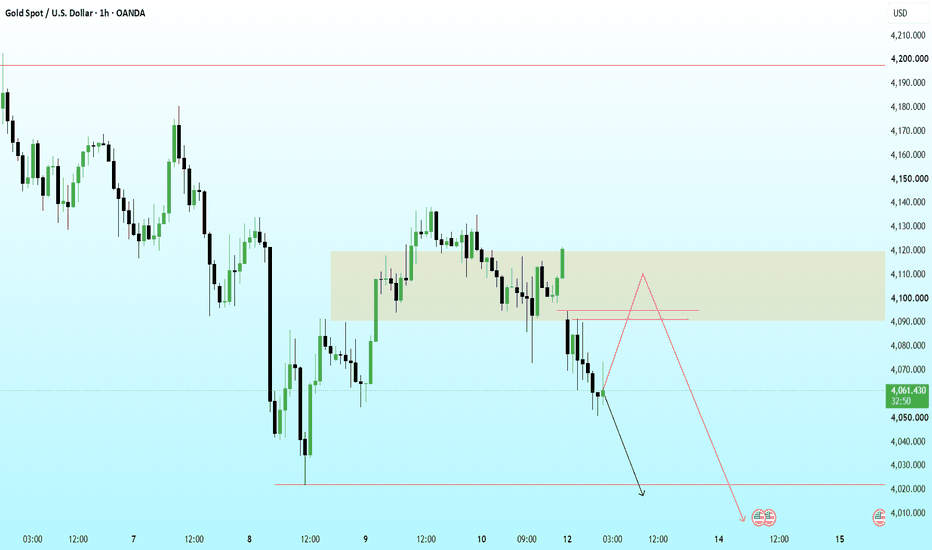
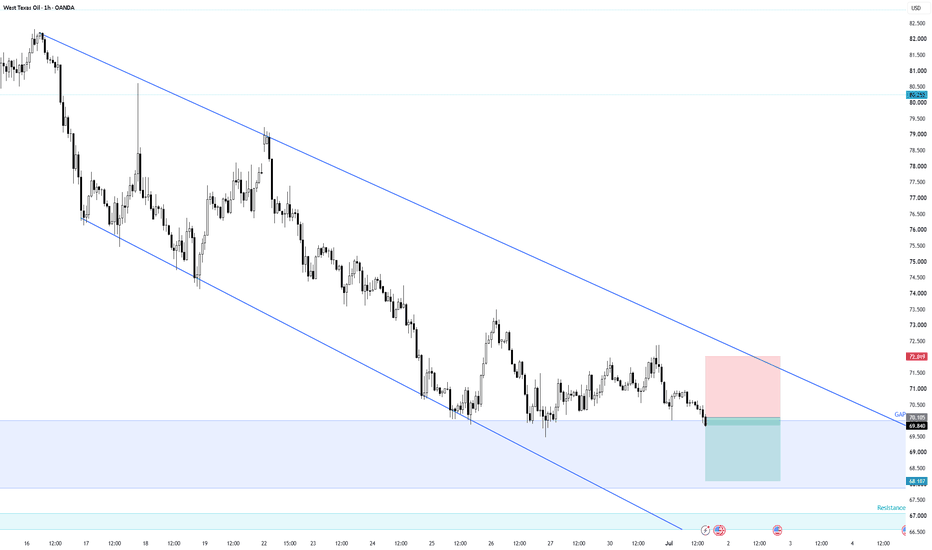
WTICOUSD 1H: The Gap-Fill Liquidity Run (Short Setup)
1. Market Context
On the 1H chart, Oil is trading within a dominant descending parallel channel. After a minor consolidation near the upper boundary, the price is executing a clean breakdown below the local support level at 70.103. This breakdown officially opens the door for a high-probability run to fill the historical gap down to the 68.107 level.
2. Sentiment & Price Trap Analysis
• The Retail Buyer Trap: Retail traders aggressively bought the local support around 70.500 to 71.000, expecting a bullish rebound toward the channel's upper boundary. Their stop losses (sell stops) are clustered heavily inside the unfilled gap zone, right below the key support floor of 70.103.
• The Gap Magnet & Liquidity Run: Unfilled gaps act as massive liquidity magnets because institutional algorithms seek to clear price inefficiencies. As the breakdown below 70.103 triggers the first wave of buyer stop-losses, the forced liquidation of these long positions will accelerate the downward momentum, driving the market straight into the core liquidity pool.
3. Trade Setup
We target a high-probability short entry to ride the liquidation momentum of trapped buyers into the gap-fill zone.
• Entry: 70.067 (Selling the breakdown of the gap trigger/local support)
• Stop Loss (SL): 72.019 (Placed safely above the local consolidation high and trendline confluence)
• Take Profit (TP): 68.107 (Targeting the complete fill of the historical gap / lower support)
• Risk-to-Reward Ratio (R:R): Approx 1:1
XAGUSD 4H: Channel Breakout & Short Squeeze Plan (Long Setup)1. Market Context
On the 4H chart, Silver is currently trading near the upper boundary of a major descending parallel channel. After a deep liquidity sweep at the local bottom where selling pressure exhausted (marked by the "No Buyer" signal near 57.081), the price initiated a strong recovery. It is now consolidating right beneath the critical descending trendline and the key horizontal resistance levels. We are waiting for a confirmed breakout to trigger an explosive upward move.
2. Sentiment & Price Trap Analysis
• The Trendline Seller Trap: Throughout the downtrend, retail traders have aggressively shorted every touch of the upper trendline (marked "Seller"), expecting the bearish structure to hold. This massive retail selling activity has clustered a heavy pool of buy-stop liquidity (stop losses) directly above the trendline and the horizontal resistance zone at 61.606 - 63.377.
• The Breakout Catalyst: A decisive 4H candle close above the trendline (marked "Break Signal") will instantly trap these late sellers. As their buy-stop orders are triggered, the forced liquidation of short positions will act as rocket fuel, accelerating the bullish momentum rapidly.
• The Institutional Support: Strong buying demand is waiting at the lower key support zones (marked "Buyer Wait Here"). These buyers are ready to defend the breakout structure on any potential pullbacks, confirming that the path of least resistance is now to the upside.
3. Trade Setup
We target a high-probability long entry on a confirmed breakout of the descending channel to exploit the trapped sellers' exit momentum.
• Entry: 60.419 (Buying the confirmed breakout close above the trendline / Break Signal)
• Stop Loss (SL): 57.081 (Placed safely below the local accumulation bottom)
• Take Profit (TP): 70.604 (Targeting the major overhead structural resistance zone)
• Risk-to-Reward Ratio (R:R): Approx 3:1
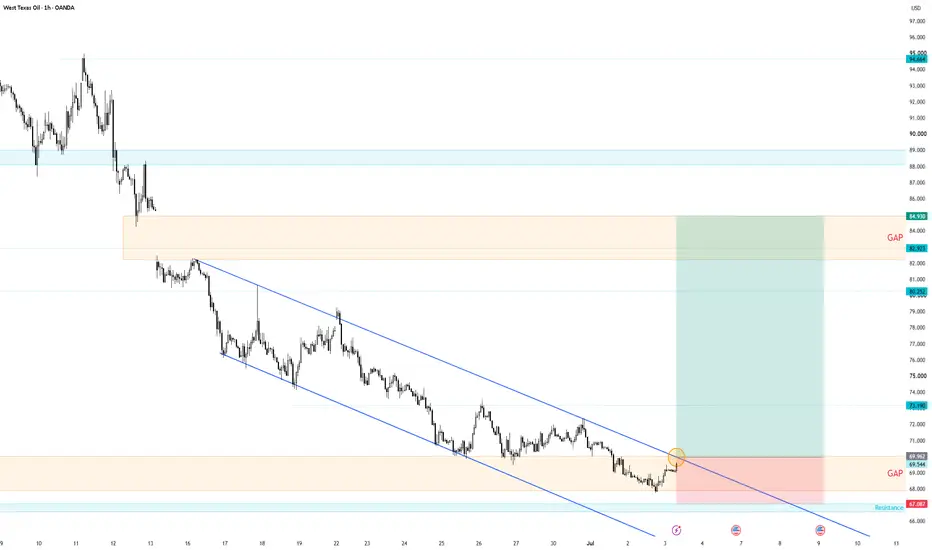
WTICOUSD 1H: Channel Breakout & Massive GAP Fill (Long Setup)1. Market Context
On the 1H chart, Oil has officially broken above the upper boundary of the dominant descending parallel channel that has controlled the price action for weeks. This decisive breakout above the 69.494 - 69.962 zone confirms a structural shift from bearish to bullish, opening the door for an explosive run to fill the massive historical GAP zone resting between 82.923 and 84.930.
2. Sentiment & Price Trap Analysis
• The Trapped Sellers: Throughout the life of the descending channel, retail traders aggressively opened short positions at every touch of the upper trendline resistance. Their stop losses (buy stops) are clustered heavily above the channel boundary, acting as a massive pool of buy liquidity.
• The Short Squeeze Catalyst: As the price breaks and holds above the channel, these sellers are forced into underwater positions. Their capitulation (forced market buy orders to cover short positions) will act as direct rocket fuel, accelerating the bullish momentum upward.
• The Ultimate GAP Magnet: Large institutional orders are sitting in the unfilled GAP zone near 82.923 - 84.930. The market will naturally seek this heavy liquidity pool now that the channel resistance has been completely reclaimed.
3. Trade Setup
We target a high-reward long entry to ride the short squeeze momentum into the massive overhead GAP fill.
• Entry Zone: 69.494 - 69.962 (Buying the confirmed channel breakout)
• Stop Loss (SL): 67.087 (Placed safely below the local consolidation low and major support)
• Take Profit (TP): 84.930 (Targeting the complete fill of the overhead GAP zone)
• Risk-to-Reward Ratio (R:R): Approx 5.3:1
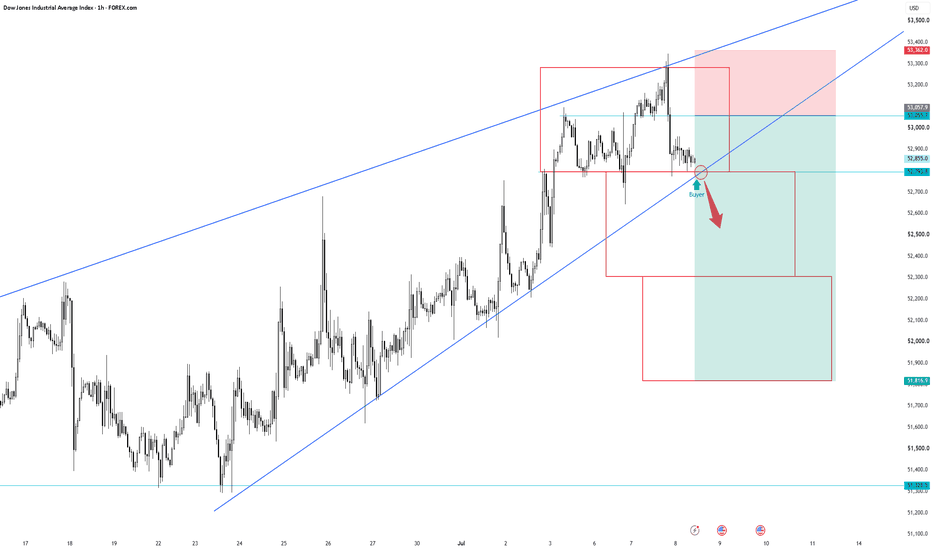
US30 1H: Trapping the Channel Buyers (Bearish Breakdown Setup)1. Market Context
On the 1H chart, US30 is trading within a well-defined ascending parallel channel. After a sharp rejection from the channel's upper boundary around 53,279.9, the price collapsed rapidly and is currently consolidating right above the critical ascending trendline support and local horizontal level at 52,793.7.
2. Sentiment & Price Trap Analysis
• The Retail Buyer Trap: Retail traders are aggressively opening long positions at the touch of the ascending trendline support (marked "Buyer"), expecting a typical bullish bounce back toward the upper channel limit. This heavy retail buying behavior has clustered a massive pool of sell-stop liquidity (stop losses) directly beneath the 52,793.7 support floor.
• The Breakdown Trigger: Institutional algorithms are likely keeping the price suspended temporarily to induce more retail buyers into the trap. Once the accumulation of long positions is complete, a decisive break below the 52,793.7 support will trigger a domino effect of stop-loss market orders (selling pressure).
• The Downward Expansion: The forced liquidation of trapped buyers will rapidly accelerate the downward momentum, driving the market straight into the deeper liquidity pools and structural support zones at 52,307.5 and 51,821.3.
3. Trade Setup
We target a high-probability short entry on the confirmed breakdown of the trendline support to capitalize on the trapped buyers' liquidation momentum.
• Entry: 52,793.7 (Selling the confirmed breakdown of the trendline and local support)
• Stop Loss (SL): 53,279.9 (Placed safely above the recent swing high/consolidation top)
• Take Profit 1 (TP1): 52,307.5 (First major horizontal support zone)
• Take Profit 2 (TP2): 51,821.3 (Ultimate target / lower structural expansion level)
• Risk-to-Reward Ratio (R:R): Approx 2:1 (Calculated based on TP2)
GBPUSD 15M: Trapping the Channel Buyers (Short Setup)
1. Market Context
On the 15M chart , GBPUSD has been trading within a well-defined ascending parallel channel. After failing to sustain its position near the upper boundary around 1.32731, the price formed a local consolidation box and is now executing a sharp breakdown below both the consolidation support and the channel's middle line.
2. Sentiment & Price Trap Analysis
• The Retail Buyer Trap: Inside the local consolidation box (between 1.32400 and 1.32700), retail traders aggressively opened buy positions, expecting a bullish bounce toward the channel's upper limit. This buying behavior has clustered a massive pool of sell-stop liquidity (stop losses) directly below the consolidation support at 1.32406.
• The Liquidity Trigger: The decisive breakdown below 1.32406 has successfully triggered the first wave of buyer stop-losses. As these retail long positions are forced to liquidate into market sell orders, the selling pressure is set to accelerate aggressively.
• The Downward Target: With retail buyers trapped at the top and forced to cut losses, market makers are expected to drive the price lower to hunt the remaining liquidity pool, targeting the lower channel boundary and the major structural support box near 1.31867.
3. Trade Setup
We target a high-probability short entry to exploit the liquidation momentum of the trapped buyers.
• Entry: 1.32406 (Selling the breakdown of the consolidation support)
• Stop Loss (SL): 1.32662 (Placed safely above the local consolidation high)
• Take Profit (TP): 1.31867 (Targeting the lower structural expansion zone)
• Risk-to-Reward Ratio (R:R): Approx 2.1:1
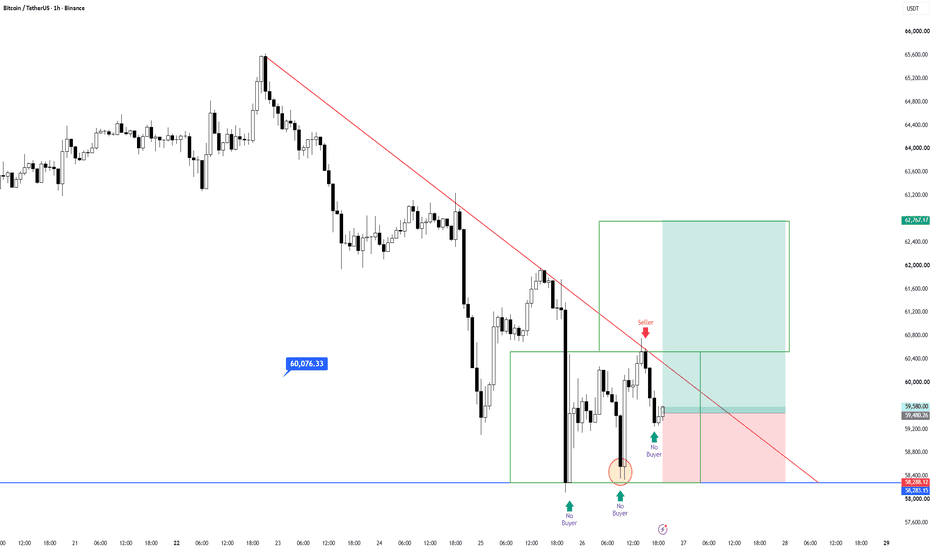
BTC 1H: Trapping Trendline Sellers & Liquidity Hunt1. Market Context
On the 1H chart of image, Bitcoin has successfully performed a liquidity sweep at the 58,288 support level. The "No Buyer" signals at the lows confirm that the selling pressure has been absorbed, and the market is currently testing the major descending trendline.
2. Sentiment & Price Trap Analysis
• The Trendline Seller Trap: Retail traders are actively shorting at the descending trendline (marked "Seller"), expecting the downtrend to continue. They are building a massive pool of buy-stop liquidity just above this trendline.
• The "No Buyer" Liquidity Sweep: The market maker has already flushed out weak buyers at the 58,288 support. The lack of selling follow-through confirms that the smart money is positioning for a reversal.
• The Short Squeeze Setup: As the price pushes against the trendline, the accumulated stop losses from the trapped sellers will act as fuel. A breakout above the trendline will trigger these stops, forcing a rapid upward move to clear the overhead resistance.
3. Trade Setup
We are targeting a long entry to exploit the trapped sellers' stop-loss orders.
• Entry: 59,480 (Breakout confirmation/Momentum)
• Stop Loss (SL): 58,280 (Placed safely below the liquidity sweep low)
• Take Profit (TP): 62,700 (Targeting the next structural resistance level)
• Risk-to-Reward Ratio (R:R): Approx 2.7:1
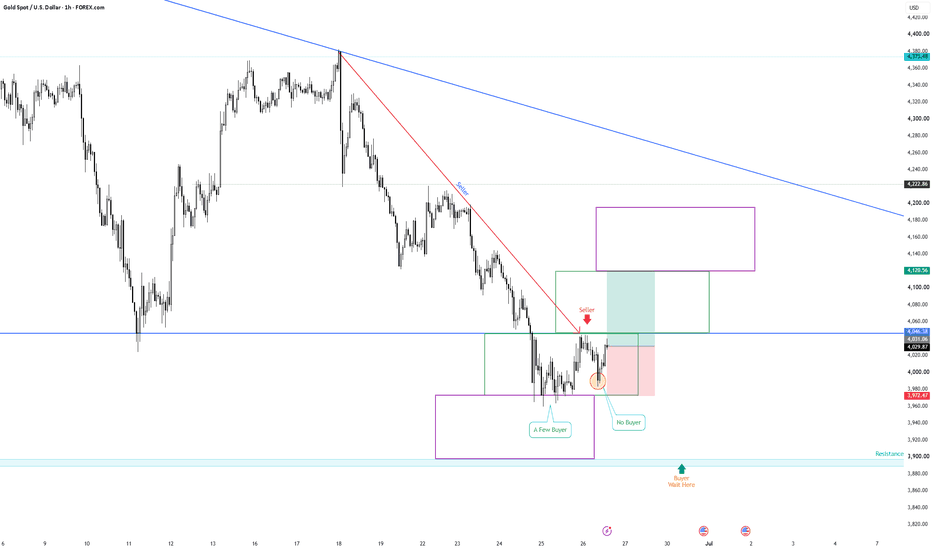
XAUUSD 1H: Trapping Trendline Sellers & Buyer Exhaustion1. Market Context
On the 1H chart of image, Gold is struggling under the major descending trendline. The price is currently oscillating within a small consolidation zone below the trendline, failing to sustain any significant bullish momentum.
2. Sentiment & Price Trap Analysis
• The Trendline Seller Trap: Retail traders are aggressively selling at the descending trendline (marked "Seller"), building a wall of buy-stop liquidity just above the trendline.
• The "A Few Buyer" Trap: Retail traders are buying the local dip (marked "A Few Buyer"), expecting a reversal. These positions are becoming liquidity for a potential move lower.
• The "No Buyer" Exhaustion: The signal marked "No Buyer" confirms that there is no genuine demand to push the price above the current resistance. This exhaustion suggests that the market is preparing to sweep the liquidity resting below the recent lows.
3. Trade Setup
We are targeting a short entry to capitalize on the exhaustion of buyers and the impending liquidity sweep.
• Entry: 4031.75 (Selling the exhaustion/No Buyer signal)
• Stop Loss (SL): 4046.38 (Placed safely above the recent resistance)
• Take Profit (TP): 3900.00 (Targeting the lower support liquidity zone)
• Risk-to-Reward Ratio (R:R): Approx 9:1
USDCAD 1H: Trapping the Consolidation Buyers1. Market Context
On the 1H chart, USDCAD is currently stuck in a tight consolidation range after failing to break above the major resistance level. The price is testing the lower support of this range, where retail traders are actively looking to buy the dip.
2. Sentiment & Price Trap Analysis
• The Retail Buyer Trap: The "Buyer" label at the support level indicates that retail traders are aggressively going long, expecting the range to hold. This has created a massive pool of sell-stop liquidity (stop losses) right below the support level.
• The "No Seller" Exhaustion: The price rejection marked as "No Seller" at the range high confirms that the momentum to push higher is currently absent, leaving the retail longs vulnerable to a breakdown.
• The Breakout Strategy: As retail buyers are trapped in the consolidation, a breakdown through the support will trigger their stop losses (sell orders), which will act as fuel to drive the price down to the primary trendline support.
3. Trade Setup
We are targeting a short entry on the breakdown of the consolidation support to capitalize on the stop-loss run.
• Entry: 1.41888 (Selling the breakdown of the consolidation support)
• Stop Loss (SL): 1.42146 (Placed safely above the recent high/resistance area)
• Take Profit (TP): 1.41218 (Targeting the lower support area near the trendline)
• Risk-to-Reward Ratio (R:R): Approx 2.6:1