XAGUSD SELL 94.18On the 4-hour chart, XAGUSD has stabilized and rebounded, and the price is expected to continue rising in the short term. Currently, attention should be paid to the area around 94.18, which is a potential shorting entry point for a bearish bat pattern and is also within a previous supply zone. If the price breaks through the resistance around 96.30, the bearish bat pattern will fail.
Gann Fan
Bullish Crab Pattern – Tata Capital LtdOn the chart dated 10 March 2026, a Bullish Crab harmonic pattern has been identified, marked by points X–A–B–C–D. This advanced harmonic setup signals a potential bullish reversal zone (PRZ) near point D.
🔑 Pattern Ratios Observed
XA retracement to B: 0.756 (close to ideal 0.618)
AB retracement to C: 0.787 (within harmonic range)
BC extension to D: 1.607 (approaching deeper extension zone)
XD extension: 1.117 (short of the ideal 1.618, but supportive)
🎯 Interpretation
The Bullish Crab is char
Shift is happeningon the 4h we are seeing a shift on the usdollar. Rsi+ma support that we are currently in a downtrend. It is currently breaking below a fractal division support/resistance level. if It holds underneath that I believe the trend will continue to go lower on the usdollar. I did highlight in green a potential pivot that if the trend reversal isn't true but only to grab liquidity, that area is a high probability for price to pivot off of. I can expect to see this trend continue until thursday roughly
S&P-500 Futures Bullish Gartley Entry at 200-day SMAThe Nasdaq-100 Futures have been holding up in the range printing potential Bullish Cup with Handle Pattern but the SPX Futures have come down to nearly a 0.886 retrace, completing a Bullish Gartley aligning with the 200-day SMA.
Oil has recently spiked above $110 which was likely the trigger for the SPX's decline, but at this point is likely to come crashing back down below $100 if not just for a week or so.
During this time we can likely see the SPX stage a recovery from this recent declin
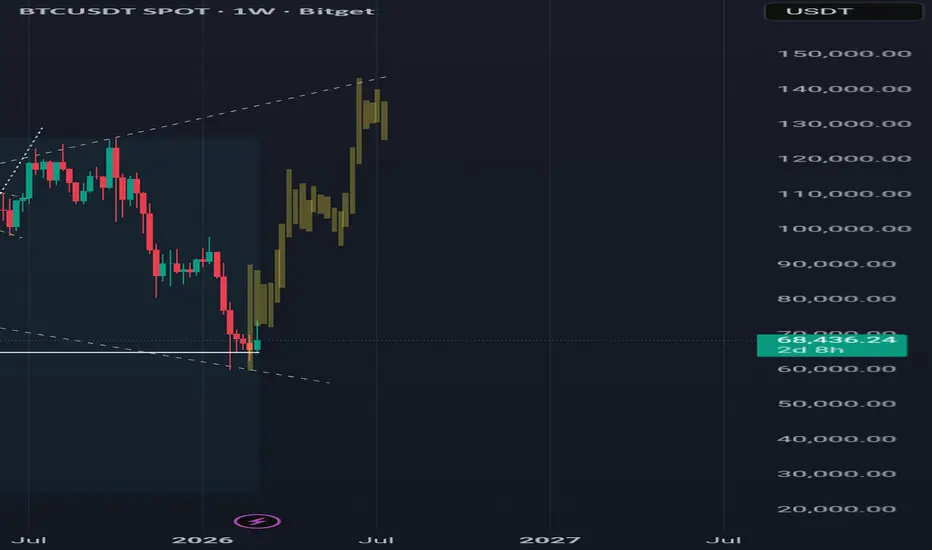
Plausible Bitcoin Price pathThe lower and upper trend line haven't been broken, giving a 📢 shape pattern. A bounce is plausible here, contrary to what majority think.
Combining the trend line with the visible POI, this would be interesting to watch.
If this plays out, I'd bet a bearish wolf pattern at 140kish would playout with a bearish target of 40k thereabout.
Ohhh well, time will tell.
Syengene Forming Shark pattern (Bearish Mode)Syengene has formed bearish Shark pattern on weekly time frame
776 is an important support at 0.5 Fib. Immediate target at 776.
If it closes below 776 on week candle, then rest target to follow and could go down more till 400.
Target1 - 776
Target2 & 3 - 736 / 680
Target4 & 5 - 515 / 400
SShort
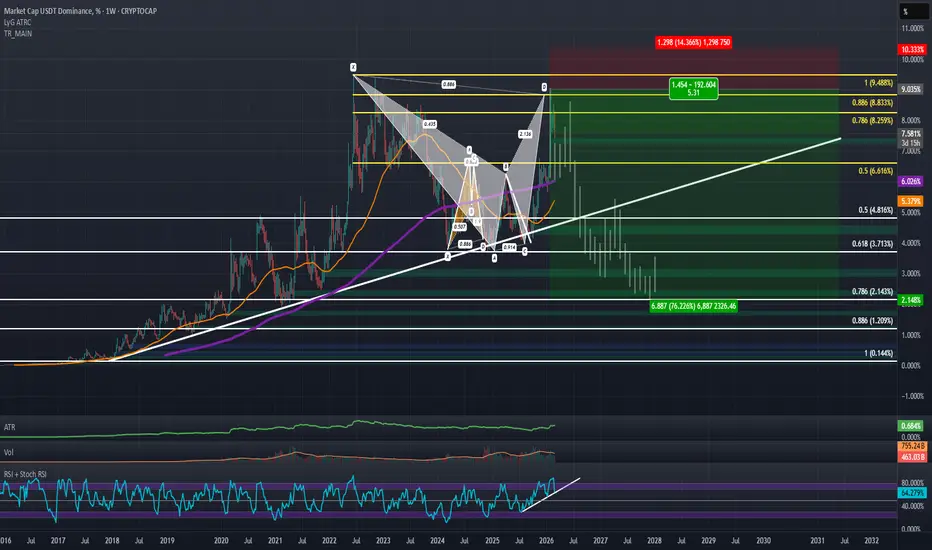
USDT Dominance: Bearish Bat; 3 Line Strike; RSI BreakdownOne of the main contributing technical reasons to my recent shift in being Bullish on crypto at these lows has been the USDT Dominance chart. Previously when I was Bearish, USDT.D was holding support at a trendline which aligned with the 61.8% retrace and had developed a local harmonic at the low and during the recent drop in crypto, the USDT Dominance rose back up and made a 0.886 retrace. It just so happens that in the process of doing so USDT.D completed an even bigger potential Bearish Bat P
Taking Profit on BTC Shorts; Looking to Get Tiny Long ExposureOriginally Posted: 02/05/2026
Reposted For Compliance: 02/13/2026
BTC and MSTR are at potential PCZs of Bullish Gartley; The two assets moved down leading to MSTR earnings and negative unrealized losses expectations. I do think that BTC will ultimately move back down, but from where it is now, looking at all of the downside short leverage that has been building at these lower levels, I think there is a high chance of it short squeezing to the upside and for it to be fast and violent move up to
EURUSD Has Hit Our Killzone –But is it a buy?Hey guys,
Quick follow-up on the EURUSD idea we’ve been stalking for the past two weeks.
The EURUSD has finally tapped into our identified killzone, a level built off previous structure resistance combined with a classic AB=CD pattern completion. On top of that, we’ve printed a strong rejection candle at the level which is a clear sign that buyers may be stepping in.
Now, we’re just waiting on one final piece of confirmation before officially labeling this as a high-quality buying opportunit
Bullish 2021 Bitcoin Fractal Suggests Bitcoin has BottomedBitcoin is sitting at the PCZ of a what can be plotted as both a Bullish Cypher and a Bullish gartley and on the 5D timeframe it is below the 200 Period SMA which it usually doesn't stay below for long; and is also sitting a the 1.618 Standard Deviation demand line of a Linear regression Channel while exhibiting Bullish Divergence on the MACD and starting to show a second recovery from oversold zones in the RSI after what was a sharp secondary decline into oversold zones and lastly on the price
ETHUSD: Bullish Gartley with Bullish Divergence 10.3HR TimeframeETH Thus far has held up well at the Bullish Butterfly PCZ that I mentioned in the last idea I posted on ETH here: since then, I'v realized that this Butterfly PCZ aligns with the 0.886 retrace from the macro low to high and at these levels the price action has closely followed the initial projection marked in the gray with having an initial bounce followed by a secondary retrace back down to the lows. If this projection is to continue to playout we should expect to see ETH break free from this
NFLX Weekly: Macro Trendline Bounce & The AB=CD Path to $188The weekly setup on Netflix (NFLX) is developing into an even more compelling narrative. Following up on the critical support confluence identified previously, we can now map out a clear AB=CD measured move that provides a massive upside target.
Here is the context and reasoning behind this updated technical structure:
The Foundation (Point C): Price has perfectly backtested the macro ascending trendline from the 2022 lows, aligning tightly with the 0.5 Fibonacci retracement zone at 75.37. The
BTC/USD testing the resolve of major demandThere is a lot to digest on BTC/USD right now. Longer-term flow shows that buyers and sellers are squaring off in a sizeable demand area at US$49,039-74,022 (black). While buyers are beginning to appear in the US$60,000 range, I cannot help but be drawn to the US$35,000-44,957 area. The reasoning is simple. There are likely a substantial number of sell stops located under the large monthly demand area. Tripping these orders could provide enough liquidity to buy from demand at US$39,886-44,957 (o
Bitcoin’s Next Push Be Loading (Clues: USDT.D% + S&P500)Following Trump’s speech, Bitcoin ( BINANCE:BTCUSDT ) began to rise.
Currently, Bitcoin is back inside the heavy support zone ($78,260-$64,850). Although the break wasn’t accompanied by strong momentum, it was expected to re-enter this zone.
From a pattern analysis perspective, it seems that on the 4-hour timeframe, Bitcoin could resume its upward move with the help of a Bullish Gartley Harmonic Pattern.
In terms of Elliott Wave theory, it seems the main wave Y hasn't yet completed, so we c
USDCAD SELL 1.3878On the daily chart, USD/CAD has stabilized at lower levels. Currently, attention should be paid to the resistance around 1.3725; a break above this level could lead to further upward movement, with a target around 1.3878. When the price reaches 1.3878, watch for a potential bearish bat pattern, as this level falls within a previous supply zone.
GODREJ PROPERTIESGodrej Properties Ltd. (NSE: GODREJPROP) is one of India’s leading real estate development companies, incorporated in 1990. It develops residential, commercial, and township projects across major Indian cities, leveraging the strong brand equity of the Godrej Group.
Promoter: Godrej Industries Ltd. (Godrej Family) – 58.48% holding (Dec 2025)
FY22–FY26 Snapshot
Revenue Growth: CAGR ~18% over FY22–FY26, driven by strong residential launches. → Good
Net Profit: FY26 PAT ~₹1,150 Cr, reflecting ro