Long
Long
FILATEX INDIAFilatex India Ltd. (CMP ₹45.07, NSE: FILATEX)
A New Delhi‑based synthetic yarn manufacturer, incorporated in 1990. The company is among India’s leading producers of polyester and polypropylene multifilament yarns, with strong promoter backing from Madhu Sudan Bhageria & Family.
Promoter Holding (Dec 2025): Bhageria Family — majority stake
FY22–FY26 Snapshot (as of 28 April 2026)
Revenue Growth: Q2 FY26 revenue ₹1,075.93 Cr vs ₹1,049.10 Cr in Q2 FY25 (+2.56% YoY). → Neutral
Net Profit: Q2 FY26 PAT ₹47.58 Cr vs ₹13.47 Cr in Q2 FY25 (+253% YoY). → Good
Operating Margin: EBITDA ₹88.93 Cr, margin 8.27% vs 4.36% last year. → Good
Equity Capital: Stable, no dilution. → Good
Dividend Policy: Yield ~0.6%, consistent payouts. → Good
Asset Building: Capacity utilization improved, production volume up 5.24% YoY. → Good
Sales: Sales volume grew 5.34% YoY to 101,391 MT. → Good
Expense: Cost management improved, margins expanded. → Good
EPS: TTM EPS ~₹4.52. → Neutral
Institutional Interest & Ownership Trends (Dec 2025)
Promoter Holding: Majority stake with Bhageria family
FII Holding: Limited participation
DII Holding: Stable institutional interest
Retail & Others: Active trading volumes (~28.8 lakh shares/day)
Strategic Moves & Innovations
Focus on operational efficiency and cost management.
Expansion in synthetic yarn production capacity.
Strengthening market penetration in domestic and export segments.
Investments in value‑added yarns and specialty products.
Cash Flow & Balance Sheet Strength
Strong operating cash flows supported by higher margins.
Debt levels moderate, balance sheet conservative.
Profitability momentum supports reinvestment in capacity.
Risk Factors
Dependence on polyester yarn demand cycles.
Exposure to raw material price volatility (crude derivatives).
Competition from domestic/global textile manufacturers.
Margin pressure if demand weakens in FY27.
Investor Takeaway
Filatex India has delivered robust profitability growth in FY26, with margins expanding significantly despite modest revenue growth. Backed by strong promoter control and operational efficiency, the company’s long‑term outlook remains cautiously positive, with Q4 FY26 results (due May 12, 2026) expected to provide clarity on FY27 guidance.  Long
Long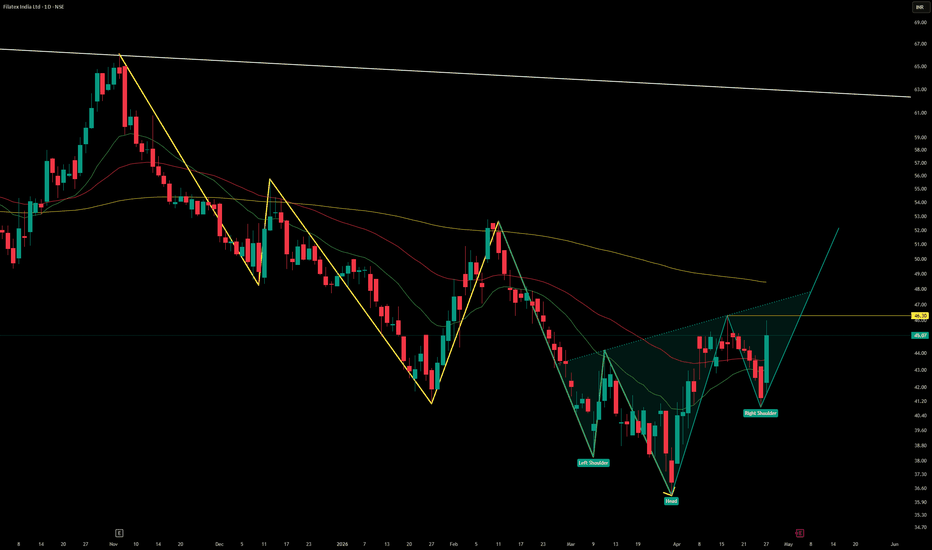
AAPL Top-Down Analysis | Liquidity, Confluence & EMA Structure In today’s review of Apple (AAPL), I walk through my top-down analysis process using the tools I keep on my chart to help build context and identify higher-probability areas of interest.
This review focuses on how I use the 13 and 21 EMA, supply and demand zones, and extended-hours session levels in TradingView to better understand where price may be leaning.
Rather than relying on one signal alone, the goal is to build confluence by combining multiple context clues from price action, liquidity behavior, and structure.
A major focus in this review is understanding how liquidity influences price movement and how those clues can help build a case for where price may be targeting next.
In this video, I cover:
• How I use the 13 and 21 EMA to read short-term structure
• Identifying supply and demand zones that may influence price
• Using extended-hours levels as additional liquidity reference points
• Building confluence through liquidity, structure, and price clues
This approach is designed to simplify the chart, reduce noise, and focus on how price behaves around important areas rather than forcing a prediction.
As always, the focus remains on confirmation over prediction.

 Long
Long
Is Retail Vs Whales Signaling A Dangerous Crypto Setup?The crypto market often looks strongest right before it turns. Prices rise, optimism spreads, and retail participation surges rapidly. Many investors see this as confirmation of a bullish trend. However, beneath the surface, a different story begins to unfold. The current whale vs retail dynamic suggests something unusual. Retail investors aggressively enter positions while large holders remain inactive. This imbalance does not happen randomly. It has historically appeared before major market corrections.
Market cycles reward those who understand behavior, not just price. Retail investor behavior often follows emotion, while whales act with strategy. When these two groups move in opposite directions, the signal becomes too strong to ignore. The latest crypto market divergence reflects this exact pattern. Retail demand increases sharply, yet whale activity declines. This setup has repeated across multiple Bitcoin cycles. Each time, it has led to significant downside moves.
Why Whale Vs Retail Dynamics Matter More Than Price
Price action alone does not reveal the full story. Market structure depends heavily on who drives the movement. Retail traders bring momentum, but whales bring sustainability. The whale vs retail relationship defines market strength. When whales accumulate, rallies tend to last longer. When retail dominates, volatility increases and reversals become likely.
Large holders control liquidity and direction. They do not chase trends. Instead, they position early and exit quietly. This behavior creates a crypto market divergence that signals potential weakness. Retail traders often interpret rising prices as confirmation. They enter late, expecting continuation. However, whales already prepare for the opposite outcome. This disconnect creates risk.
Retail Investor Behavior Is Driving The Current Rally
Retail investor behavior shows clear signs of aggressive buying. Social sentiment rises, leverage increases, and new participants enter quickly. These signals often appear near market peaks. Retail traders tend to follow trends rather than anticipate them. They react to price movements instead of analyzing underlying flows. This approach works during early rallies but fails during late-stage moves.
The current surge in retail participation reflects strong confidence. However, confidence alone does not sustain markets. Without whale support, rallies lose strength over time.
Are Retail Traders Becoming Exit Liquidity Again
The concept of exit liquidity defines many market tops. Whales distribute assets to late buyers. Retail unknowingly absorbs this supply. The current whale vs retail setup raises this concern again. Retail investors enter aggressively while whales reduce involvement. This behavior matches previous distribution phases.
Retail investor behavior often repeats across cycles. Fear drives selling during lows, while greed drives buying during highs. Whales exploit this pattern. This does not mean an immediate crash. Markets can stay irrational longer than expected. However, the risk increases significantly under these conditions.
Final Thoughts on Whale Vs Retail
Understanding the Bitcoin correction signal requires attention to key metrics. Whale accumulation data, exchange flows, and leverage ratios provide valuable insights. Traders should not rely solely on price trends. The underlying crypto market divergence tells a more accurate story. Ignoring it increases exposure to sudden reversals.
Risk management becomes critical during these phases. Position sizing, stop losses, and patience help navigate uncertainty. Emotional decisions often lead to losses. Retail investor behavior will likely remain aggressive. However, smart money already adjusts positioning. This difference defines the next move.  Short
Short
PII | Massive Move Incoming for Recreational Vehicles | LONGIf you only look at the surface-level narrative, Polaris Inc. (PII) looks like toxic waste right now. We are staring down the barrel of a harsh consumer recession, liquidity is drying up, and the street assumes absolutely no one is going out to finance luxury ATVs, side-by-sides, or snowmobiles.
But that is the narrative you are being fed. We are here to hunt the mathematical reality they are hiding.
Take a look at the 3-day chart. While the retail crowd is dumping this stock based on recession fears, the smart money has been quietly engineering a massive, multi-year Inverse Head and Shoulders bottom. The structural plumbing is perfectly aligned, and the powder keg is lit for a violent, explosive rip in 2026.
Here is the exact breakdown of why the trap is about to snap shut on the shorts.
1. The Technical Setup: Wyckoff in Plain Sight
The street is blind, but the tape never lies. We have been trapped in a brutal consolidation phase, but volatility contraction always precedes volatility expansion.
The 3-Day Inverse H&S: We have a clearly defined Left Shoulder, a deep capitulation Head, and a tightly coiled Right Shoulder. The volume profile on the Right Shoulder is bone dry, a total ghost town on the ask.
The Spring: This entire bottoming structure is a textbook Richard Wyckoff accumulation phase. The "Head" of this pattern was the Spring, a final, engineered flush of weak hands to grab liquidity before the mark-up.
The Bullish Divergence: Look at the momentum beneath the surface. When the price flushed to form the Head (the lower low), the 3-day RSI and MACD printed a massive, screaming bullish divergence. The underlying momentum shifted definitively positive months before the price action caught up.
2. The Macro Catalyst: The War vs. The Recession
Why is institutional money heavily accumulating a "recreational vehicle" stock heading straight into a global deleveraging event? Because they know Polaris isn't just selling weekend toys.
This is the ultimate divergence between perception and reality.
The Defense Reality: The street is pricing PII strictly as a consumer discretionary stock about to get crushed by a shrinking consumer wallet. They are completely ignoring Polaris Government and Defense. Polaris is a major supplier of ultra-light tactical vehicles (like the MRZR and DAGOR) to the U.S. military, special forces, and allied nations.
The Geopolitical Pressure Cooker: As the U.S./Iran/Israel conflict escalates and the geopolitical landscape shifts into a definitive risk-off environment, defense spending is surging. Government military contracts provide a bulletproof, high-margin revenue floor that completely bypasses the consumer recession.
3. The Execution
The shorts have pushed this beach ball into the abyss, betting entirely on the consumer recession narrative. But the pressure is mathematically impossible to maintain.
Once the neckline of this Inverse Head and Shoulders breaks on high volume, the structural integrity of the short thesis collapses. When the street finally wakes up and realizes the incoming defense revenue dwarfs the consumer slowdown, the forced, desperate buying will act as pure fuel.
Drawing the Fibonacci extensions from the base of the head, the initial snap-back target sits significantly higher than current consensus.
Do not get shaken out by the recession noise. Watch the neckline.
Stay vigilant, stay divergent, and keep seeking the truth.
The Seeker  Long
Long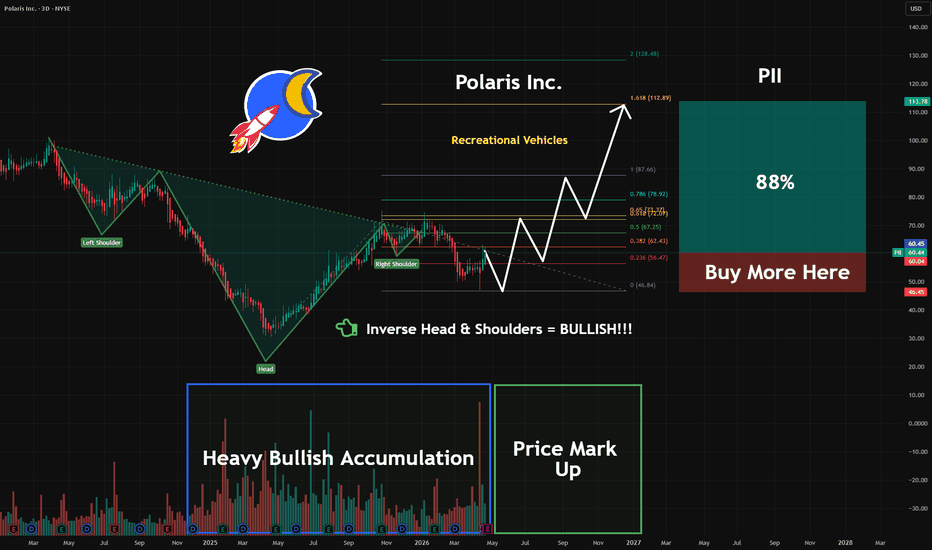
 Long
Long
ARM | The Next Semi to Move Higher | LONGArm Holdings Plc engages in the licensing, marketing, research, and development of microprocessors, systems IP, graphics processing units, physical IP and associated systems IP, software, and tools. It operates through the following geographical segments: United Kingdom, United States, and Other Countries. The company was founded on November 12, 1990 and is headquartered in Cambridge, the United Kingdom.  Long
Long
 Long
Long
 Long
Long
 Short
Short
MESM Analysis: Mid-range structure, 7172 above and 7100 belowMESM analysis for Wednesday, April 22
MESM is trading around 7144 and still sitting in the middle of yesterday’s range, so for now I’m treating the market as range-bound until we get a clear break.
On the 4H chart, the key upside level I’m watching is 7147. If price can close above that level on the 4H, then I’ll be watching for continuation toward 7172. If strength continues after that, then 7182 remains the next upside liquidity level.
On the downside, the key level is 7130. If price starts closing below that, then I’ll be watching for weakness into 7100.
On the 1H chart, the current candle is leaving a long wick, which tells me there is still hesitation around current price. That makes me want to stay patient and wait for confirmation.
On the 15M chart, there is an inverse fair value gap inside the green highlighted zone, and I think there’s a good chance price may revisit that area first before making the next directional move.
Key levels
7147 = 4H breakout level
7172 = first upside target
7182 = yesterday’s high / higher liquidity
7130 = key downside level
7100 = downside target
Green zone = 15M inverse fair value gap
So for today, my plan is:
Above 7147 = watch for continuation into 7172 and possibly 7182
Below 7130 = watch for weakness into 7100
Watch the 15M inverse FVG first, because price may react there before choosing direction
Not financial advice. No confirmation, no trade. CME_MINI:MESM2026  Long
Long
AAPL Top-Down Analysis | Confluence, Liquidity & Price Context –In today’s review of Apple (AAPL), I walk through my top-down analysis process with a focus on reading price through context, confluence, and liquidity behavior.
Starting from the higher timeframe, I use the chart to identify key areas of interest and build a framework for understanding what price may be doing. From there, I work down into the intraday structure to refine the analysis and look for higher-probability areas where the market may react.
The focus in this review is on using multiple context clues from price action — including liquidity behavior, support and resistance, and areas of confluence — to build an educated case for where price may be leaning.
Rather than forcing a prediction, the goal is to interpret what price is communicating and wait for confirmation before considering an entry.
In this video, I cover:
• Using the top-down method to build market context
• Identifying confluence between important levels
• Understanding liquidity behavior and potential sweeps
• Using price action clues to evaluate directional bias
This approach is designed to simplify the chart, remove noise, and help traders focus on where price is most likely to react.
As always, the focus remains on confirmation over prediction.

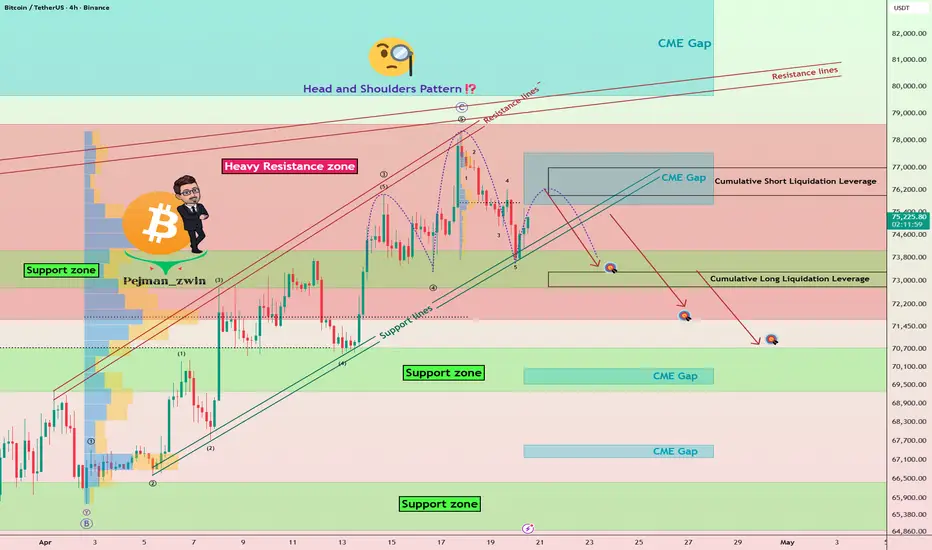
Bitcoin After the Rally — Is a Bigger Drop Loading?Last week, as investor optimism rose, especially alongside the stock market and the S&P 500 ( FX:SPX500 ), Bitcoin ( BINANCE:BTCUSDT ) didn’t miss out on the rally, reaching around $78,600. However, over the weekend, Bitcoin began to decline. One reason is the possibility of renewed military tensions between Iran and the U.S. in the Middle East, which brought more fear into the crypto market.
Additionally, since my analysis of the S&P 500 suggests a bearish outlook, Bitcoin may continue its downward trend this week. That said, any positive news—like an Iran-U.S. agreement—could swiftly shift the market, so risk management is key.
Currently, Bitcoin is moving in the heavy resistance zone($78,600-$71,700) and approaching the Cumulative Short Liquidation Leverage($77,700-$76,000).
From a classical technical perspective, it seems Bitcoin could form a head and shoulders pattern, especially if it begins to decline before reaching $76,000. This would confirm the pattern and could lead to further declines in the coming days.
From an Elliott Wave perspective, it looks like Bitcoin completed its main wave C, so we may expect downward waves—particularly after breaking support lines.
I expect Bitcoin, after hitting the Cumulative Short Liquidation Leverage($77,700-$76,000), could drop at least to $76,000, break support lines, and potentially fall to around $73,600. If the momentum is strong, we might even see it drop toward $72,230.
First Target: $73,600
Second Target: $72,230
Stop Loss(SL): $77,500(Worst)
Points may shift as the market evolves
Cumulative Long Liquidation Leverage: $73,300-$72,800
New CME gap: $77,545-$75,680
CME gap: $84,560-$79,660
CME gap: $70,055-$69,535
CME Gap: $67,570-$67,170
What’s your view on Bitcoin? Could it push above $80,000, or should we expect another drop?
💡 Please respect each other's opinions and express agreement or disagreement politely.
📌Bitcoin Analysis (BTCUSDT), 4-hour time frame.
🛑 Always set a Stop Loss(SL) for every position you open.
✅ This is just my idea; I’d love to see your thoughts too!
🔥 If you find it helpful, please BOOST this post and share it with your friends. Short 
 Long
Long
 Long
Long
 Short
Short