Keeping it Simple: 3 Technicals That Tell the StoryMost traders overcomplicate charts.
In reality, there are three technicals that I find that explain market behavior
For me, everything comes down to Volume, Moving Averages, and Breakouts
1. Volume = Conviction
I find that Volume is the most interesting indictor, it shows real participation in the market. Price can move on low volume, but that doesn't mean there's real commitment behind it
- Low volume move / weak conviction
- High volume move/ real participation
If price moves without volume, I get cautious. When volume confirms the move, thats when I pay closer attention
Over the past year, watching volume closely has been important. In many cases, volume expanded as narratives developed, reflecting how participants were positioning in real time.
It's a reminder that price may follow the news, but volume often can reflect behavior first
2. Moving Averages = Structure
I use the 50-day and 200-day moving averages as a framework
These levels matter because institutions are watching them. They act as common reference points for positioning, risk management, and trend confirmation, which makes them self- fulfilling.
Above/ trend intact
Below/ potential shift
3. 20- Day Breakouts (Donchian Channel)
When price does something it hasnt done in 20 days, this is a shift in behavior
as markets move in phases of compression to expansion and this can signal a shift in behavior where potential opportunities may develop
The market is a reflection of collective psychology. Fear drives exits, greed drives chasing, and uncertainty creates consolidation. Price doesn't move because something has happened it moves because of how people are forced to respond. Understanding these behavioral shifts can provide additional context before they become obvious
This content is for informational and educational purposes only and should not be considered investment advice. The chart is used solely to illustrate the concepts discussed and does not represent a recommendation to buy or sell any financial instrument
 Education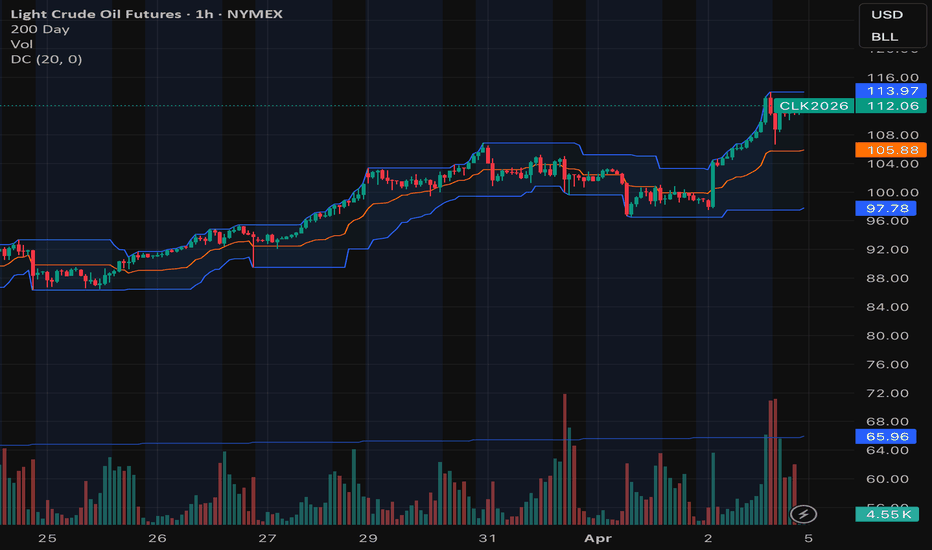
OPEN: Opendoor 2.0. Four steps to profit (update)Opendoor Technologies is a platform for buying and selling homes online. The company is shifting from a direct purchase model to a technology platform using artificial intelligence.
On February 19, 2026, the company reported fourth quarter 2025 results. Revenue came in at $736 million, down 32% year over year but beating estimates. Net loss for the quarter reached $1.1 billion, with a loss per share of $1.26. Cash on hand stands at $962 million. Market capitalization is $4.5 billion. The 52 week high is $10.87, the low is $0.51.
Since October 2025, the company has been led by CEO Kaz Nejatyan, who introduced a four step plan. First, achieve breakeven on adjusted net income by the end of 2026. Second, increase transaction speed and launch mortgage lending. Third, reduce inventory days on market. Fourth, transition to a capital light model.
The plan is working. Since September 2025, home acquisition velocity has increased 300%. In the last week of Q3, the company bought 128 homes; in the last week of Q4, it bought 537. The October 2025 cohort, the first full Opendoor 2.0 cohort, shows the best margin among all October cohorts in company history. In Q4, homes acquired grew 46% quarter over quarter.
The capital light Cash Plus model grew from 19% to 35% of weekly volume. Average inventory days on market decreased 25%. The company launched a mortgage lending pilot program in Q1 2026.
The next report is expected on April 30, 2026.
On the weekly chart, a golden cross is confirmed: MA100 crossing above MA200 from below. This is a long term trend reversal signal. Price is in the second retest zone of the 0.618 Fibonacci level at $4.70–4.80. The first retest was in February. Current price is $4.74. Support at $4.36 and $2.48. Resistance at $9.53, $10.87, and $21.64.
The $4.70–4.80 zone is the key entry area. The golden cross is confirmed, the 0.618 retest is in progress, and price holds above both MA100 and MA200. Targets: $9.53, then $10.87 and $21.64.  Long
Long
 Short
Short
BTCUSDT 4H – Bearish Structure, Sideways PriceBitcoin continues to hold a bearish structure, but price action has shifted into a sideways phase.
After the recent drop, the market is no longer trending aggressively. Instead, it is consolidating.
Current Structure
The moving averages remain in a bearish alignment:
60MA > 20MA > 5MA
This indicates that the overall short-term trend is still to the downside, with sellers maintaining control.
Price Behavior
Despite the bearish structure, price is no longer pushing lower.
Instead, it is moving sideways, forming a range.
This kind of behavior often signals a pause rather than a reversal.
What This Means
A sideways market under bearish structure usually represents a compression phase.
The market is not yet ready to move, but pressure is building.
From here, two outcomes are possible:
• Continuation lower, following the current trend
• A break of structure if buyers step in strongly
Key Observations
• Bearish MA alignment (60 > 20 > 5)
• Price consolidating in a range
• No strong momentum in either direction
• Market in compression
Approach
This is not a high-conviction environment.
I’m not looking for aggressive positions here.
Instead, I’m waiting for a clear break — either a breakdown or a reclaim of key levels.
Conclusion
The structure remains bearish.
But the market is currently neutral in movement.
Compression phases like this often lead to expansion.
The next move will define direction. Education 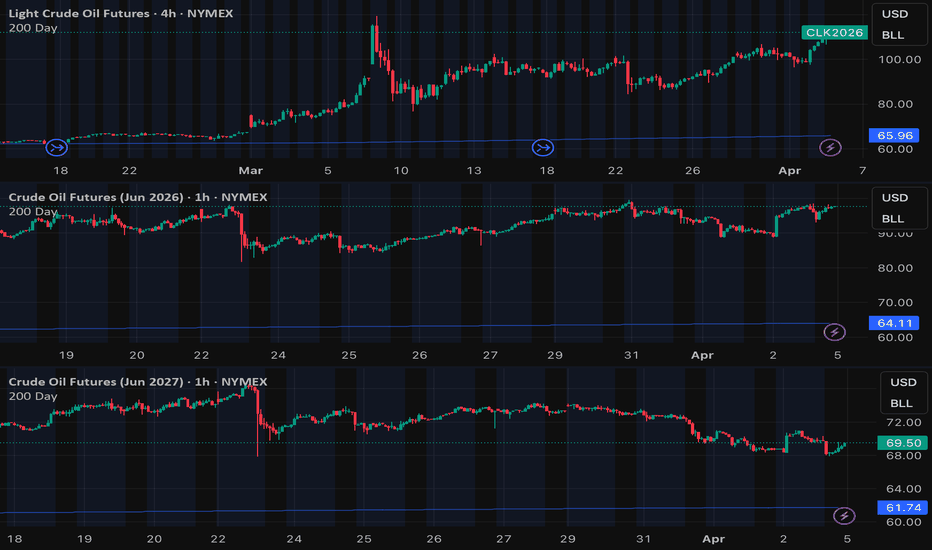
Blackstone Tries to Bounce: Will it Last?Private-equity giant Blackstone has stabilized for more than a month, but some traders may think the bounce won’t last.
The first pattern on today’s chart is the steady decline from the $150-160 range in January and February. BX has moved sideways since that move while making mostly lower highs. That may suggest it’s in a consolidation phase rather than a bottom.
Second, the stock has failed to hold a previous low from April 2025. Is long-term support breaking?
Third, the 8-day exponential moving average (EMA) has remained below the 21-day EMA. That may confirm the short-term direction is lower.
Finally, the 50-day simple moving average (SMA) had a “death cross” below the 200-day SMA in December and has remained there since. That may confirm longer-term bearishness.
TradeStation has, for decades, advanced the trading industry, providing access to stocks, options and futures. If you're born to trade, we could be for you. Learn more here about TradingView’s Broker of the Year!
Past performance, whether actual or indicated by historical tests of strategies, is no guarantee of future performance or success. There is a possibility that you may sustain a loss equal to or greater than your entire investment regardless of which asset class you trade (equities, options or futures); therefore, you should not invest or risk money that you cannot afford to lose. Online trading is not suitable for all investors. View the document titled Characteristics and Risks of Standardized Options at www.TradeStation.com . Before trading any asset class, customers must read the relevant risk disclosure statements on www.TradeStation.com . System access and trade placement and execution may be delayed or fail due to market volatility and volume, quote delays, system and software errors, Internet traffic, outages and other factors.
Securities and futures trading is offered to self-directed customers by TradeStation Securities, Inc., a broker-dealer registered with the Securities and Exchange Commission and a futures commission merchant licensed with the Commodity Futures Trading Commission). TradeStation Securities is a member of the Financial Industry Regulatory Authority, the National Futures Association, and a number of exchanges.
TradeStation Securities, Inc. and TradeStation Technologies, Inc. are each wholly owned subsidiaries of TradeStation Group, Inc., both operating, and providing products and services, under the TradeStation brand and trademark. When applying for, or purchasing, accounts, subscriptions, products and services, it is important that you know which company you will be dealing with. Visit www.TradeStation.com for further important information explaining what this means. XAUUSD: Back Below EMA200 — $4,760 to $4,621 Overnight█ STRUCTURE
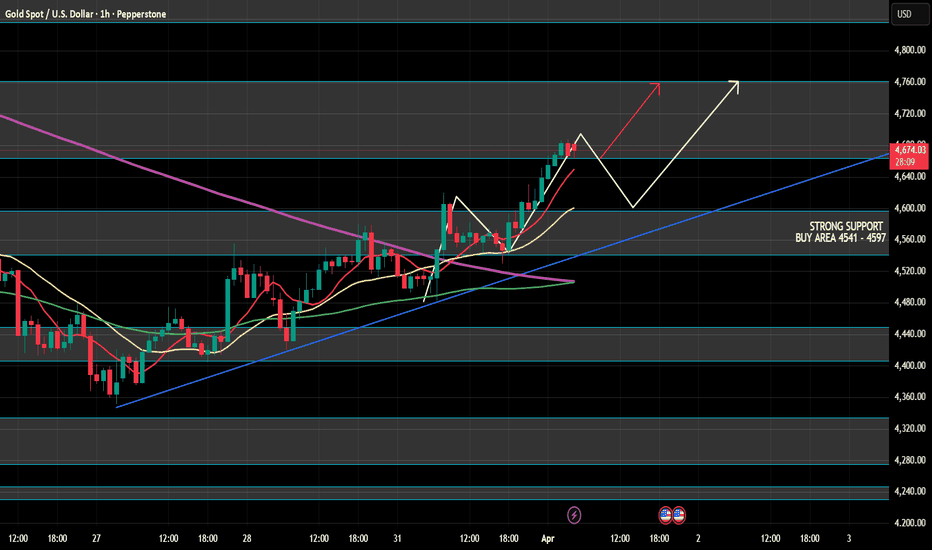
24 hours ago, gold was at $4,760 with a clean bullish structure above EMA200. Today: SHORT/Below/Bearish at $4,621.
The selloff from $4,760 was sharp — bearish BoS confirmed and price dropped back below EMA200 (cyan ~$4,666). An MSS↑ candidate sits on the right edge, suggesting a potential bounce, but the structure has officially flipped bearish again.
This raises a critical question: was the entire $4,350 → $4,760 rally just another failed bounce in the larger downtrend? Or is this a healthy pullback before continuation higher?
The answer lies in where price finds support. The key level is $4,600-4,620 — this is the zone where bullish BoS labels appeared during the rally. If this area holds and a bullish MSS fires, the uptrend could resume. If it breaks, the next support zone is $4,500-4,550.
█ KEY LEVELS
Resistance: $4,666 (EMA200 — back to resistance)
Resistance: $4,700-4,720 (recent BoS zone)
Support: $4,600 (current area / rally BoS zone)
Below: $4,550 / $4,500
█ WHAT TO WATCH
MSS↑ candidate on the right edge — if this fires and price reclaims EMA200 ($4,666), the bull case is alive. If $4,600 breaks instead with bearish BoS → this was another failed bounce like Mar 17 and Mar 20.
The 3-step framework applies: Sweep below $4,600 → bullish MSS → hold above on retest = confirmation.
Not financial advice. For educational purposes only.
Short 
 Short
Short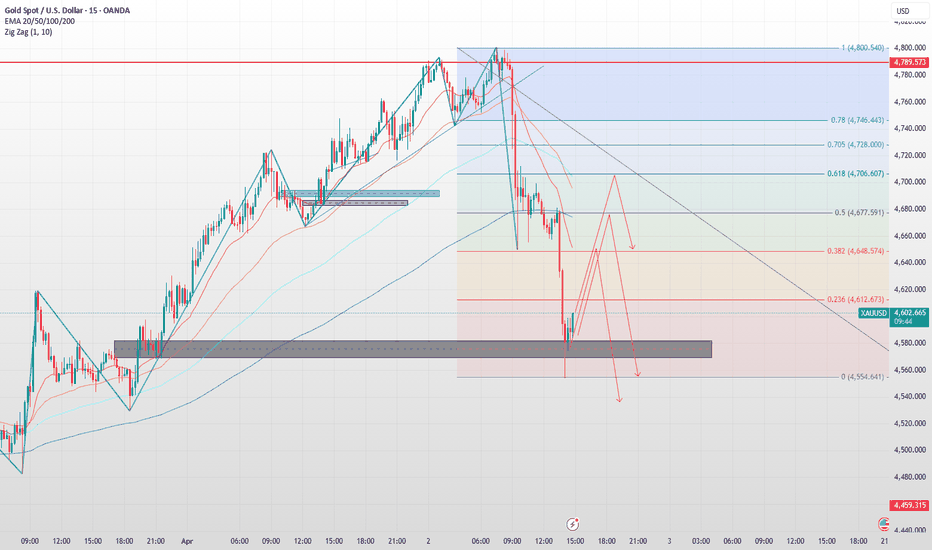
 Long
Long
Short 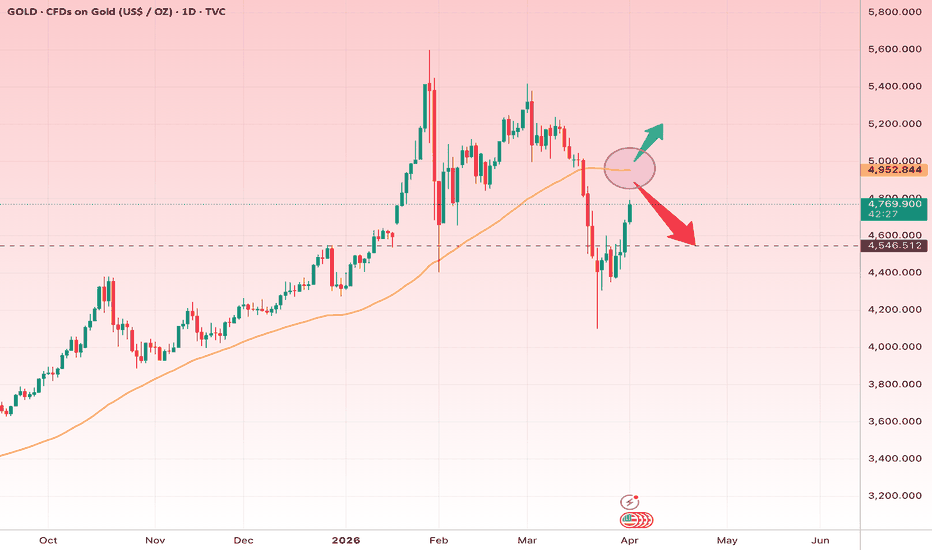
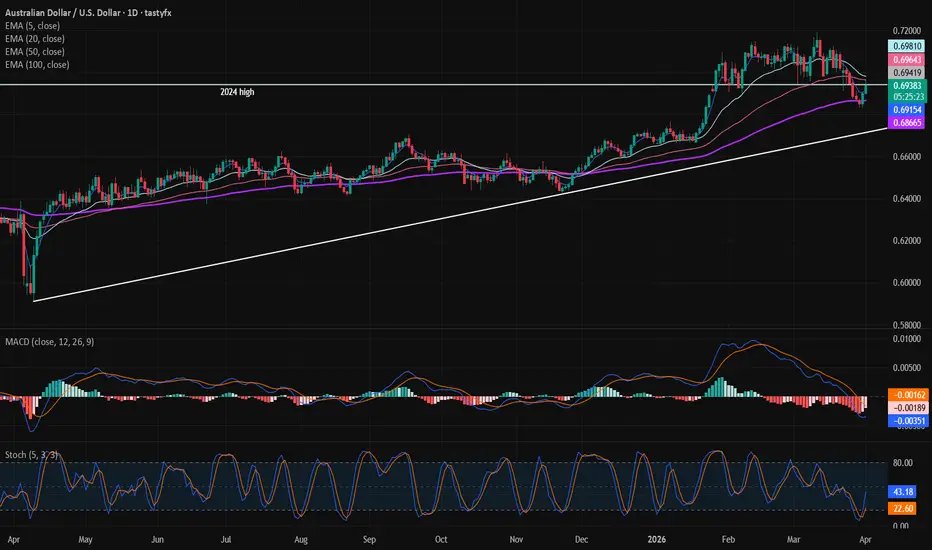
Aussie Climbs as Oil Drop Sparks Risk RallyAUD/USD was up by more than 0.6% on Wednesday as the Australian Dollar found support in a more constructive global backdrop and a pause in the recent surge in oil prices tied to the Iran conflict. While energy markets remain elevated, the absence of a fresh leg higher has helped stabilize inflation expectations, offering some relief to risk-sensitive currencies like the Aussie. Policymakers remain focused on whether energy-driven price pressures will prove persistent, even as growth risks linger. With the Federal Reserve maintaining a data-dependent stance and U.S. yields easing at the margin, AUD/USD’s move higher reflects a recalibration of rate expectations as markets weigh how both central banks respond to the same oil-driven shock.
In the above chart, AUD/USD are attempting to ward off a top. The 2024 high at 0.6943 served as support for a chunk of January through March, but deterioration in recent days saw the bullish technical structure damaged. AUD/USD has now rallied off of the daily 100-EMA (exponential moving average), attempting to trade back through its 2024 high. Momentum is starting to turn the corner, with Slow Stochastics leaving oversold territory while MACD needs just one more green daily close to issue a buy signal (albeit below its signal line). Failure at 0.6943, however, would see AUD/USD fade below its daily 20- and 50-EMAs, which would reinforce the topping perspective. Transocean May Be Trending HigherTransocean began the year with a steady rally. Now, after a brief period of consolidation, some traders may expect further gains.
The first pattern on today’s chart is the move to new 52-week highs in late January. The oil-services company advanced steadily after the breakout with only shallow dips. That may suggest buyers outnumber sellers.
Second, RIG pulled back to its rising 21-day exponential moving average (EMA) in March. It bounced twice at that rising EMA, resulting in higher lows. That may confirm it’s trending higher.
Third, the 8-day EMA has remained above the 21-day EMA. That’s also potentially bullish.
Finally, consider the weekly close of $6.54 on February 13. RIG spent more than a month below that level but cleared it last week. Prices are now trying to hold it. Has old resistance has become new support?
TradeStation has, for decades, advanced the trading industry, providing access to stocks, options and futures. If you're born to trade, we could be for you. Learn more here about TradingView’s Broker of the Year!
Past performance, whether actual or indicated by historical tests of strategies, is no guarantee of future performance or success. There is a possibility that you may sustain a loss equal to or greater than your entire investment regardless of which asset class you trade (equities, options or futures); therefore, you should not invest or risk money that you cannot afford to lose. Online trading is not suitable for all investors. View the document titled Characteristics and Risks of Standardized Options at www.TradeStation.com . Before trading any asset class, customers must read the relevant risk disclosure statements on www.TradeStation.com . System access and trade placement and execution may be delayed or fail due to market volatility and volume, quote delays, system and software errors, Internet traffic, outages and other factors.
Securities and futures trading is offered to self-directed customers by TradeStation Securities, Inc., a broker-dealer registered with the Securities and Exchange Commission and a futures commission merchant licensed with the Commodity Futures Trading Commission). TradeStation Securities is a member of the Financial Industry Regulatory Authority, the National Futures Association, and a number of exchanges.
TradeStation Securities, Inc. and TradeStation Technologies, Inc. are each wholly owned subsidiaries of TradeStation Group, Inc., both operating, and providing products and services, under the TradeStation brand and trademark. When applying for, or purchasing, accounts, subscriptions, products and services, it is important that you know which company you will be dealing with. Visit www.TradeStation.com for further important information explaining what this means. Long 
Silver surge stalls again at 100DMASilver has been hanging tough over the past week in what’s been a tricky macro environment for risk assets, managing to hold above the low struck on March 23. The bounce from that support zone, comprising the April 2025 uptrend and the February 6 low of $64.10, is starting to look like a base has formed, a view enhanced by the break of the late January downtrend seen on Tuesday.
However, while that helps build confidence that the bearish structure is weakening, especially with the price managing to print a marginal higher high today, it’s obvious the bulls face a high hurdle near-term: the 100DMA. We’ve seen multiple failures at this level recently, including last week, with the price now wedged beneath it again.
Its proximity presents a decent entry point for trades depending on how the price interacts with it. A sustained break above the level would allow for longs to be set with a tight stop beneath for protection. Alternatively, continued failures to reclaim it would allow for shorts to be set with a stop above.
Levels overhead to consider for longs include $78, which has acted as both support and resistance this year, along with the 50DMA, the March 10 high of $90.50, and resistance at $96. On the downside, $72 capped gains over the past week prior to the latest breakout, so it needs to be on the radar, with $68 another level where bulls were active over the second half of March. With the August 2025 uptrend and horizontal support at $64.10 not far below, that zone looks an attractive target area for shorts or an entry level for longs.
Like the price action, the message from the oscillators is that bears are losing their grip. RSI (14) has been trending higher and is nearing the neutral 50 level, while MACD has crossed above the signal line from below, albeit still in negative territory. The combined take is that downside momentum is fading, leaving risks more evenly balanced.
Good luck!
DS Long