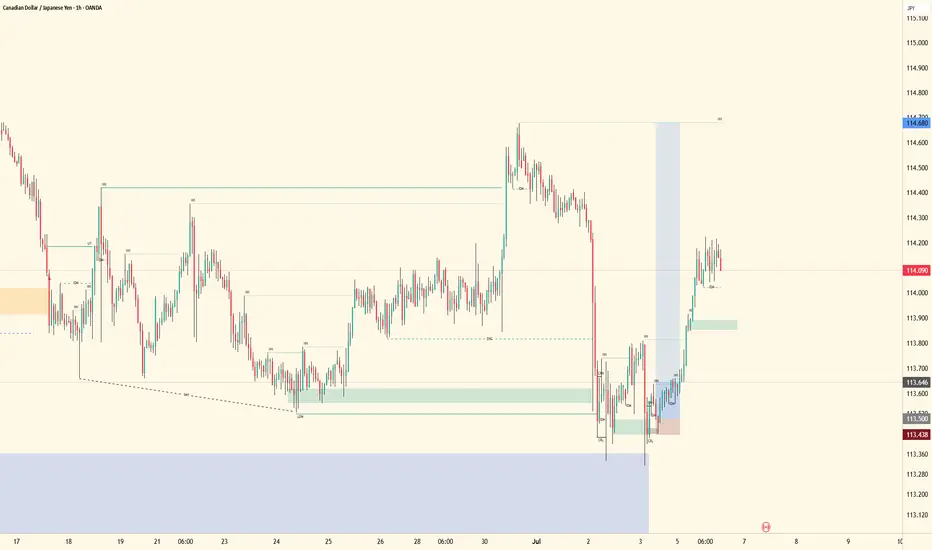
CADJPY - Higher Time Frame Bullish ContinuationThe higher time frame remains bullish, confirmed through top-down structure analysis.
Price has already broken key higher time frame levels, creating a displacement away from prior highs. From there, mid-term liquidity was taken as price engineered internal inducement and delivered into the last Point of Interest within the range, reacting within the auction area.
This move also swept higher time frame inducement levels and mitigated the higher time frame bullish order block (primarily through wick reaction rather than full acceptance). This suggests liquidity was taken, but bullish intent remains intact.
From a mid-term perspective, price has now shown lower time frame trend change. Minor structural breaks have occurred, forming a new high and shifting momentum back in favor of buyers.
On the lower time frame, price continued to engineer liquidity within the bullish leg, rebalance inefficiencies, and mitigate the most recent auction zone within the green range. The lows delivered a clean sweep, aligning with the liquidity model and supporting the bullish continuation thesis.
From here, price is now targeting lower time frame highs. If those levels are taken, I will continue to follow momentum in line with the existing higher time frame trend.
If price invalidates this structure, I will reassess based on the next liquidity event and re-map accordingly. No bias—only reaction to data.
Overall target remains unchanged: higher time frame and mid-term highs.
Patience is key. Track structure, follow liquidity, and let price confirm continuation before expansion.
Simple Zigzag Toward the Completion of the Corrective CycleBitcoin (BTC/USD) – Daily Chart
Aggressive Scenario: Simple Zigzag Toward the Completion of the Corrective Cycle
The aggressive scenario continues to favor the development of a Simple Zigzag (A-B-C) correction. If this structure unfolds as expected, Bitcoin could decline toward the $40,000 region before the larger corrective cycle reaches completion.
As illustrated on the chart, Wave A has already completed as a clear five-wave impulse, satisfying one of the defining characteristics of a Zigzag correction. Following that decline, Wave B developed as a Classic Zigzag, and the most recent selloff is currently interpreted as Wave (1) of Wave C.
If this wave count remains valid, the current advance is expected to unfold as Wave (2) in the form of any valid three-wave corrective structure. Once that correction is complete, the market could resume its decline in Wave (3), followed by a corrective Wave (4) before a final decline in Wave (5) completes Wave C and, consequently, the entire Simple Zigzag correction.
Under this scenario, the completion of the correction would also mark the end of the current eight-wave Elliott Wave cycle, potentially paving the way for the beginning of a new impulsive cycle. If confirmed, this new cycle could carry Bitcoin beyond its previous all-time high and establish a new historical high.
However, if the current rally extends beyond the expected corrective structure, there remains the possibility that the correction evolves into a Triple Zigzag. While this alternative still belongs to the aggressive outlook, the Simple Zigzag currently remains the preferred scenario, as it provides the most direct interpretation while remaining fully consistent with the present wave structure.
This analysis presents a structural Elliott Wave scenario, not a price prediction. The wave count remains valid as long as the Elliott Wave Principle and the current market structure continue to support it. Should the structure change, the wave count will be revised accordingly.
— Mr. Nobody
Independent Elliott Wave Principle Researcher
"Patterns whisper. I listen." 📊🎧
Bitcoin
Feb 5
Bitcoin Daily – Wave I Completed, Corrective Phase in Progress
Bitcoin
Feb 5
Bitcoin 4H – Final Leg of the Bearish Impulse (Wave 5 of 5)
Bitcoin
4 days ago
Bitcoin 4H | Is the First Bearish Leg Complete.
 Short
Short
Long 
 Short
Short
XAU/USD 08 July 2026 Intraday AnalysisH4 Analysis:
-> Swing: Bullish.
-> Internal: Bearish.
Bias and analysis to remain the same as analysis dated 30 June 2026.
Price did not print bullish CHoCH to indicate bullish pullback phase initiation. Price instead printed a new low followed by a bullish CHoCH
Price is currently trading within and established internal range, however, I will continue to monitor price with respect to depth of pullback.
Intraday expectation:
Price to trade up to either premium of internal 50% EQ, or H4 demand zone before targeting weak internal low, currently priced at 3,942.100.
Note:
Gold remains volatile as tensions between the US, Israel, and Iran keep safe‑haven demand elevated.
Markets are reacting quickly to every headline, while uncertainty around the Fed’s easing path and shifting U.S. policy under President Trump, especially tariffs continues to fuel choppy price action.
For newer traders, the key is simple, stay flexible and manage risk carefully, as fast spikes and sudden reversals are a normal part of the current XAU/USD environment.
H4 Chart:
M15 Analysis:
-> Swing: Bearish.
-> Internal: Bullish.
Analysis and bias remains the same as analysis dated 06 July 2026.
Price previously did not print a bearish CHoCH and continued bullish.
Price subsequently printed a bearish CHoCH to indicate bearish pullback phase initiation.
Price is currently trading within an established internal range, however, I shall monitor price with respect to depth of pullback.
Intraday expectation:
Price to trade down to either discount of internal 50% EQ, or M15 supply zone before targeting weak internal high, priced at 4,195.510. Price may potentially print higher to bring CHoCH positioning closer to recent price action
Note:
Gold remains highly reactive on M15 as geopolitical risk continues to drive quick, headline‑led moves.
The tension between the US, Israel, and Iran is keeping safe‑haven demand elevated, with markets still sensitive to any sign of escalation.
At the same time, shifting US tariff policy under President Trump is adding extra uncertainty, fuelling sharp intraday swings and increasing the likelihood of sudden sentiment flips. Liquidity pockets and whipsaws remain common, making disciplined risk management essential.
Gold’s geopolitical premium is still firmly in place, and until tensions ease, short‑term volatility is likely to stay front‑loaded.
M15 Chart: AUDCAD | Walking Through My Trade Process: From Bias To EntryFirst video breakdown, so the quality and delivery won’t be perfect, but the goal is to show the process and give a walkthrough of how I’m approaching this setup.
In this breakdown, I’m showing how I go from higher timeframe analysis down into lower timeframe confirmation and what I’m looking for before taking an entry.
Starting with the bigger picture, AUDCAD is showing bullish structure with price continuing to respect higher highs and higher lows. From there, I’m tracking how price interacts with key liquidity areas, inducement levels, and potential accumulation zones.
As price developed, we saw liquidity being taken, engineered, and eventually a return back into the area of interest. After mitigation and confirmation, I waited for lower timeframe structure to shift before looking for continuation.
The focus was not on forcing a trade, but allowing price to build the story:
● liquidity being created and taken
● structure shifting
● order flow being respected
● displacement confirming intent
This video is simply a walkthrough of my thought process and the steps I’m looking for before entering a position.
Still improving the videos and delivery over time, but the mission stays the same:
Patience is key. Tracking remains the edge. 📈
Long 
 Long
Long
 Short
Short
 Education

MMA BTCUSDT.P 1H TF☀️ MMA
BTC remains in a bullish market structure on the 1H timeframe, producing consistent higher highs and higher lows since reclaiming 61,886.7. The recent pullback created an internal bearish MSB but has not invalidated the overall bullish trend. Buyers responded aggressively from the 61,652–62,467 bullish order block, which is supported by a strong displacement candle, an accompanying fair value gap, and elevated volume. While price may only retrace into the FVG without reaching the full order block, the overall structure remains constructive. The 21 and 50 EMAs continue to slope upward and are providing dynamic support. Price is now approaching previous equal highs around 64,000–64,250, where buy-side liquidity is likely resting. A sweep of these highs followed by rejection would favour a corrective pullback into the FVG or order block, while a decisive close above the liquidity zone would strengthen the case for bullish continuation. Volume generally supports the trend, although the latest breakout attempt has not shown stronger participation than prior impulses, suggesting buyers remain in control, but momentum should continue to be monitored. Long 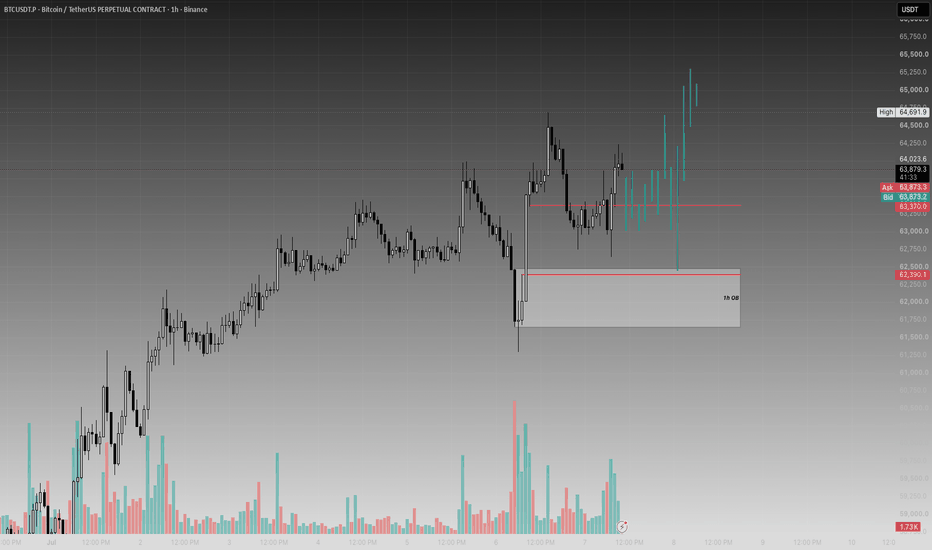
AAPL: The Death of Apple’s 2-Decade Empire Has a Date🚨 Macro Structural Exhaustion: When Price, Time, and Geometry Reach Their Final Convergence
━━━━━━━━━━━━━━━━━━━━━━━━━━━━━━━━━━
Markets do not enter historic declines because of news.
They enter them when a long-term structural cycle consumes its final unit of time.
━━━━━━━━━━━━━━━━━━━━━━━━━━━━━━━━━━
The weekly architecture reveals that Apple's historic expansion, initiated from the 2004 structural origin, has entered its terminal phase of maturity.
For more than two decades, every correction has remained imprisoned within a rigid geometric framework, allowing the market to compound into one of the greatest bullish expansions in modern financial history.
That process is now approaching its structural conclusion.
━━━━━━━━━━━━━━━━━━━━━━━━━━━━━━━━━━
Price has reached the upper terminal boundary of the long-term geometric channel.
At the very same location, the 261.8% Fibonacci Expansion completes its projected objective, while the Time Projections converge into the identical structural window.
These are not isolated signals.
They are independent structural systems reaching the same destination simultaneously.
When Price, Time, and Geometry expire together, the market no longer behaves like an expanding trend.
It begins to behave like a completed cycle.
━━━━━━━━━━━━━━━━━━━━━━━━━━━━━━━━━━
⏳ The Rigid Chronological Boundaries (Time Projections)
According to this structural model, the remaining lifespan of the ongoing expansion is becoming critically limited.
The countdown is no longer measured in price; it is measured in structural time:
━━━━━━━━━━━━━━━━━━━━━━━━━━━━━━━━━━
The High-Probability Trigger Zone (0.618 Time Projection):
Our primary calculations isolate August 17, 2026 as the strongest structural window where the macro reversal and heavy decline are mathematically poised to initiate.
━━━━━━━━━━━━━━━━━━━━━━━━━━━━━━━━━━
The Absolute Invalidation Ceiling (1.000 Time Projection):
The maximum permissible lifespan for this entire bullish cycle is chronologically bounded.
October 5, 2026 represents the absolute maximum time limit for wave development.
Beyond this coordinate, the expansion energy is completely terminated.
━━━━━━━━━━━━━━━━━━━━━━━━━━━━━━━━━━
If the current alignment completes as projected, the next macro phase may no longer resemble a conventional correction.
It may represent the beginning of a large-scale structural rebalancing capable of unwinding a substantial portion of the expansion built since 2004.
The market is no longer searching for higher prices.
It is approaching the point where the architecture of the entire cycle is tested.
━━━━━━━━━━━━━━━━━━━━━━━━━━━━━━━━━━
✍🏻 Mohsen Nirumand  Short
Short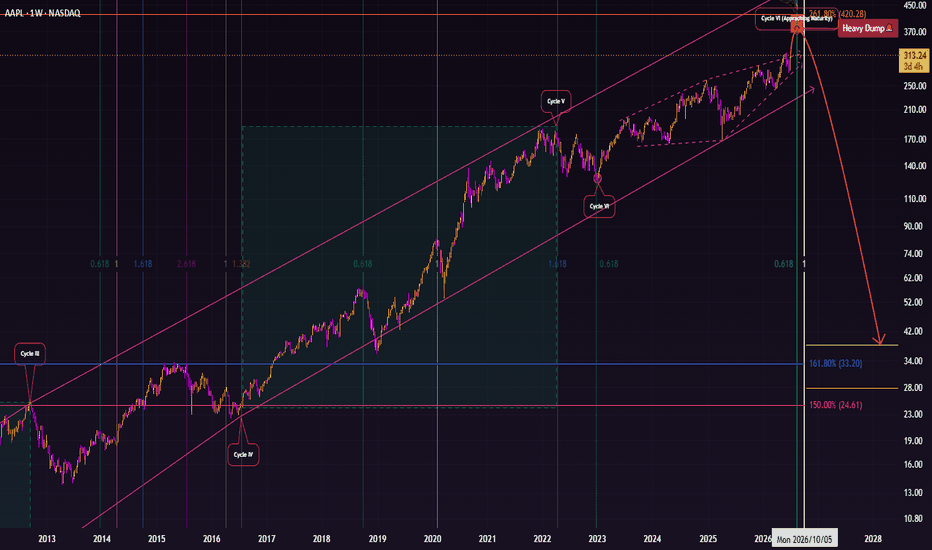
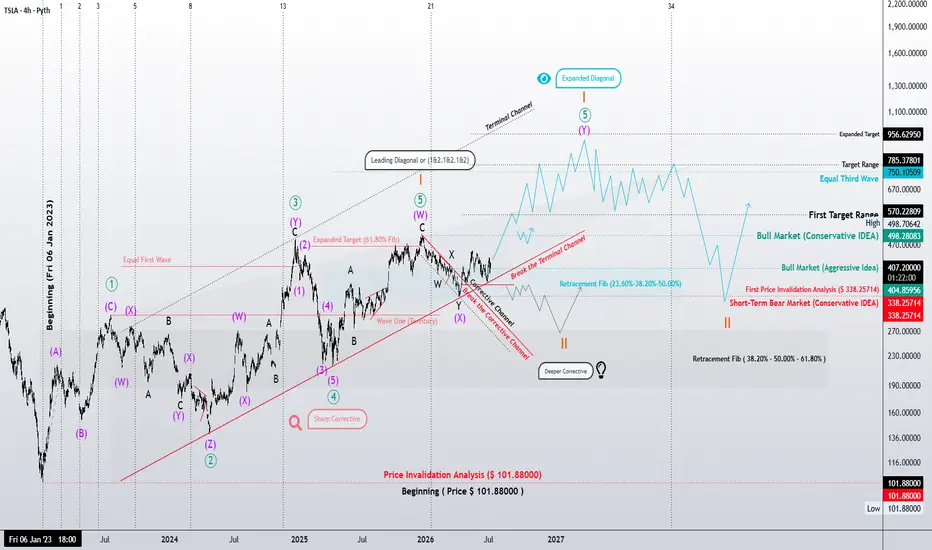
TSLA 4H: Extended Leading Diagonal or a Deeper Correction?
"Price is the consequence. Structure is the cause."
This four-hour structural analysis of Tesla (TSLA) examines the market through the principles of Elliott Wave Theory. Rather than forecasting price alone, the objective is to determine the market's current position within the larger wave structure and identify the most probable path forward.
Primary Thesis — Extended Leading Diagonal
The preferred interpretation views the current structure as a Leading Diagonal exhibiting structural extension, provided that the first structural invalidation level at $338.25714 remains intact.
Although "Extended Leading Diagonal" is not a formal Elliott Wave pattern, the current price development displays characteristics consistent with a diagonal extending beyond the proportions typically observed.
So far, the present advance has traveled only 61.8% of the preceding third wave, leaving room for additional structural expansion.
If this interpretation is correct, a confirmed breakout above $498.70642 could initiate a strong multi-swing advance, displaying momentum similar to an impulsive sequence while completing the terminal portion of the diagonal. A proportional correction would then be expected before the broader uptrend resumes.
Structural Targets
• First Target: $465.44267
• Primary Target: $570.22809
• Extended Targets: $750.10509 and $956.62950
Secondary Thesis — Conservative Development
The conservative interpretation assumes that the current Leading Diagonal has already completed, but the market still requires a more mature corrective phase before the next impulsive advance begins.
That correction could develop as:
Zigzag
Double or Triple Zigzag
Flat
or a more complex corrective combination.
According to Elliott Wave guidelines, corrections following a Leading Diagonal are often deeper and more time-consuming than the decline currently observed.
Only a clearly developing series of nested 1-2 sequences would significantly strengthen the case that the next higher-degree third wave has already begun.
Both scenarios remain structurally bullish over the long term. Their only difference lies in the depth, duration, and internal development of the current correction.
Structural Cycle
Under the preferred wave count, Tesla continues progressing toward the completion of a higher-degree eight-wave cycle, with the current roadmap projecting structural completion around March 2027, assuming Elliott Wave relationships remain valid.
Key Technical Levels
Bull Market Confirmation: $498.28083
Critical Structural Validation: $101.88
First Structural Invalidation: $338.25714
Structural Observation
An alternative interpretation remains under observation.
The current structure could eventually prove to be an Ending Diagonal completing Primary Wave (III), which would imply that a larger Primary Wave (IV) correction is still ahead.
At present, however, the available structural evidence continues to favor the Leading Diagonal interpretation. The alternative count remains part of ongoing Elliott Wave research, recognizing that structural interpretation evolves with price rather than personal conviction.
Markets rarely move in a straight line.
Structure provides the context. Price delivers the evidence.
Patterns whisper. I listen.
– Mr. Nobody 🎧📊
Elliott Wave Researcher
Gold Spot / U.S. Dollar
Feb 13, 2024
My view after two years (Sharp correction pattern)
BTC/USD HEADED LOWERThere exists a world where BTC/USD is headed lower targeting price imbalance between 23,000 and 46,000 a price range representing unmitigated demand zone.
The opposing and interactive forces of supply and demand keep the market in equilibrium. Excessive demand pushes price high that requires bearish correction to keep the market in balanced, the vice versa is true. Presently, using multi-time frame analysis(12M-D),BTC/USD is poised to push lower over the long term to correct market imbalance and contact the unmitigated demand before price rallying. In the interim, there exist a sell limit opportunity should price target the FVG at 69,240 price handle.
I use BTC/USD as an overall bearish-bullish indicator for the larger crypto market, with this analysis, there is a high probability crypto prices could push lower before the close of 2026, presenting shorting opportunities. Short 
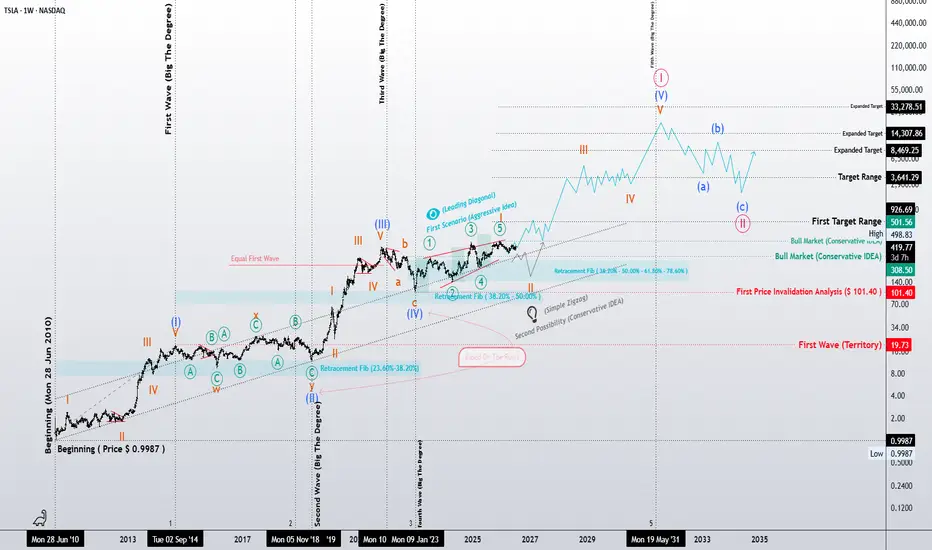
TSLA: A Structural Blueprint of the Grand Cycle
"Price is the consequence. Structure is the cause."
This analysis is not a simple price forecast. Rather, it is a structural study of Tesla's position within its Grand Cycle through the principles and guidelines of Elliott Wave Theory.
Since its 2010 low, Tesla has developed a sequence of impulsive and corrective waves, each forming part of a much larger market geometry. The objective of this study is to identify the market's current position within that hierarchy and explore the most probable paths ahead based on wave structure, Fibonacci relationships, and Elliott Wave principles.
Aggressive Scenario (Turquoise Path): A Developing Leading Diagonal
The primary interpretation assumes that Primary Wave (IV) has already completed and the market has begun constructing a Leading Diagonal, marking the first phase of a new higher-degree impulsive cycle.
Within Elliott Wave Theory, a Leading Diagonal typically emerges at the beginning of a new trend, when market sentiment remains uncertain and confidence has yet to fully return. Rather than signaling weakness, this structure often reflects the gradual transition from accumulation toward expansion.
The key question is therefore:
Has the current correction already fulfilled the structural requirements of a Leading Diagonal?
If the answer proves to be yes, Tesla may already have established the structural foundation for the next higher-degree advance, potentially leading into a powerful Primary Wave (III), which is often the strongest and most dynamic phase of an impulsive sequence.
Conservative Scenario (Blue Path): The Correction May Require Further Development
The conservative interpretation remains equally bullish over the long term but suggests that the current correction may not yet be structurally complete.
Under this scenario, the market could still require a more mature corrective formation, such as:
Zigzag
Flat
or a more complex corrective combination
Once that correction is completed—while respecting Elliott Wave rules and structural guidelines—the market would still be expected to follow the same long-term bullish path illustrated by the aggressive scenario.
In other words, the destination remains the same. The only difference lies in the maturity, depth, and internal structure of the current correction.
Key Structural Levels
Structural Invalidation Level: 101.40
First Wave Territory: 19.73
The long-term objectives presented in this study are not arbitrary price projections. They are derived from Fibonacci expansion relationships and the mathematical structure of Elliott Wave development.
Research Note
Alongside the two primary scenarios, an alternative wave count remains under continuous evaluation.
Under this alternative interpretation, the current diagonal could ultimately prove to be an Ending Diagonal, completing Primary Wave (III) rather than initiating a new impulsive cycle. Should that interpretation prevail, the market would still require a larger-degree Primary Wave (IV) correction before the next long-term advance begins.
At present, however, the available structural evidence continues to favor the Leading Diagonal interpretation. The Ending Diagonal remains a secondary research hypothesis, maintained not because it is currently preferred, but because Elliott Wave analysis requires every credible structural alternative to remain open until the market itself resolves the pattern.
My objective is not to defend a preferred wave count, but to continuously refine structural understanding through the observation of real market behavior.
Markets are often dominated by noise.
Structure reveals the logic behind price.
Patterns whisper. I listen.
– Mr. Nobody 🎧📊
Elliott Wave Researcher  Long
Long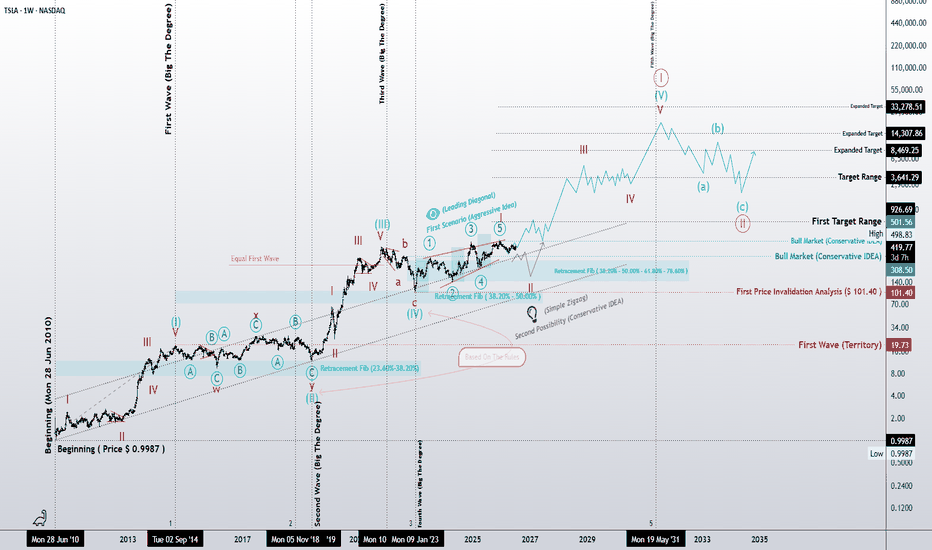
Long 

 Long
Long