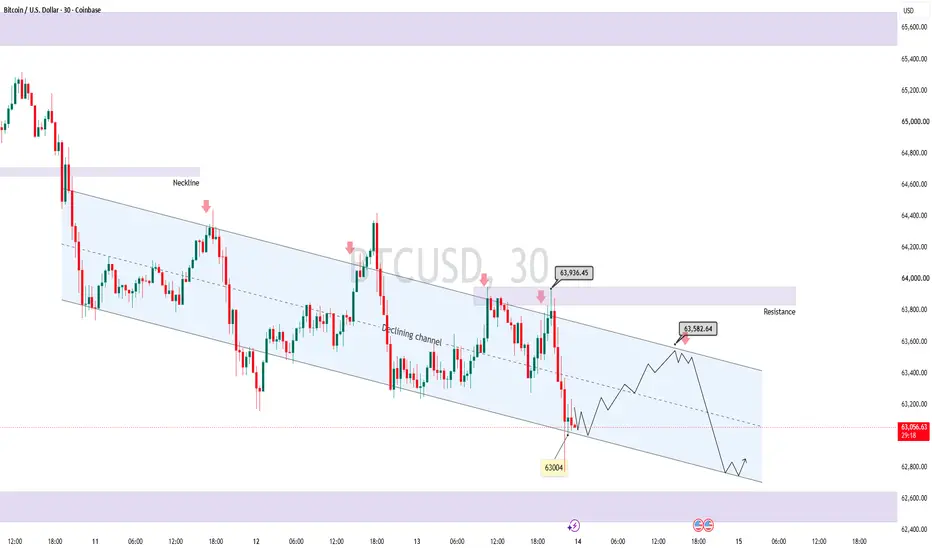
BTCUSDT: Downward momentum, Bearish channelBTCUSDT is trading around 63,520 USDT and continues to move within a bearish channel, indicating that sellers remain in control of the short-term structure.
Notably, the macroeconomic outlook has become less negative: the US PPI for July remained flat, causing the probability of a Fed rate hike in September to drop to around 32–35%.
On the 1-hour (H1) chart, the 63,800–64,200 USDT zone acts as strong resistance, converging with the EMA and the upper boundary of the bearish channel.
If BTC attempts to rebound but faces rejection at this level, I lean towards the scenario where the price pulls back to the 62,700 USDT zone.  Short
Short
BTCUSDT Short: Supply Holds — $62,700 Becomes the Key TargetHello traders! Here’s my technical outlook based on the current BTCUSDT (1H) chart structure. BTCUSDT previously traded inside a descending channel before breaking above the 64,500 Supply Zone. After forming a range, price was rejected near the upper boundary and returned below resistance, signaling renewed selling pressure.
Currently, BTCUSDT is trading below the 64,500 Supply Zone while holding above the 62,700 Demand Zone. The latest rejection and descending channel suggest that sellers may remain in control.
As long as BTCUSDT remains below the 64,500 Supply Zone and respects the descending channel, the bearish scenario remains valid. A continuation lower could push price toward the 62,700 Demand Zone (TP1). However, a breakout above 64,500 would weaken the bearish outlook and increase the risk of a move toward higher levels. Manage your risk! Short 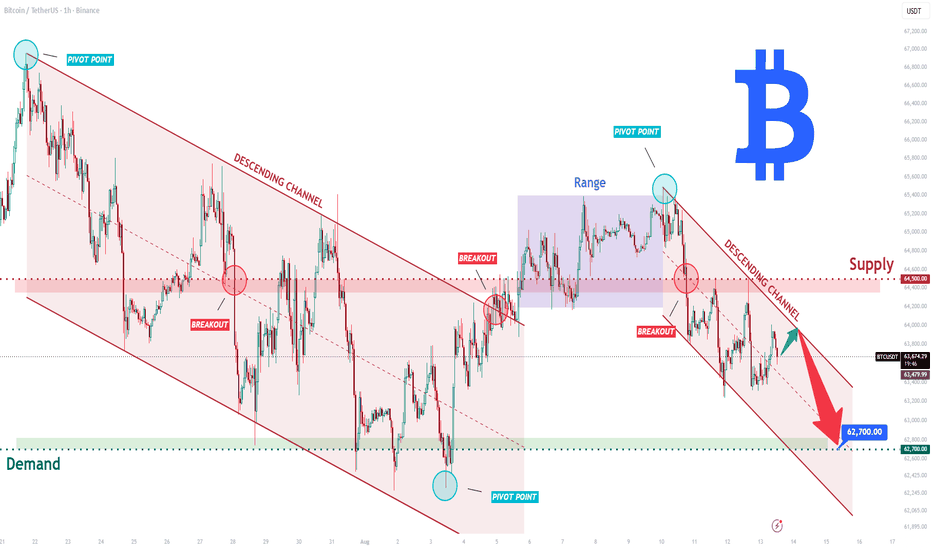
XAUUSD: Retest Scenario — $4,450 Resistance in FocusHello everyone, here is my breakdown of the current XAUUSD setup.
Market Analysis
XAUUSD previously traded inside a broad wedge before breaking above the resistance line and shifting bullish. After the breakout, price formed an upward channel and continued higher toward the 4,450 Resistance Zone.
Currently, XAUUSD is trading below the 4,450 Resistance Zone while holding above the 4,350 Support Zone and the rising channel support. The latest pullback appears to be a retest of support, keeping the bullish structure intact.
My Scenario & Strategy
As long as XAUUSD remains above the 4,350 Support Zone and respects the rising channel, the bullish scenario remains valid. A rebound from current levels could push price toward the 4,450 Resistance Zone (TP1).
However, a breakdown below 4,350 would weaken the bullish outlook and increase the risk of a deeper correction.
That’s the setup I’m tracking. Thank you for your attention, and always manage your risk.  Long
Long
BTCUSDT: Retest Support Can Opens the Path Toward 64,600$Hello everyone, here is my breakdown of the current BTCUSDT setup.
Market Analysis
BTCUSDT previously formed a Head and Shoulders pattern before recovering above the 62,700 Support Zone. Price then moved higher and recently broke above the descending triangle resistance line, signaling a potential bullish shift.
Currently, BTCUSDT is trading below the 64,600 Resistance Zone while holding above the 62,700 Support Zone and the rising trendline. The recent breakout suggests that buyers are attempting to regain control.
My Scenario & Strategy
As long as BTCUSDT remains above the 62,700 Support Zone and respects the rising trendline, the bullish scenario remains valid. A continuation higher could push price toward the 64,600 Resistance Zone (TP1).
However, if BTCUSDT breaks back below 62,700, the bullish outlook would weaken and increase the risk of a deeper correction.
That’s the setup I’m tracking. Thank you for your attention, and always manage your risk. Long 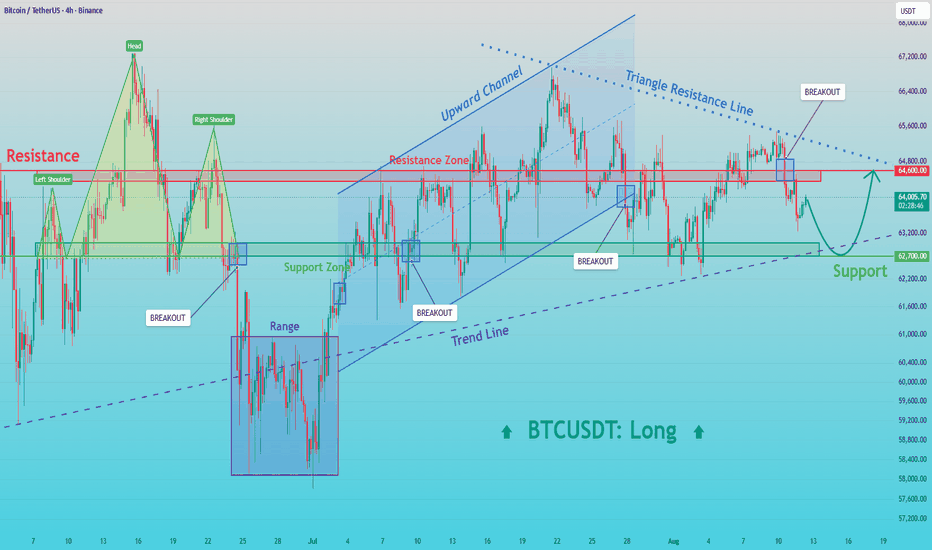
BTCUSDT Bearish Outlook: Rejection Could Drive Price to $62.7KHello traders! Here’s my technical outlook based on the current BTCUSDT (2H) chart structure. BTCUSDT previously traded inside a descending structure before recovering toward the 64,600 Resistance Zone. After forming a range near resistance, price faced rejection and moved lower, suggesting that sellers are regaining control. Currently, BTCUSDT is trading below the 64,600 Seller Zone while holding above the 62,700 Buyer Zone. The recent rejection and breakdown from the range suggest that bearish momentum may continue. As long as BTCUSDT remains below the 64,600 Seller Zone and respects the descending resistance line, the bearish scenario remains valid. A rejection from current levels could push price toward the 62,700 Buyer Zone (TP1). However, a breakout above 64,600 would weaken the bearish outlook. Please share this idea with your friends and click "Boost" 🚀 Short 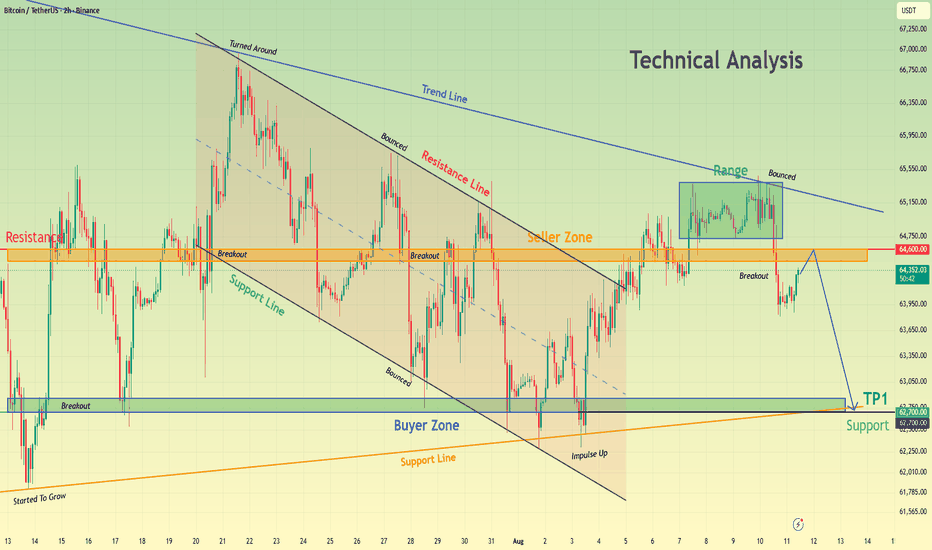
Long 
BITCOIN - A false breakout before a declineBINANCE:BTCUSDT.P closed within the 62,000–66,000 range. Liquidity zones have formed around the consolidation boundaries, but buyer weakness could potentially trigger a decline toward the areas of interest
There is no fundamental support in the market, while the geopolitical backdrop is exerting excessive pressure.
Technically, Bitcoin remains stagnant and trapped inside a sideways range that is developing within the broader global bearish trend. Simply put, the market is consolidating.
The reaction to support is weakening. However, before the decline continues, market makers may trigger a short squeeze toward the 65K resistance level. The area of interest is the liquidity zone around 62,300
Resistance levels: 64,500, 65,400
Support levels: 62,300, 61,900
A false breakout of the nearest resistance zone could shift the balance of power in favor of sellers and trigger a breakout from the triangle, potentially followed by downward distribution toward 62,000
Best regards,
R. Linda Short 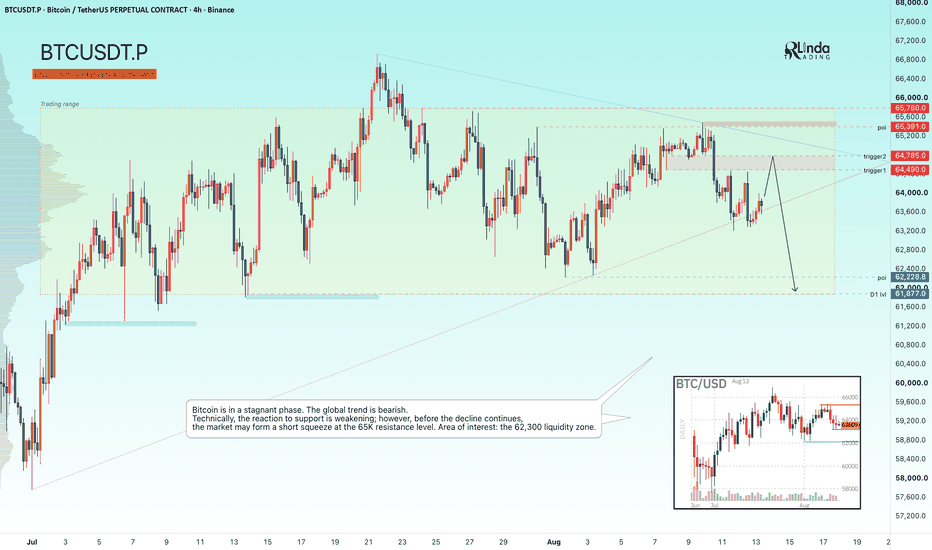
Short 
GOLD - The news could trigger a long squeezeICMARKETS:XAUUSD is consolidating within the 4355–4435 range, while the U.S. dollar remains largely stagnant ahead of the upcoming CPI data. Until the release, the market may remain trapped inside the current range while preparing for a potential liquidity manipulation
The U.S. Dollar Index is also consolidating as traders wait for the CPI report. Gold has stalled ahead of this key inflation data, and the initial reaction to CPI could be short-lived as geopolitical risks remain elevated.
A weaker-than-expected CPI could open the door to new highs, while hotter inflation data could trigger a corrective move. The market is waiting for a clear catalyst.
Bullish drivers: Weaker CPI, A weaker U.S. dollar, Lower expectations for further rate hikes, Geopolitical de-escalation
Bearish drivers: Hotter-than-expected CPI, Hawkish Fed rhetoric, A stronger U.S. dollar, Geopolitical escalation
Gold remains in a bullish phase, but news-driven volatility could create a liquidity sweep / long squeeze before the next directional move
Resistance levels: 4435, 4481
Support levels: 4356, 4313, 4302
Gold remains in a bullish phase. However, news-driven volatility could create a liquidity sweep / long squeeze before the next continuation move.
The key zones to watch are 4350 and 4313. A false breakdown of either level, followed by consolidation back above it, could become the technical catalyst for another bullish impulse.
Best regards,
R. Linda Long 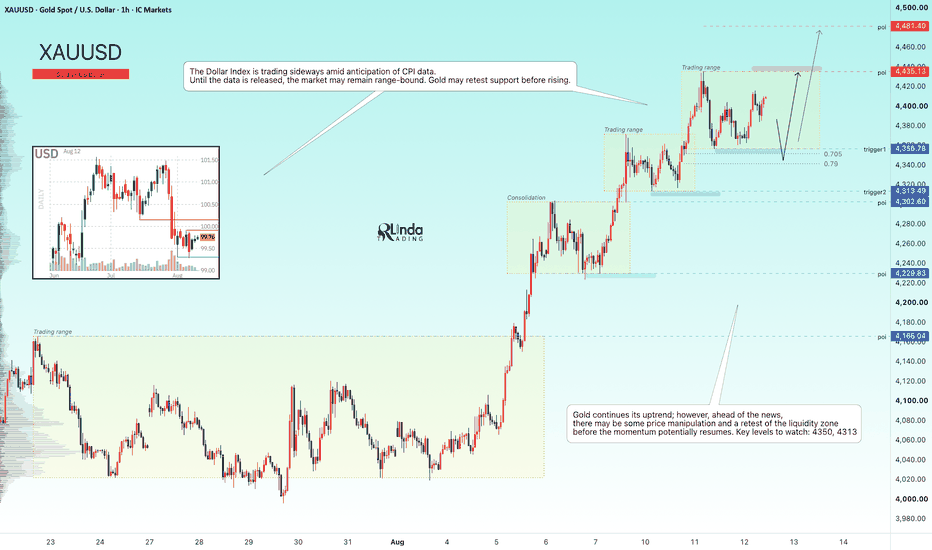
Gold Holds Above 4,370 Support — Upside Potential RemainsHello traders! Here’s my technical outlook based on the current XAUUSD (1H) chart structure. XAUUSD previously traded inside a descending structure before breaking above the resistance line and shifting into a bullish trend. Price then formed an ascending channel and continued higher toward the 4,450 Resistance Level, where sellers may defend the upside. Currently, XAUUSD is trading below the 4,450 Seller Zone while holding above the 4,370 Buyer Zone and the ascending support line. The latest consolidation suggests that buyers remain active, with a possible pullback before another move higher. As long as XAUUSD remains above the 4,370 Buyer Zone and respects the ascending support line, the bullish scenario remains valid. A rebound could push price toward the 4,450 Resistance Level (TP1). However, a break below 4,370 would weaken the bullish outlook. Please share this idea with your friends and click "Boost" 🚀 Long 
GOLD FINAL SPRINT — WATCH LAST PUSH BEFORE DISTRIBUTIONIs Gold truly continuing higher, or is this a final sprint to grab liquidity before entering a distribution phase?
📌 Market Development
What stands out most to me right now is how difficult the price structure has become to trade:
Shallow pullback → price pushed higher → SELL stops swept → deep retracement → LONG positions swept → another push higher.
Gold continues to form very shallow pullbacks, giving buyers almost no attractive entry points. At the same time, each push higher can sweep SELL positions, while the deeper retracements can then sweep LONG positions.
This makes the current phase extremely difficult for both BUY and SELL positions.
🎯 Main Trading Idea
My personal bias remains bullish. The H1 structure is still intact, so I am not prioritizing counter-trend SELL positions yet.
However, I also do not want to chase BUY positions at current levels.
I see Gold as being in a final sprint of the current uptrend. If momentum continues, price could move into an area where I will pay close attention to the possibility of distribution.
Key targets:
4,435 → 4,500 → 4,540–4,543 → 4,600
In particular, 4,500–4,600 will be the area where I watch for SELL-side reactions: absorption, breakout failure, a false breakout, or a structural reversal.
🔵 Preferred Trading Scenario
As long as the H1 structure remains intact, I still prefer to BUY with short-term targets and manage the trade quickly, rather than holding positions for too long.
I will wait for a long sweep into support → price to reclaim the level → structural confirmation → then consider a BUY.
Support:
4,356 | 4,320–4,340 | 4,240–4,260 | 4,180–4,200 | 4,150–4,160
Resistance / Targets:
4,435 | 4,500 | 4,540–4,543 | 4,600
🔴 SELL Scenario
I will not try to call the top simply because price has risen sharply.
SELL becomes more attractive when:
1. Price reaches 4,500–4,600 and clear distribution signals appear.
2. Or the H1 structure breaks, turning subsequent rallies into potential SELL opportunities.
Without these conditions, counter-trend SELL positions remain high risk.
📰 PPI – The Next Piece of the Puzzle
The U.S. July PPI will be released by the BLS on August 13 at 8:30 ET.
July CPI showed headline inflation easing from 3.5% to 3.4% YoY, while core CPI declined from 2.6% to 2.5%.
Therefore, if PPI comes in softer than expected, it could become the catalyst for Gold’s next push higher.
But I am not looking at whether PPI is simply good or bad.
More importantly, PPI needs to be connected with the broader macro picture: NFP → CPI → PPI → Fed policy expectations → USD/Yields → Gold.
⚠️ KEY IDEA
Do not chase BUYs. Do not try to call the top with SELLs.
At this stage, I am waiting for one of two setups:
Long sweep → reclaim → short-term BUY → manage the move.
Or 4,500–4,600 → distribution → H1 breakdown → shift to SELL.
My personal view: Gold is in a final sprint. The bullish structure has not broken, so SELL positions still require extreme caution. However, the closer price gets to 4,500–4,600, the greater the risk of distribution.
This is the zone I will watch most closely to see whether sellers finally step in or Gold continues to extend the uptrend.
Good day, traders! Long 
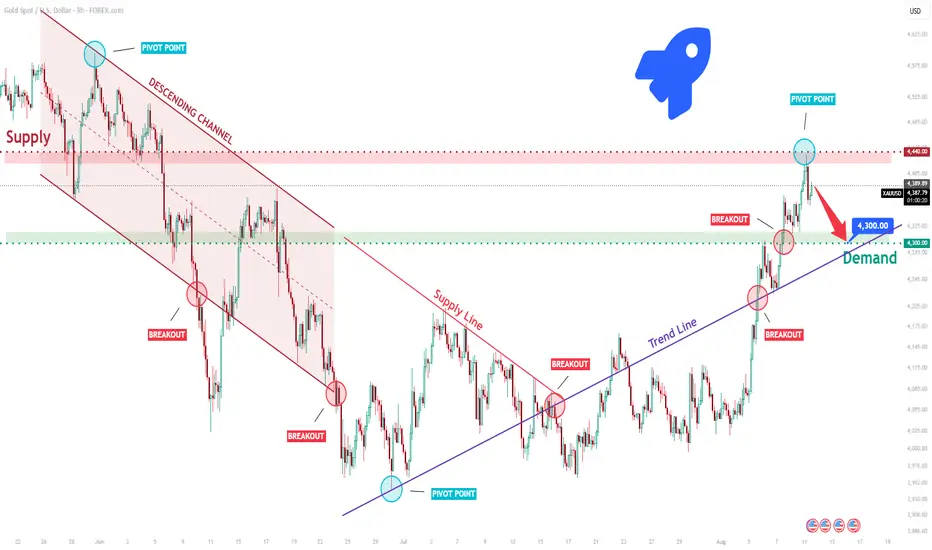
XAUUSD Short: Pullback Setup — $4,440 Rejection Favors SellersHello traders! Here’s my technical outlook based on the current XAUUSD (3H) chart structure. XAUUSD previously traded inside a descending channel before breaking above the upper boundary and shifting bullish. Price then rallied toward the 4,440 Supply Zone, where sellers are now showing signs of rejection.
Currently, XAUUSD is trading below the 4,440 Supply Zone while holding above the 4,300 Demand Zone and rising trend line. The rejection from resistance creates a potential short-term bearish setup.
As long as XAUUSD remains below the 4,440 Supply Zone, the bearish correction scenario remains valid. A rejection from current levels could push price toward the 4,300 Demand Zone (TP1). However, a breakout and close above 4,440 would weaken the bearish outlook and increase the risk of further upside. Manage your risk! Short 
XAUUSD: Bullish Structure Favors a Move Toward $4,430Hello everyone, here is my breakdown of the current XAUUSD setup.
Market Analysis
XAUUSD previously traded inside a broad descending channel before forming a strong base near the lower boundary. After several breakout attempts, price successfully broke above the channel resistance and reclaimed the 4,290 Support Zone, confirming a bullish shift in market structure.
Currently, XAUUSD is trading above the 4,290 Support Zone while remaining below the 4,430 Resistance Zone. The recent breakout from the consolidation range and the ascending trendline suggests that buyers remain in control despite the short-term pullback.
My Scenario & Strategy
As long as XAUUSD holds above the 4,290 Support Zone and respects the rising trendline, the bullish scenario remains valid. A successful retest of support could trigger another upward move toward the 4,430 Resistance Zone (TP1).
However, a breakdown below the 4,290 Support Zone would weaken the bullish outlook and increase the risk of a deeper correction.
That’s the setup I’m tracking. Thank you for your attention, and always manage your risk. Long 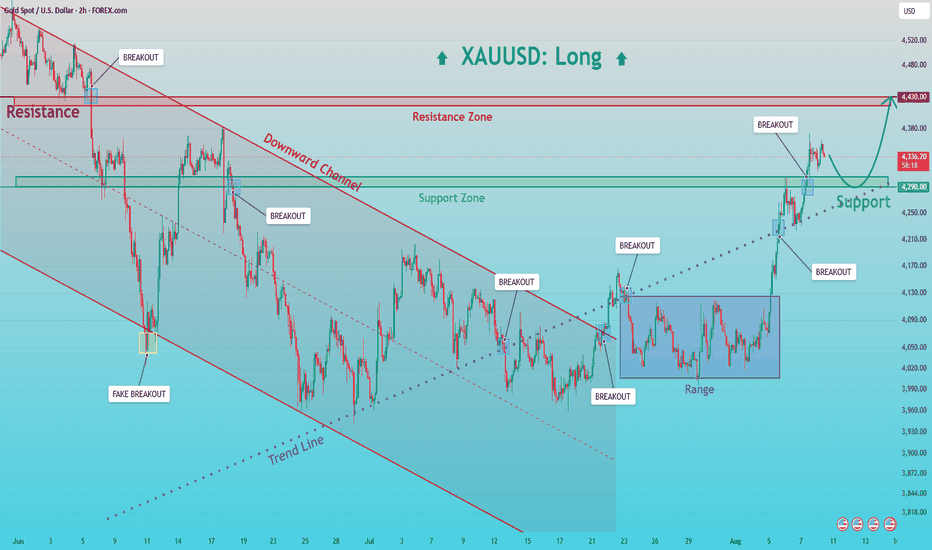
BTCUSDT: Sellers Step In — 63,800 Support Zone Becomes TP1Hello everyone, here is my breakdown of the current BTCUSDT setup.
Market Analysis
BTCUSDT previously traded inside a broad range before breaking higher and entering a descending channel. Price has repeatedly faced rejection near the 65,400 Resistance Zone, while the 63,800 Support Zone continues to act as a key downside level.
Currently, BTCUSDT is trading below the 65,400 Resistance Zone while holding above the 63,800 Support Zone. The latest rejection near resistance suggests that sellers are attempting to regain control.
My Scenario & Strategy
As long as BTCUSDT remains below the 65,400 Resistance Zone and respects the descending channel, the bearish scenario remains valid. A rejection from current levels could push price toward the 63,800 Support Zone (TP1).
However, a breakout above the 65,400 Resistance Zone would weaken the bearish outlook and increase the risk of a move toward higher levels.
That’s the setup I’m tracking. Thank you for your attention, and always manage your risk. Short 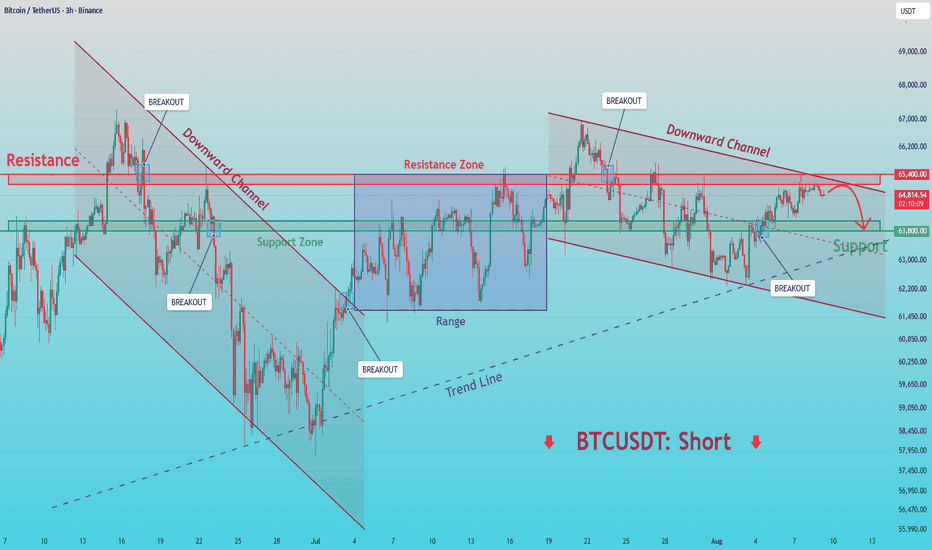
 Short
Short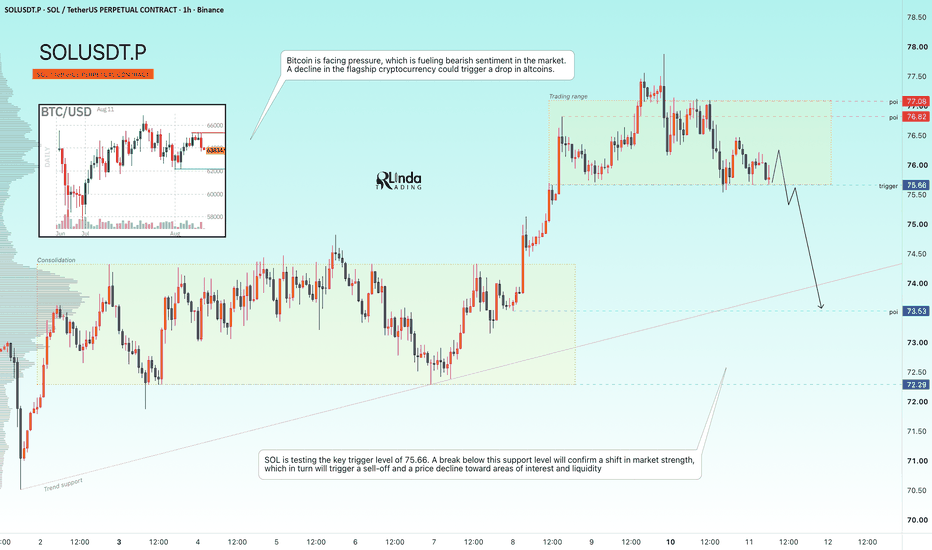
 Short
Short
Mid-Term Bitcoin Update: Bearish Momentum, Key Supports, and RevYou are looking at the historical weekly chart of Bitcoin .
After touching the ceiling of the historical channel (green), Bitcoin entered a correction and price decline. Its most important support was the floor of the ascending channel (yellow), which it lost. For this reason, its price decline gained more momentum.
Currently, it is declining inside the pink descending channel until one of these two scenarios happens:
It reaches the midline of the historical channel (around $38k to $40k) within this pink channel.
It will only attack the ceiling of the historical channel again when the ceiling of the current descending channel (pink) breaks upwards, and of course, it also faces the tough resistance of the weekly Ichimoku cloud ahead.
Therefore, in the first step, smart money will only enter with a breakout of the pink channel ceiling, with the initial target being the floor of the weekly Ichimoku cloud.
So for now, it is moving inside the pink channel towards the midline of the historical channel in the medium term. Short 
Bitcoin Breaks Descending Channel: Is $66,000 the Next Target?Bitcoin ( BINANCE:BTCUSDT ) has successfully broken above the Descending Channel and the key trading level of $64,000.
Over the past 24 hours, BTC has been fluctuating inside a small Ascending Channel as traders remain uncertain about the next major direction.
Can Bitcoin maintain its bullish structure and break above the Resistance Zone?
Technical Analysis
Bitcoin’s choppy price action reflects market indecision about whether the current bullish trend can continue.
However, the breakout above the Descending Channel and $64,000 supports the bullish scenario as long as the price remains above the Ascending Channel support line.
💡 Educational Note: A small Ascending Channel after a major breakout can represent a continuation structure, but a breakdown below its lower trendline may signal weakening bullish momentum.
I expect Bitcoin to continue moving higher, break above the Resistance Zone, and make another attempt to test the Resistance Lines.
Trade Setup
First Take Profit(TP): $65,930
Second Take Profit(TP): $66,460
Stop Loss(SL): $63,480
Which level do you think Bitcoin will reach first?
🟢 $66,460
🔴 $63,480
📌 Bitcoin Analysis(BTCUSDT), 1-hour time frame.
🛑 Always use proper risk management and set a Stop Loss(SL) for every position.
🚀 If this analysis helps your trading plan, a BOOST would help more traders discover it. Long 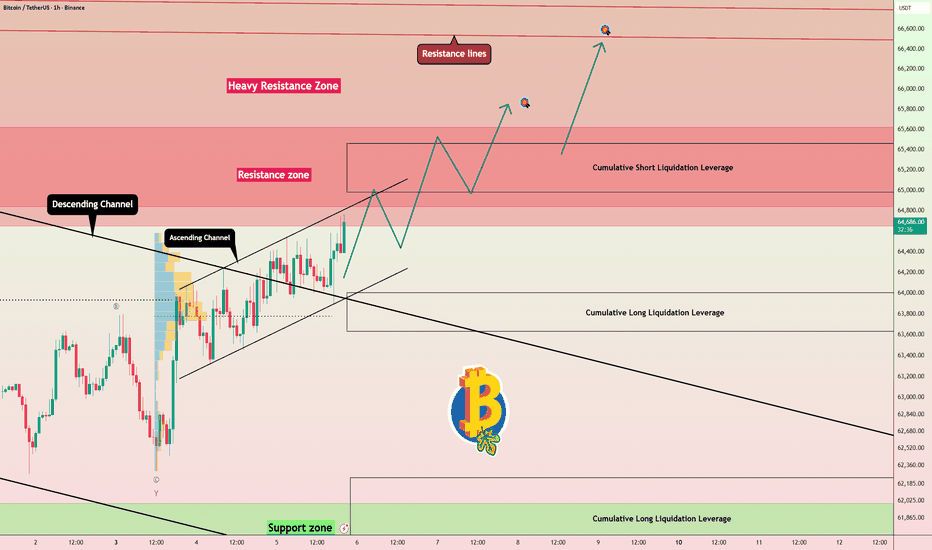
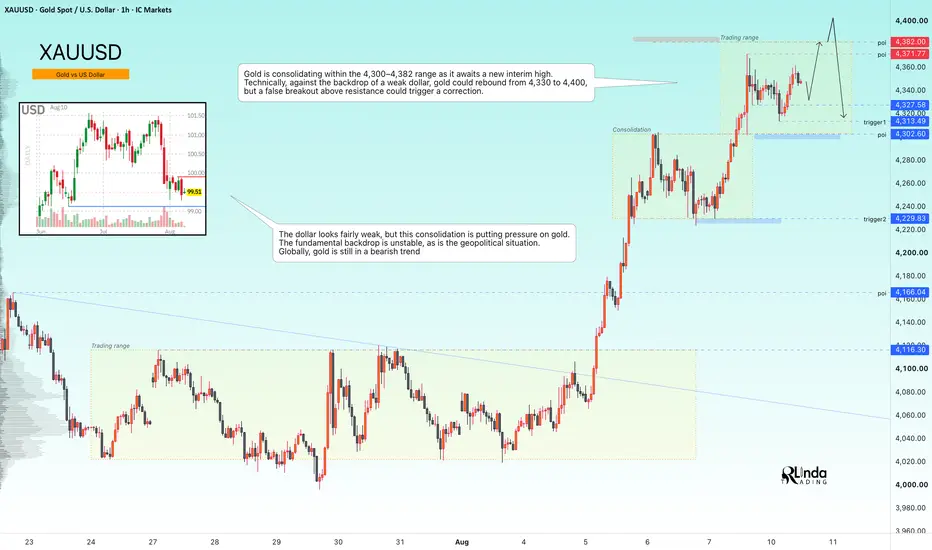
GOLD - Retest of 4400. Waiting for a false breakout ICMARKETS:XAUUSD is showing local bullish momentum, but price is approaching a major resistance zone at 4382–4400. At the same time, the U.S. dollar remains weak, although its current consolidation continues to create pressure across the markets
The fundamental backdrop remains unstable. Geopolitical risks continue to support the dollar, while expectations for further Fed rate hikes have weakened. Against this mixed backdrop, gold remains within a broader bearish trend.
Gold is consolidating inside the 4300–4382 range while preparing for a potential retest of the recent high. Technically, continued dollar weakness could allow gold to rebound from 4330 toward 4400. However, profit-taking around 4380–4400, followed by a false breakout, could trigger a reversal.
Bullish drivers: Weaker-than-expected inflation data, Continued U.S. dollar weakness, Lower rate expectations
Bearish drivers: U.S. dollar strengthening, Rising oil prices and inflation expectations, Profit-taking ahead of the CPI report
Resistance levels: 4371, 4382, 4400
Support levels: 4327, 4313, 4302
A short squeeze through the resistance zone followed by a bearish reversal pattern could trigger a pullback or even reverse the current local bullish momentum.
However, an unexpected fundamental catalyst or a sustained close above 4400 could invalidate the bearish setup and open the way toward 4450–4475.
Best regards,
R. Linda Short