XAUUSD 15M: Catching the Gold Rally with Ryan-Trend PulseGold provided a strong bullish opportunity after breaking above the 200 EMA, followed by a powerful upward move. This setup demonstrates how Ryan-Trend Pulse can help identify trend-following entries with predefined trade levels.
📊 1. Identify the Trend — 200 EMA
Price moved above the 200 EMA, shifting the market bias toward bullish momentum. Instead of entering immediately, we waited for confirmation from Ryan-Trend Pulse.
🟢 2. Ryan-Trend Pulse Entry
The indicator provided a long setup
Pitchforks
HOW-TO: How to use the RealSwing Indicator
In this HowTo Video I show you
1. What the script does:
2. How it works
3. Why it is original
4. How to use it
5. Limitations and shortcomings
I also give you the formula to draw the RealSwings by hand.
Please - This Indicator is a tool, NOT a money-making algo or magic bowl.
It's main prupose is to help you identify, what I call RealSwings. Because the Zig-Zag Indicator needs adjustment for every market. The RealSwing Indicator does not - although you can if you want.
I have imp
EURUSD 15M: From Uptrend to Downtrend with Ryan-Trend PulseEURUSD provided an example of market transition from an uptrend to a downtrend , creating profitable opportunities in both directions using the same strategy.
The key is not to predict the reversal — it's to wait for the 200 EMA breakout and Ryan-Trend Pulse confirmation .
📈 The Strategy
1. 200 EMA — Determine Market Direction
The 200 EMA acts as the primary trend filter:
🟢 Long: Price breaks above the 200 EMA
🔴 Short: Price breaks below the 200 EMA
2. Ryan-Trend Pulse — Confirm the
$BTC BULLS ARE IN CONTROL.BULLS ARE IN CONTROL.
CRYPTOCAP:BTC Closes the Week above the May high, 50SMA, 50EMA, STH 90EMA and the .382 Fib
IMO THE LOW IS IN.
I still very much expect a large correction around Midterms tho.
Without me even knowing it at the time, my ₿itcoin cycle analysis from ~2.5 years ago points to the actual day of the midterms Nov. 3rd as the low of that correction.
The simulation is predicting Republicans will lose, and markets will puke from fear followed by a sharp rally, similar to how we
Amazon ($AMZN) Daily: Corrective Pullback ApproachesAmazon ( NASDAQ:AMZN ) Daily: Corrective Pullback Approaches Crucial 200-EMA & 226 Support Confluence for Bullish Reversal
### 🇺🇸 Amazon.com, Inc. ( NASDAQ:AMZN ) Daily Technical Matrix (Ref: AMZN_2026-09-16_09-30-33.png)
We are issuing an updated Daily (1D) structural study for Amazon.com, Inc. ( NASDAQ:AMZN / NASDAQ). Following a strong rally that reached macro highs near the 286.58 horizontal ceiling, price action has entered a corrective phase. The stock is currently descending toward a hi
Elliott wave analysis of SPXDaily candles with repeated lower highs and lower lows since ATH on 13 August 2026.
With today's low, which broke high of 15 June, impulse wave of lower degree has been invalidated (red count).
Ending diagonal wave (5) of ((5)) remains in play above support of 7433.65.
Wave (1) > (3) > (5), price should not exceed 8151.54. For price to tag median line, looking for new highs before ~ midterm elections (3 November 2026).
3-4:1 reward/risk for long position above 7433.64.
BE: Bullish Breakout Above the 50-Day and 200-Day EMAsBloom Energy closed at $275.75 on September 11, 2026, confirming a strong bullish structure on the daily chart.
The stock is trading approximately 18.2% above its 50-day EMA at $233.26 and 39.9% above its 200-day EMA at $197.07. The 50-day EMA remains above the 200-day EMA, while both moving averages support a positive medium-term trend.
BE has also broken above its descending trendline. The latest session ended close to its daily high of $277.28, gaining 6.68% on volume of 13.63 million share
ISRG at a Major Weekly Decision Zone Below the 50 and 200 EMAsISRG is testing a major weekly zone around $355–$395 after a significant correction from its all-time highs.
The highlighted rectangle marks an important structural area. It acted as resistance in 2021–2022 before becoming support during the 2024 breakout. The recent rebound shows that buyers are reacting, but a bullish reversal is not confirmed yet.
Price remains below both the blue 50-week EMA and the orange 200-week EMA. The 50-week EMA is declining, while the 200-week EMA is still acting a
Elliott wave analysis for US500This count has wave (4) of ((5)) complete, wave (5) of ((5)) in progress.
Wave (1) overlaps with wave (4), so this count considers wave ((5)) an ending diagonal.
Wave (5) needs to be shorter than wave (3), so count is valid with wave (5) finish below 8169.2. For wave (5) to be valid and tag median line, top should form before end of October 2026 (mid-November if viewed on daily timeframe).
This week's low could go lower next week, and this count would still be valid. Wave (4) just needs to fi
S&P 500 ($SPX) 4H: Price Action Retests Crucial 7,576S&P 500 ( SPCFD:SPX ) 4H: Price Action Retests Crucial 7,576 Support Baseline at Make-or-Break Wedge Confluence
### 🇺🇸 S&P 500 Index ( SPCFD:SPX / SPCFD) 4-Hour (4H) Technical Matrix (Ref: SPX_2026-09-11_08-41-26.png)
We are issuing an intraday 4-Hour (4H) technical update for the S&P 500 Index ( SPCFD:SPX / SPCFD). Following a corrective move off the recent macro high, price action has pulled back to test a key structural decision node, compressing directly along the lower boundary of its lo
EUR/USD ($EURUSD) Daily: Testing 17-EMA & 200-EMA EUR/USD ( OANDA:EURUSD ) Daily: Testing 17-EMA & 200-EMA Confluences as Price Action Reaches Major Pivot Point
### 💶 Euro / U.S. Dollar ( OANDA:EURUSD ) Daily Technical Matrix (Ref: EURUSD_2026-09-08_08-49-57.png)
We are releasing an updated Daily (1D) technical study for EUR/USD ( OANDA:EURUSD / OANDA). Following a recovery leg out of multi-month lows, price action is consolidating near key moving average anchors, establishing a tight decision zone along its ascending trendline guide.
EUR/US
Gold Spot ($XAUUSD) Daily: Testing Key 200-EMA InstitutionalGold Spot ( OANDA:XAUUSD ) Daily: Testing Key 200-EMA Institutional Floor at 4,318 as Price Action Reaches Make-or-Break Confluence
### 🪙 Gold Spot / U.S. Dollar ( OANDA:XAUUSD ) Daily Technical Matrix (Ref: XAUUSD_2026-09-07_08-44-07.png)
We are releasing an updated Daily (1D) technical study for Gold Spot ( OANDA:XAUUSD / OANDA). Following a pull-back off recent local resistance levels, price action has dropped to test a major structural decision node, compressed directly between fast dynami
Elliott wave analysis of ES1! (US500)I still anticipate a final move towards 8000 to tag the median line and complete the impulse from October 2022 low.
Wave 4 of (5) can finish anywhere above 7438.50. Any move below 1 June high of 7632.25 would turn wave (5) into a diagonal.
Count valid above 7438.50, below 8241.25.
Gold. will continue surging after breakout? 20/August/26Xauusd's major downtrend line for many months finally broken after US Dept of Treasury said it will increase at least double! the size to buyback = QE! What will happen to Gold and Equity market soon? by next Fed next rate decision on Mid of Sept?
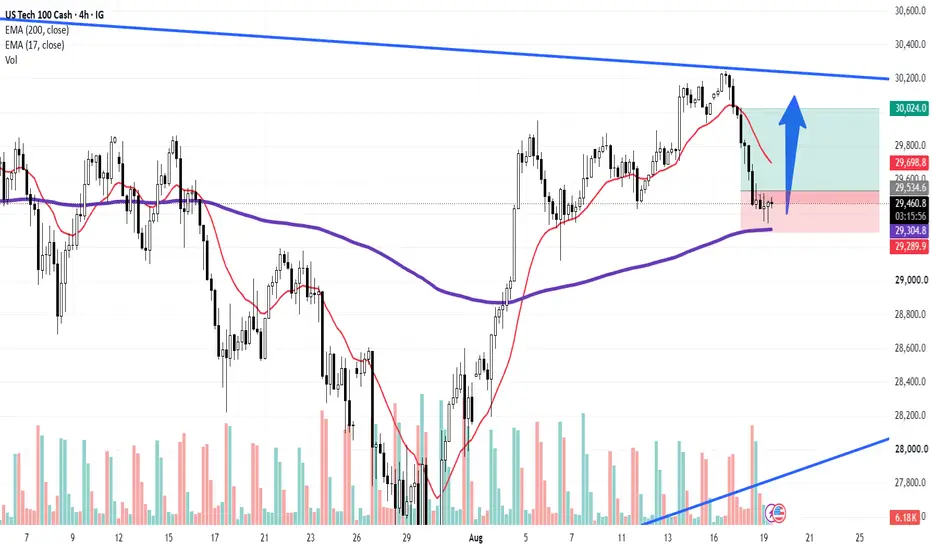
US Tech 100 ($NDX) 4H: 200-EMA Dynamic FloorUS Tech 100 ( NASDAQ:NDX ) 4H: 200-EMA Dynamic Floor Offers 2RR Tactical Rebound Against Daily Corrective Backdrop
### 🇺🇸 US Tech 100 Cash ( NASDAQ:NDX / US100) 4H Technical Matrix (Ref: NASDAQ_2026-08-19_08-34-20.png)
We are releasing an updated 4-Hour (4H) intraday execution study on the US Tech 100 Index ( NASDAQ:NDX / US100). Following a sharp sell-off from the upper descending trendline (LTB), price action has reached its primary intraday institutional anchor: the **200-period 4H EMA (pu
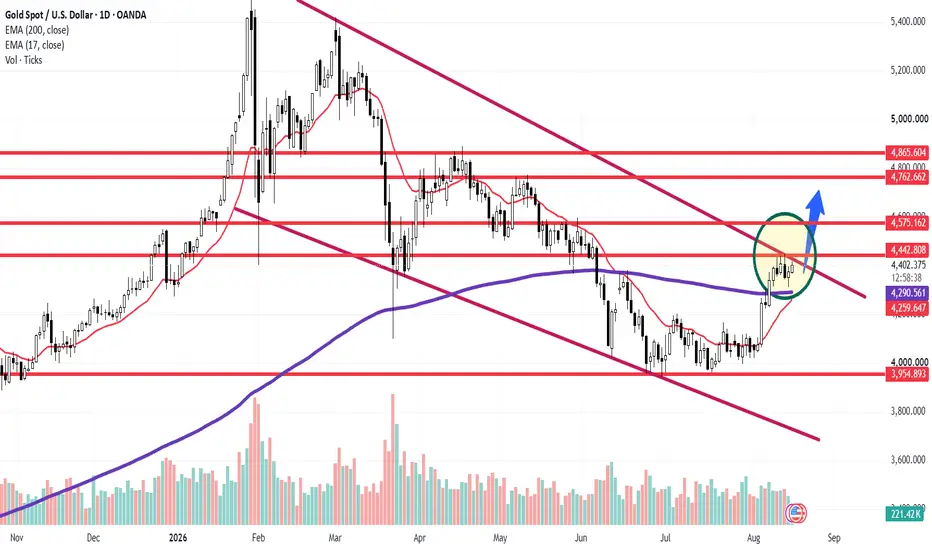
Gold ($XAUUSD) Daily: Dynamic Support Reclaim Sets Up PivotalGold ( OANDA:XAUUSD ) Daily: Dynamic Support Reclaim Sets Up Pivotal Test Against Confluent LTB & 4,442 Resistance Barrier
### 🟨 Gold Spot / U.S. Dollar ( OANDA:XAUUSD ) Daily Technical Matrix (Ref: XAUUSD_2026-08-17_08-58-39.png)
We are releasing an updated Daily (1D) structural study on Gold ( OANDA:XAUUSD ). Following a successful defense and reclaim of its institutional moving average baseline, price action has built a tight accumulation structure (highlighted zone) above dynamic support,
Elliott wave analysis for NAS100.I wanted to focus on the corrective structures that have occurred after the October 2022 bottom.
Liberation Day gave us a zigzag, truncated C wave and sharp reversal to the upside.
5 months of price action from October 2025-March 2026 gave us a regular flat, ending diagonal C wave, and sharp reversal upward.
June-July 2026 could be interpreted as another regular flat, but I am suspicious of two flats in a row. With the law of alternation, two flats would need to be interpreted as a 1/2, 1/2 r