Boeing deal changes everything: catching a long on $ACHRNYSE:ACHR
On the daily chart, conditions for opening a long position have formed. The main technical factor is the true breakout above the upper boundary of the long-term descending channel. Price exited it with a powerful impulse, met resistance at the MA200, and then turned into a correction from it. Now the asset is falling toward the gap fill zone. This decline is purely technical and is targeting the 5.47–5.60 range. This area represents a strong price confluence zone: full gap fill, liquidation of the price imbalance, the 50% Fibonacci retracement level, and the MA100.
The technical channel breakout is fully confirmed by the fundamental triggers of August 2026. The acquisition of Archer's Boeing Wisk Aero, Insitu, and SkyGrid divisions transforms the company into a significantly more diversified platform for the aerospace and defense industries, combining eVTOL, autonomous systems, drone technologies, and AI. Insitu adds more than $200 million in annual revenue, while Boeing receives a 19.75% stake in Archer and becomes a strategic partner. This significantly strengthens Archer's financial and technological base during its scaling and final FAA certification phase.
An important market marker is the nature of the volumes: the channel breakout occurred on abnormally high institutional volumes, with average volume rising to 52 million shares, while the current pullback is happening on sharply declining volumes, around 31 million shares. This indicates a reduction in seller pressure after the impulse breakout and allows us to view the current correction as a potential retest of the broken structure.
Position entry is planned with limit orders within the 5.47–5.60 zone. The first target is 8.80, and the medium-term target is 13.00.
The scenario loses relevance if price confidently returns back below the broken descending structure and loses the support zone.
This publication is for analytical purposes only and does not constitute individual investment advice. Share your thoughts in the comments and don't forget to support the idea with a like if you found the analysis useful!
Pivot Points
$PENGU: 4H OutlookBINANCE:PENGUUSDT is showing some relative strength after building a base around the 0.0060 area, with PA starting to push back toward the prior swing point.
A retest of 0.0062–0.0063 is likely next. If rejected there, I’d want to see 0.0060 hold and price base above it for another attempt higher.
A clean reclaim could open the way toward 0.0064–0.0065, which remains the key 4H resistance zone.
GOLD SELL | 5M → 1M IVL | Ichimoku Valid Levels
Entry Setup: After identifying a bearish market structure and a bearish Tenkan-sen/Kijun-sen cross on the higher timeframe (5M), the sell position was confirmed by the alignment of the market structure with the direction of the Tenkan-sen/Kijun-sen cross on the lower timeframe (1M).
TP: First Valid Low
SL: Structure Change | Break of the 52-Period Price Range High
ETHUSDT: Trend in 30-Min time frameThe color levels are very accurate levels of support and resistance in different time frames.
A strong move requires a correction to major support and we have to wait for their reaction in these areas.
So, Please pay special attention to the accurate trend, colored levels and you must know that SETUP is very sensitive.
BEST,
MT
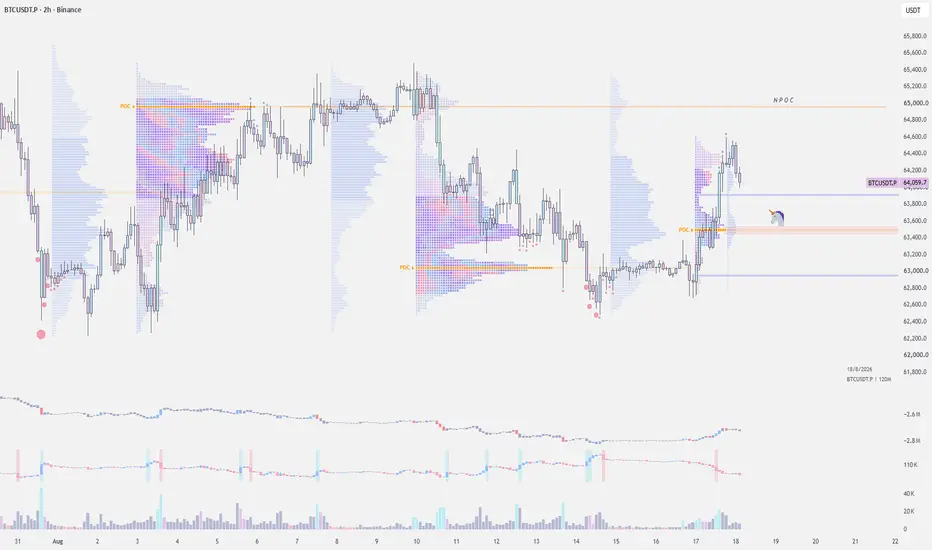
BTCUSDT: Trend in 30-Min time frameThe color levels are very accurate levels of support and resistance in different time frames.
A strong move requires a correction to major support and we have to wait for their reaction in these areas.
So, Please pay special attention to the accurate trend, colored levels, channels, and you must know that SETUP is very sensitive.
BEST,
MT
AA | The time to go long has come- Timeframe: Weekly
- Trade type: Buy stop order
- Price: 45.63
- Take Profit: Open
- Stop Loss: 42.48 (-6.90 %)
Idea: Long on a breakout above last week's high - bullish momentum continuation.
Entry: Buy stop above last week’s high.
Stop-loss: Below the low of the same candle.
If the weekly candle closes below this level, the trade is invalidated.
Take Profit: Trailing stop following the lows of new weekly candles.
CMC | Continued stock growth- Timeframe: Weekly
- Trade type: Buy stop order
- Price: 71.09
- Take Profit: Open
- Stop Loss: 67.31 (-5.30 %)
Idea: Long on a breakout above last week's high - bullish momentum continuation.
Entry: Buy stop above last week’s high.
Stop-loss: Below the low of the same candle.
If the weekly candle closes below this level, the trade is invalidated.
Take Profit: Trailing stop following the lows of new weekly candles.
SWKS | The time to go long has come- Timeframe: Weekly
- Trade type: Buy stop order
- Price: 63.89
- Take Profit: Open
- Stop Loss: 58.98 (-7.70 %)
Idea: Long on a breakout above last week's high - bullish momentum continuation.
Entry: Buy stop above last week’s high.
Stop-loss: Below the low of the same candle.
If the weekly candle closes below this level, the trade is invalidated.
Take Profit: Trailing stop following the lows of new weekly candles.
ARKX | Continued stock growth- Timeframe: Weekly
- Trade type: Buy stop order
- Price: 31.03
- Take Profit: Open
- Stop Loss: 29.50 (-4.90 %)
Idea: Long on a breakout above last week's high - bullish momentum continuation.
Entry: Buy stop above last week’s high.
Stop-loss: Below the low of the same candle.
If the weekly candle closes below this level, the trade is invalidated.
Take Profit: Trailing stop following the lows of new weekly candles.
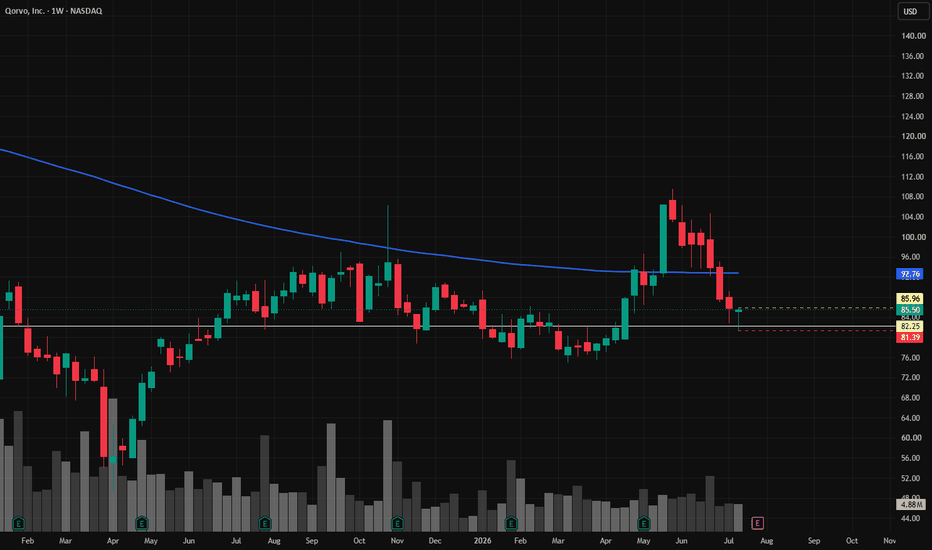
QRVO | The time to go long has come- Timeframe: Weekly
- Trade type: Buy stop order
- Price: 85.96
- Take Profit: Open
- Stop Loss: 81.39 (-5.30 %)
Idea: Long on a breakout above last week's high - bullish momentum continuation.
Entry: Buy stop above last week’s high.
Stop-loss: Below the low of the same candle.
If the weekly candle closes below this level, the trade is invalidated.
Take Profit: Trailing stop following the lows of new weekly candles.
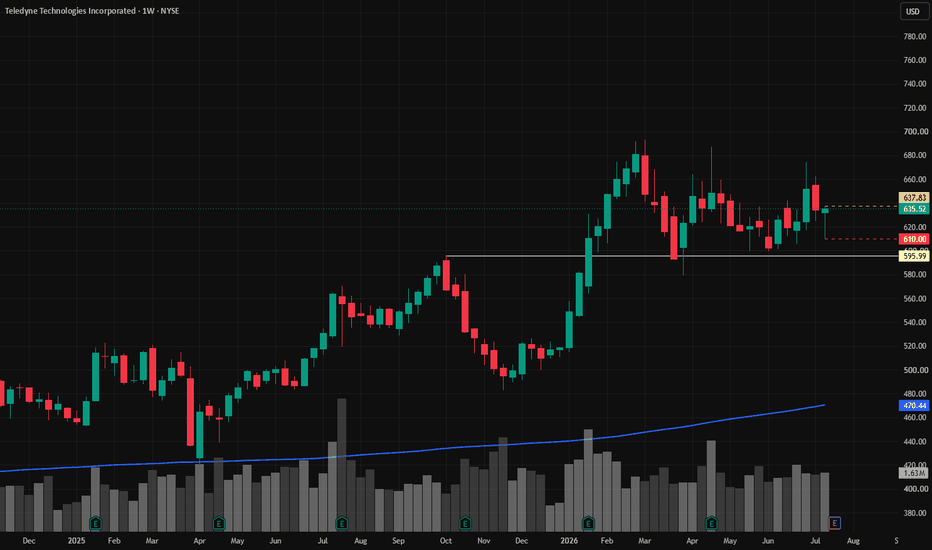
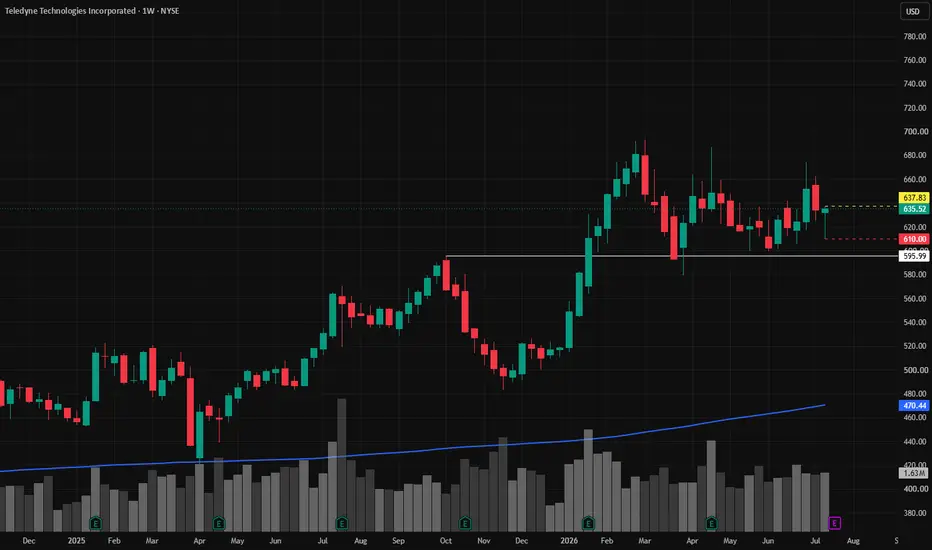
TDY | Continued stock growth- Timeframe: Weekly
- Trade type: Buy stop order
- Price: 637.83
- Take Profit: Open
- Stop Loss: 610.00 (-4.40 %)
Idea: Long on a breakout above last week's high - bullish momentum continuation.
Entry: Buy stop above last week’s high.
Stop-loss: Below the low of the same candle.
If the weekly candle closes below this level, the trade is invalidated.
Take Profit: Trailing stop following the lows of new weekly candles.
Nifty Analysis EOD – August 18, 2026 – Tuesday🟢 Nifty Analysis EOD – August 18, 2026 – Tuesday 🔴
Twenty-Point Prison: Nifty’s Breakout Bid Fails, Closes at 24,155
🗞 Nifty Summary
Nifty opened with a gap down below the PDL, and the pressure carried through early trade. After the open, it tried to rise and hover around the PDL to hold it through the first half, but around 10:30, the last recovery effort failed and it slipped below the support level 24,190 for a while before recovering. After that, price got stuck between 24,190 and the IBL (24,111) level, and for the rest of the session it stayed boxed into this 20-point range. A 3 PM breakout attempt out of this zone turned out to be a fakeout, and price slipped 65 points within 15 minutes, marking the 3:15 close at 24,165.45. The CAS close came in at 24,154.90, 20 points below that level.
One thing worth noting — options pricing looked off heading into the 3:15 close. The 23,200 CE was at 17, and the 23,200 PE was at 24.60, while spot sat at 24,165.45. One side was trading at a discount, the other at a premium.
This is another weak day, closing below the PDL and below the psychological support at 24,190, very close to filling the gap. The candle itself closed right at the day’s low with barely any lower wick, which tells me sellers stayed in control right up to the bell. Let’s see: after filling the gap at 24,040, should it start its recovery journey or not?
🛡 5 Min Intraday Chart with Levels
📉 Daily Time Frame Chart with Intraday Levels
🕯 Daily Candle Breakdown
Open: 24,223.85
High: 24,269.65
Low: 24,154.90
Close: 24,154.90
Change: −132.75 points (−0.55%)
🏗️ Structure Breakdown
Type: Strong Bearish — sellers stayed in control from open to close
Range: ≈ 114.75 points — low volatility
Body: ≈ 68.95 points — sellers held firm command through the session
Upper Wick: ≈ 45.80 points — some early supply near the highs
Lower Wick: ≈ 0 points — no cushion at the close, sellers held it right to the bell
🛡 5 Min Intraday Chart
⚔️ Gladiator Strategy Update
ATR: 170.86
IB Range: 58.55 → Medium
Market Structure: ImBalanced
Trade Highlights:
10:27 Long Trade: SL Hit
12:37 Short Trade: Trailing Exit (R:R 1:1.62)
Trade Summary: The long trade this morning got stopped out as Nifty failed to hold the zone — just the range doing what a choppy day does. The short trade in the afternoon worked out well, trailing out at 1:1.62 after the breakdown, and I’ll credit the system for staying patient through that fakeout move. Sticking to just these two trades and not forcing anything else into this range felt like the right call today.
🧱 Support & Resistance Levels
Resistance Zones: 24,270 | 24,335 ~ 24,360 | 24,430 | 24,500
Support Zones: 24,135 | 24,050 ~ 24,040
🧠 Final Thoughts
“The market doesn't need to break to fool you. Sometimes it just needs fifteen minutes.”
Today felt like Nifty just couldn’t find room to move. The whole session got boxed between 24,190 and 24,111, and even the one real breakout attempt at 3 PM turned out to be a trap that reversed hard into the close.
If 24,040 holds as support after the gap fill, we could see an attempt to recover back toward 24,190 and the 24,270 zone above it. But if that level gives way, 24,050 and lower could open up fairly quickly given how heavy today’s close looked.
I’m going in tomorrow watching how price reacts around the gap-fill zone before taking a side. No rush to have a strong opinion this early — I’d rather let the first hour tell me something instead of guessing.
✏️ Disclaimer
This is my personal digital diary and represents my own analysis and point of view. It is not financial advice; please consult a professional advisor before making any trading decisions.
Best Trading Indicator to Find Psychological Levels TradingView
This free trading indicator will find every significant psychological level on any forex pair that you trade.
In this article, I will show you how to set it up properly and how to use it on TradingView.
First, in brief, let me explain to you what a psychological level is.
A psychological level is a round-number-based level.
On a EURUSD pair, 1.6 level will be a great example of a psychological level.
You can see that this level is historically significant, and the price respected that multiple times in the recent past.
Because of various human basis, such levels can be extremely significant and important price movements and strong reactions may initiate from them
Good news is that there is a technical indicator that will help you find these levels easily.
Let me show you how to set it up on TradingView.
It is called Round Numbers and Quarter Levels by bluebeirdit.
You can find it in the indicator window on TradingView by searching "Round Numbers".
Once you click on that, it will start working immediately.
Here is how this indicator plots significant psychological levels on EURGBP forex pair.
Opening the settings, it suggests a display of psychological levels based on whole numbers, 50 or half numbers and quarter numbers.
For trading forex, I suggest paying attention only to whole-number-based levels.
So we will remove all others.
To hide them, I propose changing their opa c ity and making it 0.
The last thing that you need to do in the settings, you should
increase the number of lines above/below.
Next time when you execute a support and resistance, key levels analysis on any forex pair on TradingView, use this indicator to find psychological analysis.
It will make your structure analysis more complete and will help you to make more accurate predictions.
❤️Please, support my work with like, thank you!❤️
I am part of Trade Nation's Influencer program and receive a monthly fee for using their TradingView charts in my analysis.
SYK | Continued stock growth- Timeframe: Weekly
- Trade type: Buy stop order
- Price: 330.81
- Take Profit: Open
- Stop Loss: 306.90 (-7.20 %)
Idea: Long on a breakout above last week's high - bullish momentum continuation.
Entry: Buy stop above last week’s high.
Stop-loss: Below the low of the same candle.
If the weekly candle closes below this level, the trade is invalidated.
Take Profit: Trailing stop following the lows of new weekly candles.
GRAB | The time to go long has come- Timeframe: Weekly
- Trade type: Buy stop order
- Price: 3.51
- Take Profit: Open
- Stop Loss: 3.31 (-5.70 %)
Idea: Long on a breakout above last week's high - bullish momentum continuation.
Entry: Buy stop above last week’s high.
Stop-loss: Below the low of the same candle.
If the weekly candle closes below this level, the trade is invalidated.
Take Profit: Trailing stop following the lows of new weekly candles.
$SOL — Long Trade IdeaSolana has been grinding higher off the June lows, reclaiming the $74–75 area and now coiling in a tight mini consolidation beneath the descending trendline.
Not sure we get a little time displacement above this mini consolidation but interested in taking this back to $84–87s (high-volume nodes).
$ZEC: Strong move expected. ⚠️ BYBIT:ZECUSDT.P
Building large positions
Interesting setup playing out. Specifically, hidden accumulation by 🐋large players.
As the chart shows, price has been grinding in a range between monthly support 📊M-Levels $438–$465 and resistance 📊M-Levels $523–$551 for quite some time.
🧩IMA data shows 🐋large players are holding massive long positions against shorting retail. This points to 🐋large accounts buying in size, using retail shorts as fuel to build their position.
This rare setup on the monthly timeframe could signal 🐋large players are setting up a big move to take out the nearby high at $588.
Nearly impossible to say when the chop ends, so the best play here is to wait for price to re-enter the consolidation zone.
🟡 New trade plan:
🟢 1. Entry $484 — 50%
🟢 2. Entry $454 — 50%
🛑 Stop $417 below weekly support (conservative)
Those who entered on my plan from 07/25, hold the position and if the market gives us a chance, add lower per the original plan.
ru.tradingview.com
Analysis from me — execution from you 🚀
Analysis powered by 🧩IMA (Integrated Market Analysis)
📊M-Levels / 📊W-Levels — Institutional Interest Levels
⚠️ Platform restrictions limit the publication of closed indicators. I display only the output of the 📊Levels algorithm.
#ZEC #ZECWhale #InstitutionalLevels #Crypto
# $ZEC Urgent. Reversal.BYBIT:ZECUSDT.P
Sunday's shortened session revealed something interesting through 🧩 IMA: institutional players 🐋WhaleMAX (large players) were aggressively building longs right on a test of 📊M-Levels (Institutional Interest Levels) support — the zone I previously flagged as a key interest level for big capital. Given that retail orders were being absorbed all week, I believe everything points to the beginning of a reversal.
🟢 Entry in parts:
• 50% — $477 (current)
• Remainder — $466 / $455.6
🔴 Stop: $427 (elevated risk)
🔴 Stop: $407 (classic, beyond liquidity zone)
Analysis from me — execution from you 👍
Analysis powered by IMA (Integrated Market Analysis)
⚠️ Platform restrictions limit the publication of closed indicators. I display only the output of the 📊Levels algorithm.
EXE | Continued stock growth- Timeframe: Weekly
- Trade type: Buy stop order
- Price: 94.18
- Take Profit: Open
- Stop Loss: 88.10 (-6.50 %)
Idea: Long on a breakout above last week's high - bullish momentum continuation.
Entry: Buy stop above last week’s high.
Stop-loss: Below the low of the same candle.
If the weekly candle closes below this level, the trade is invalidated.
Take Profit: Trailing stop following the lows of new weekly candles.
CAJPY | Continued stock growth- Timeframe: Weekly
- Trade type: Buy stop order
- Price: 28.65
- Take Profit: Open
- Stop Loss: 27.26 (-4.90 %)
Idea: Long on a breakout above last week's high - bullish momentum continuation.
Entry: Buy stop above last week’s high.
Stop-loss: Below the low of the same candle.
If the weekly candle closes below this level, the trade is invalidated.
Take Profit: Trailing stop following the lows of new weekly candles.
BCC | The time to go long has come- Timeframe: Weekly
- Trade type: Buy stop order
- Price: 80.00
- Take Profit: Open
- Stop Loss: 73.64 (-8.00 %)
Idea: Long on a breakout above last week's high - bullish momentum continuation.
Entry: Buy stop above last week’s high.
Stop-loss: Below the low of the same candle.
If the weekly candle closes below this level, the trade is invalidated.
Take Profit: Trailing stop following the lows of new weekly candles.