Hyperliquid: poised for a breakout? key levels to watch todayHyperliquid – ready for another leg or about to fake everyone out? According to the market, attention on perp DEX narratives is heating up again, and this one keeps popping up in volume screens even while majors chop around. Today price is coiling right under local resistance after that sharp pullback, so I’m watching closely for the next expansion move.
On the 4H chart, price is holding above the key demand band around 37 and sitting near the point of control just under 39, where most recent volume traded. RSI has reset from overbought and is curling up from the mid‑40s, which usually fuels continuation rather than full trend reversals. As long as we stay above that 37 support shelf, I lean bullish, looking for a grind back into the 40‑42 zone with fresh buyers stepping in if perp sentiment stays positive.
My plan: ✅ base case is a long while price holds above 37, targeting the low 40s where previous supply kicked in. If candles start closing below 37 with increasing volume, that invalidates the long idea and opens the door for a deeper flush toward the 31 support block. I’m stalking entries near value, not chasing green candles, and I might be wrong, but this still looks more like consolidation before markup than a top. Cardano: dip or bounce? key levels for the next few daysCardano
Dip hunters, you watching this? ADA just got hammered again as the market cools off after the latest risk‑off wave, while industry chatter is all about majors rotating into “safer” names and stables. According to market sources, sentiment on alt L1s is shaky, but that’s exactly when the best mean‑reversion plays usually sneak in.
On the 4H chart we’re sitting right on a huge demand zone around 0.245, with multiple wicks rejecting the same orange block. RSI is buried in oversold territory and curling, hinting at seller exhaustion, and volume picked up right as price tapped this base. I’m leaning long here, looking for a bounce back toward the local supply bands around 0.255 then 0.265 if momentum follows through.
My game plan: aggressive bulls can stalk entries inside this orange zone with invalidation slightly below the recent low; conservative traders can wait for a clean 4H close back above 0.25 to confirm buyers are alive. Base case for me is a relief move into 0.26, but if this support snaps and we close below the zone, I’d flip bias and look for a deeper flush instead. I might be wrong, but ignoring a major support with oversold RSI has punished me more than once. ✅ Dogecoin: major support in sight? key levels to watch this weekDogecoin
Who else is watching this meme dinosaur quietly sitting on a major support block? According to market chatter, flows are slowly rotating back into large caps while speculative memecoins cool off, and DOGE has been grinding lower on fading volume. On today’s 4H chart price is parked right on that big orange demand zone that has been defended multiple times this month.
On the 4H, RSI is hovering near the low 30s, showing sellers are tired but not fully washed out yet. I’m leaning bullish from this area: price keeps wicking into the orange box and snapping back, classic “smart money accumulating while retail panics.” If buyers manage to hold this base, a mean‑reversion move toward the 0.09 region and then the red supply band above looks realistic as shorts take profit.
My game plan: I like spot or small leveraged longs inside the orange zone with invalidation just below the green support box. Base case – bounce toward 0.09 and, if momentum and volume confirm, extend into the upper red zone. ⚠️ If we lose the green box with a strong 4H close, I assume the bulls fumbled and I’ll step aside, looking for cheaper entries lower. I might be wrong, but this looks like classic DOGE “sleepy range before surprise wake‑up.” Solana: dip buying opportunity or falling knife? key levels to wSolana — buying the dip or catching a falling knife? After the recent hype around ecosystem launches and onchain activity, SOL just printed a nasty 4H flush as the market cooled off on the risk-on narrative. According to industry sources, funding and perp interest have been unwinding, and you can see that sentiment swing straight into this sharp liquidation wick.
On the 4H chart, price just pierced the big orange demand zone and RSI is buried in oversold territory, hinting at exhaustion rather than fresh strength from sellers. I’m leaning toward a bounce scenario: if SOL reclaims that orange block as support, I expect a squeeze back into the red supply zones above, where previous volume was stacked. Think of this drop as the market shaking weak hands before deciding the next leg.
My game plan: I’m watching for a 4H close back inside the orange zone plus an RSI curl up before trusting longs, with potential targets around the mid and upper red zones. If price can’t reclaim and we start closing firmly below today’s wick, then the door opens for a deeper slide toward the green zone below, and I step aside. I might be wrong, but this is exactly the kind of ugly candle that often marks the start of a mean reversion move. FLOW: bounce or drop? key levels and targets for todayFLOW
Who’s brave enough to touch a chart that looks like a ski slope straight to zero? According to market chatter, FLOW’s been under pressure with weak liquidity and fading hype, but lately the headlines about ecosystem updates and partnerships are starting to creep back in. That’s usually when smart money quietly accumulates while everyone else memes it to death.
On the 4H chart we’re sitting on a heavy demand pocket after a brutal bleed, with RSI stuck in oversold but curling up. I see a tiny descending wedge/rounding base forming, plus a visible volume bulge right below price, so I’m leaning toward a relief bounce rather than another full leg down. If buyers step in, the first magnet for me is that 0.03 zone, then the thicker supply area around 0.035–0.04.
My plan: I’m hunting longs on dips near current support, targeting the 0.03/0.035/0.04 clusters and taking partials on the way up ✅. If this base cracks and we close a 4H candle clean below the recent low, I assume the bounce idea is dead and I’m out, waiting lower instead. I might be wrong, but ugly charts like this are often where the sneaky 30–50% bounces are born. Zetachain: support or sell-off? key levels and targets aheadZetachain. Who’s watching this support zone with me? Recently the market has been punishing newer L1/L2 names while liquidity rotates into majors, and according to industry sources, on‑chain activity here has cooled off a bit. Price has been bleeding for days, and now we’re parked right on that big orange demand block where buyers last defended hard.
On the 4H chart, price is hugging the bottom of that zone while RSI sits in the low 30s, so sellers are getting tired but haven’t fully let go. I’m leaning cautiously long from this demand, looking for a mean‑reversion pop back into the mid range above, where we see previous consolidation and heavier volume. If fresh ecosystem headlines drop, this area can turn into a springboard pretty fast.
My plan: I like layered bids inside the orange zone with a tight invalidation just below it, aiming for a bounce into the higher resistance band above as first take‑profit. If this level cracks and we close a few candles below, I stop out and let it drift into the green zone, where the next real bargain hunt starts. I might be wrong, but ignoring a major demand zone with oversold RSI has never been my style. ✅ MERL: ready for a bounce? key levels and targets to watchMERL
Who’s brave enough to knife‑catch this one? MERL just got hammered with the rest of the alt market after the latest risk‑off wave in crypto, as traders rotate back into majors according to industry sources. Today’s headlines about increasing regulatory noise around smaller projects are not helping sentiment, so liquidity is thin and moves are exaggerated.
On the 4H chart, price is parked right on that green demand zone after a vertical dump, while RSI is buried in oversold territory with early signs of flattening. I’m leaning toward a relief bounce long from here, targeting the nearest liquidity pockets around 0.033 and then 0.036, where previous volume spikes and a big supply block sit. If buyers actually show up, this could turn into one of those classic “dead cat that jumps higher than expected” squeezes.
My play: I’m stalking reactive longs in this demand area, with invalidation just under the recent low so the risk is tight. Base case, we grind up into 0.033 then 0.036, and in a full squeeze 0.04 is on the table. ⚠️ If this zone fails and we close 4H candles below it, I step aside and let it bleed lower – I might be wrong, but I don’t argue with fresh lows. ENS: pullback or bounce? key levels to watch this weekENS
Anyone else watching ENS bleed back after that sharp run up? According to market chatter, interest in naming and identity plays picked up again with the latest crypto rotation, but today buyers clearly stepped aside and price reacted instantly. That makes this pullback pretty important: are we just cooling off, or is this the start of a deeper flush into the old demand zone?
On the 4H chart, price is rolling over from a red supply block with RSI dropping out of overbought, so I lean short term bearish. I’m watching the low volume “air pocket” under current price – if sellers keep pressing, the path of least resistance is down into the green demand area around the mid 5s, where we previously saw strong bids. With sentiment still broadly positive for ENS fundamentals, I see this more as a potential dip zone than a full trend break.
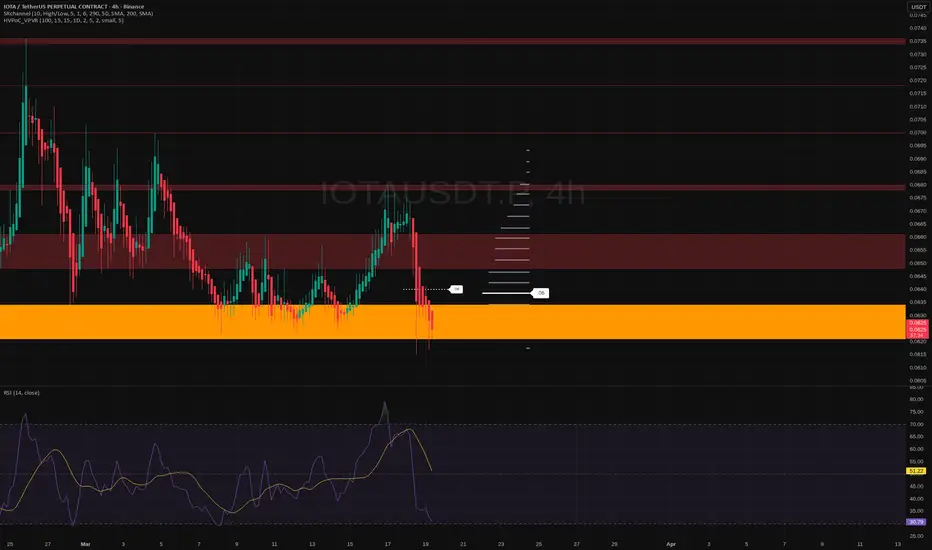
My base plan: I let it drift lower toward that green support, then look for a bounce setup with clear wicks and RSI curling up ✅. If bulls defend there, I’m hunting a move back toward the red supply zone above, where I’d start taking profit. If that green block snaps and we close 4H candles below it, the idea is invalid for me and I’d step aside – I might be wrong, but I’m not arguing with a clean breakdown. IOTA: bounce or bleed? exploring key levels for todayIOTA
Catching this dip or letting it bleed out? According to industry sources, sentiment on smaller alts turned cautious after recent macro jitters and Bitcoin’s dominance push, and IOTA got dragged right back into its old demand zone. Today we saw a flush straight into that big orange support area, while news around ecosystem development stays quiet and the market is clearly in “prove it” mode.
On the 4H chart, price is sitting on a major historical demand block around 0.062 with RSI buried near oversold, which screams “potential bounce” to me. I’m leaning bullish from this zone, looking for a mean reversion back into the 0.066 - 0.070 red supply band if buyers show up with real volume. I might be wrong, but this kind of vertical drop into support is often where smart money quietly reloads.
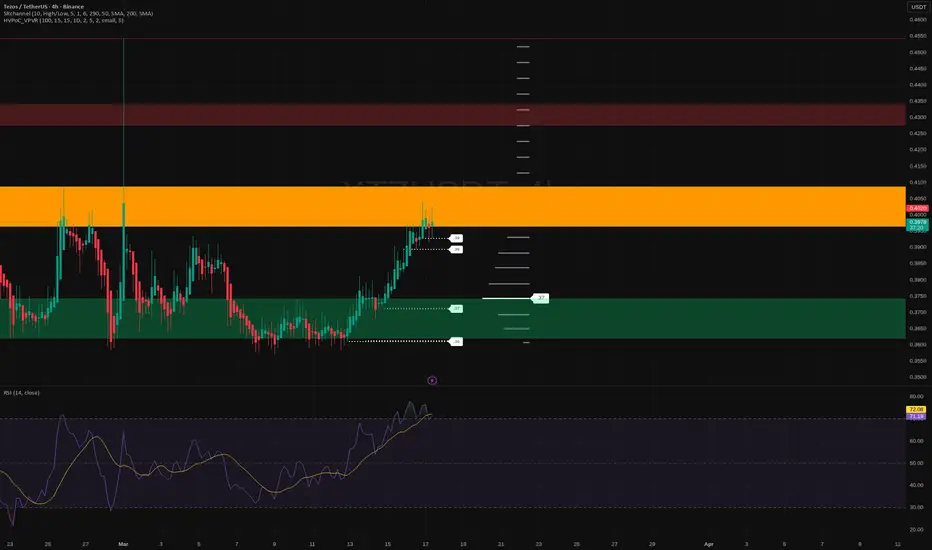
My plan: watch for a 4H candle that rejects the orange zone and closes back above roughly 0.063 with rising volume ✅. That opens the door for a swing toward 0.067 first, then maybe 0.07+. If bulls fail and we get a clean 4H close below the orange block, I flip the script and expect continuation lower, so I’d cut longs and wait for the next level down instead of trying to be a hero. Tezos: fresh bounce or reversal? key levels to monitor todayTezos. Who’s farming this bounce? Lately, according to industry sources, Tezos has been back in the headlines thanks to fresh activity in its ecosystem and a broader pop in altcoin sentiment. Today price just smacked right into a big 4H supply block around 0.40–0.41, and the reaction is already showing on the candles.
On the 4H chart we’ve got a clean vertical run from the green demand area near 0.36 into that thick orange resistance, with RSI stretched above 70. Volume profile shows a fat node in the green zone and a clear low‑volume pocket in between, so any rejection up here can unwind fast. I’m leaning short term bearish from this supply, expecting a corrective leg back into previous demand as late longs get shaken out.
My base plan: look for rejection wicks and fading momentum in the orange zone, targeting a pullback toward the green band around 0.37 first, then possibly 0.36 if sellers really press. If bulls suddenly blast and hold above 0.41 with strong volume, that invalidates the short idea and opens the road to the next resistance near 0.43–0.44. I might be wrong, but for now I’m waiting for the liquidity grab up here to fade before jumping in. Bitcoin's weekly RSI hits bottom, same as June 2022—2026 vs 2022Bitcoin hit a major low June 2022, the previous bear market orthodox end. The final price was $17,625. This same month the RSI hit bottom just to recover long-term.
Here is a picture of Bitcoin's weekly RSI:
» Notice how February 2026 produced the same reading, a double-bottom, compared to June 2022. This is the final low when it comes to this indicator.
After the June 2022 low Bitcoin performed a small relief rally, it lasted a total of 9 weeks. Prices climbed from $17,625 to a high of $25,204—A 43% bullish jump.
A similar scenario in 2026 would give us a price of $85,800 and a date of 6-April 2026. This would be the minimum amount of bullish action based on past action, a repeat of 2022.
The lower low in November 2022 resulted in a price of $15,484. A -12.15% drop. The entire move lasted 98 days.
If we want to repeat something similar in this cycle, the exact same happening which is highly questionable; then we can expect Bitcoin to drop to a price of $52,710 by the 13-July 2026 week. This is highly speculative, but it would be the result if Bitcoin were to move exactly as it did in the last bearish cycle.
Look at past history, all the bull markets and bear markets, Bitcoin never ever moved in the exact same way.
» The 2017 bull-cycle was a parabola of a single wave, straight up.
» The 2021 bull-cycle had one extension, a major drop, followed by another extension and then a double-top.
» The 2025 bull-cycle produced a pattern based on steps. It was growth followed by sideways, more growth then sideways, until the final range produced a triple-top.
Strong variations are also present throughout all bearish cycle.
If Bitcoin performs in the exact same way...
» BTCUSDT is ready to move higher. Prepare for all scenarios. Everything is possible, and the market is bullish now.
Only if Bitcoin fails to produce a higher high next do we consider a lower low in the coming months. It is not mandatory nor necessary. We are going up.
Namaste.  Long
Long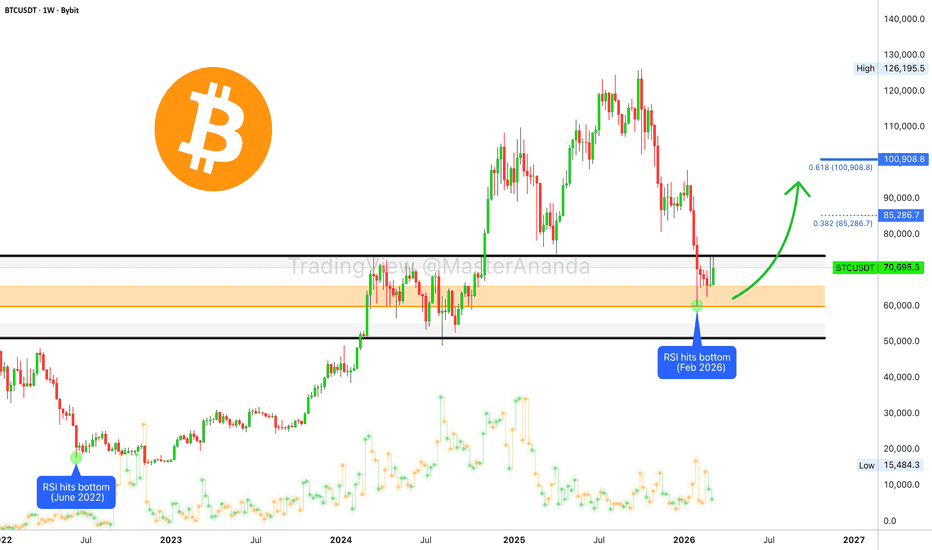
SPX6900: dip or trap? key levels to watch for the coming daysSPX6900 – dip or trap? While indices keep dancing around rate‑cut expectations and micro‑caps get tossed around with every macro headline, this little leverage token is quietly retesting a key 4H zone. According to market chatter, traders are rotating back into index exposure after the latest data cooled some of the hard‑landing fears, which can fuel bursts of volatility here.
On the 4H chart, price just rejected the 0.32 supply block and slid back toward local support around 0.30 and then 0.29. Volume dried up on the last push up while RSI rolled over from near overbought, so I’m leaning short in the near term, looking for a deeper liquidity grab before any serious bounce. If buyers don’t defend this support pocket, we could easily see a flush into the lower green demand band.
My base plan: I’m watching for a short continuation into that demand zone, then potential reversal signs for a counter‑long. ✅ If bulls suddenly step in and we get a clean 4H close back above 0.32, that invalidates the short idea and opens room toward the upper red supply. I might be wrong, but until 0.32 is reclaimed with conviction, I treat every spike up as a sell‑the‑rip opportunity, not a new bull run. 1980 (Japan) - Dai-Dan Is A Powerhouse On SaleDai-Dan Co Ltd has been an absolute beast lately, putting up a gain of over 200% in just a year. Based in Japan, they specialize in the high-end electrical and HVAC systems that power data centers and hospitals. It is exactly the kind of unglamorous, essential business that trend followers love to see leading the market. Sometimes boring is good :)
The fundamental story is backed by some serious weight. Profits have essentially doubled over the last year, and their order book is sitting at record levels due to the massive demand for infrastructure. They recently executed a 3-for-1 share split and boosted their dividend, which often leads to a bit of "sell the news" profit-taking.
Looking at the chart, the price has drifted right back into a major value area . It is currently testing the 50-day SMA , which has acted as a floor throughout this entire uptrend. The RSI has reset from overbought territory down to a neutral 46, giving the stock some room to breathe before its next move. While the MACD still shows some downward momentum, the selling pressure appears to be drying up as it hits this support level.
Might be worth a watch.
..................................................
PLEASE NOTE: Nothing I post is trading advice. All investing involves risk, and past performance doesn’t predict future results. Trends can and do end. For 2026 , my goal is to try and post one new asset each trading day. Something outside the usual gold, silver, BTC, or big tech names. I like to find stocks worldwide showing steady trends with some good gains, a recent pullback, and signs of renewed strength. I don’t necessarily hold positions in these. They are simply companies I find interesting at the time of posting. I’ll often revisit them within a week to see how they went and share any updates. If you enjoy these posts, please BOOST and FOLLOW ME to discover more under-the-radar stocks and businesses from around the world.
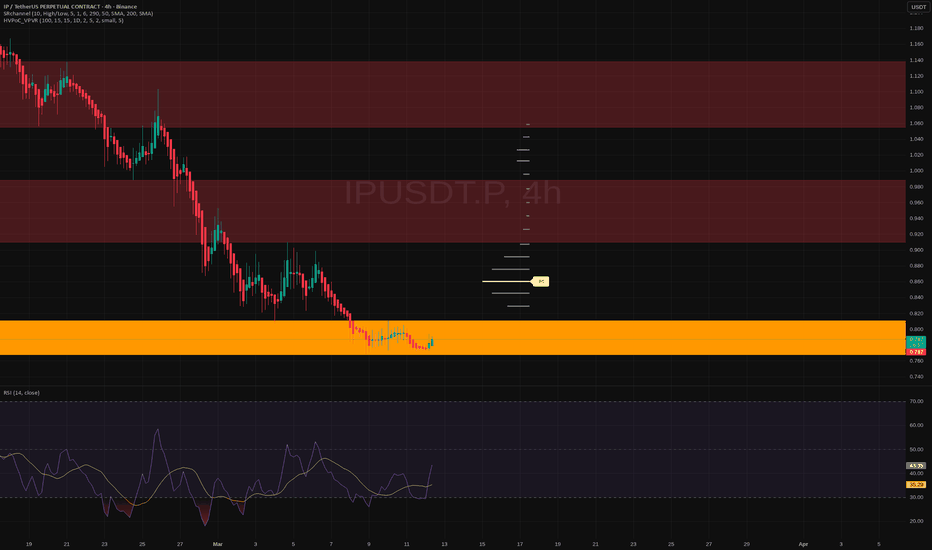
.................................................. JUP: ready for a bounce? key levels and targets to watchJUP
Who’s still watching this airdrop darling after the hype cooled off? Recently, according to industry sources, interest in ecosystem expansion and upcoming governance talk is creeping back into the newsfeed, but price has been quietly bleeding down. That combo usually gives us either a nasty final flush or a sweet mean‑reversion bounce.
On the 4H chart JUP is sitting right on that big orange demand block, with visible volume building there and RSI trying to curl up from oversold territory. As long as price holds this zone, I’m leaning toward a relief move back into the upper red supply areas where previous sellers stacked up. I might be wrong, but this looks more like late capitulation than fresh distribution.
My base plan: look for confirmation wicks / small higher lows on this support, targeting a bounce toward the 0.17‑0.18 region where I’ll think about taking profit. If the orange zone gives way and we get a 4H close below it, that flips the script and opens room for a slide into the green demand area lower, where I’d rather wait for a deeper discount. For now I’m patient, stalking entries near support instead of chasing candles in the middle of the range. I
is RSI really telling you to short at 70 or buy at 30?Overbought/oversold: why RSI>70 doesn’t mean “short it”
Let’s start with the classic rookie move.
You open a chart, slap on RSI, see it poke above 70 and think:
“That’s it, it’s overbought, time to short this pig.”
Two candles later, price is 3% higher, your stop is gone, and you’re staring at the screen like the market personally insulted you.
Been there. Several times.
RSI>70 doesn’t mean “short”
RSI<30 doesn’t mean “buy”
Those levels don’t tell you “reversal”. They tell you “strong momentum”. That’s a completely different game.
RSI 70+ basically means: “Yo, buyers are in beast mode right now.”
RSI 30- basically means: “Sellers are running the show.”
And what do strong trends love to do?
Stay strong longer than your patience and your account can handle.
RSI in a trend vs RSI in a range
RSI works very differently in different environments:
1. In a range
Price is bouncing between support and resistance, like a ping-pong ball.
Here, RSI overbought/oversold can sometimes work as reversal points:
- RSI near 70 at resistance → potential pullback
- RSI near 30 at support → potential bounce
Key word: potential. Even there, you still want structure, candles, volume… not just a number on an indicator.
2. In a trend
This is where most beginners get wrecked.
In a strong uptrend:
- RSI can stay above 70 for days, weeks, sometimes months
- Price makes higher highs
- RSI “overbought” becomes the norm, not the exception
In a strong downtrend, same story but inverted: RSI hugs 30 and refuses to leave.
So if you blindly short just because RSI is above 70 in a trend, you’re basically standing in front of a moving train saying, “It’s fine, RSI told me it’s tired.”
Spoiler: the market doesn’t care.
RSI is a tool, not a signal
Think of RSI as a “mood meter” of the market, not a buy/sell button.
How I actually use it:
1. To confirm trend strength
- Uptrend and RSI consistently above 50? Bulls are in control.
- Downtrend and RSI consistently below 50? Bears are chillin’ on the throne.
2. To spot “momentum divergences”
This is more advanced, but even beginners can start noticing it:
- Price makes a higher high
- RSI makes a lower high
→ Trend might be weakening. Not a guaranteed reversal, but a sign to stop YOLOing in the trend direction and tighten risk.
3. To time entries WITH the trend
This is where newbies flip the script.
Instead of shorting overbought in an uptrend, I’m more interested in:
- Strong uptrend
- RSI was above 70
- Then cools down toward 50–60 while price pulls back into support
→ That’s often a spot to look for a long ENTRY, not a short.
RSI becomes your dip-spotter, not your “top-caller”.
Context is everything
Same RSI reading, totally different meaning:
- RSI 75 at resistance in a choppy range after a huge vertical candle → maybe a scalp short makes sense
- RSI 75 in the middle of a clean, steady uptrend with higher highs and higher lows → I’m more scared of shorting that than of holding through a Sunday gap.
Maybe I’m wrong, but most traders don’t blow up because RSI lied to them. They blow up because they ask RSI the wrong question.
They ask:
“Is this overbought, should I fade it?”
They should ask:
“Is this a trend or a range? Is momentum building or dying?”
Practical checklist for beginners
Next time RSI goes above 70 or below 30, run this quick mental checklist:
1. What’s the bigger picture?
Zoom out. Higher timeframe trend: up, down, or sideways?
2. Where is price relative to key levels?
Support, resistance, recent swing highs/lows.
3. What’s RSI doing around 50?
Above 50 most of the time → bullish bias.
Below 50 most of the time → bearish bias.
4. Are you trading with the trend or against it?
With it → RSI can help you buy dips or sell rallies.
Against it → you’re trying to be a hero. Heroes don’t last long in this game.
5. Are you betting on exhaustion or continuation?
RSI extremes in a RANGE → you can try fading, small size, tight risk.
RSI extremes in a TREND → be very careful trying to call tops or bottoms.
RSI isn’t your enemy
The problem isn’t RSI. It’s using it like a magic button.
RSI > 70 doesn’t mean “short now”. RSI < 30 doesn’t mean “buy now”.
It means: “Momentum is stretched. Pay attention. Don’t be naive.”
Use RSI as a highlighter, not as a trigger.
The chart is the story. RSI is just the subtitle.
And in trading, reading the subtitles without watching the movie is how you end up rage-closing positions and blaming the indicator. Education 
SEI: ready for a bounce? key levels to watch this weekSEI
Who’s still watching this laggard while the rest of the market chases shiny pumps? Lately SEI’s been under pressure as liquidity rotates into larger caps, but according to the market there’s still decent attention on ecosystem development and listings, so I’m treating this as a “quiet zone before headlines catch up.”
On the 4H chart, price is stuck in a fat red supply block, with clear volume build just above current levels and RSI climbing out of oversold. That combo screams “relief bounce first, decision later.” I’m leaning long here, targeting a move back into the next higher supply band around the 0.07 area where prior volume peaked.
My game plan: ✅ look for constructive candles and higher lows above this local demand, then ride it toward that 0.07 pocket, taking partials on the way. If we lose the recent swing low and RSI rolls over again, I’ll flip the bias and expect a sweep lower to hunt stops before any real trend change. I might be wrong, but for now I’m treating this as a short-term bounce play, not a marry-and-hold setup. BE (USA) - Unstoppable AI Power Demand SolutionsBloom Energy has been on a massive run, surging nearly 600% over the last year. The momentum here is undeniable. Bloom builds solid-oxide fuel cells that provide quick, onsite power solutions . This is highly interesting to investors right now because new AI data centers require immense amounts of continuous electricity. The traditional utility grid simply cannot keep up. By bypassing years of waiting for grid connections, Bloom allows these tech companies to get their facilities online fast.
Fundamentally, the trend is being driven by this exploding demand for off-grid power. The company recently reported record revenue, but the real standout is their massive $20 billion sales backlog . Recent news of a $5 billion partnership with Brookfield to supply power to global AI factories has only strengthened the stock. The stock recently pulled back from its highs near $180. Partially globally uncertainty, partially standard profit-taking and market digestion after such an aggressive run. Perhaps also mixed with some minor market nerves about whether they can scale manufacturing quickly enough to execute on all these big orders.
Technically, this recent dip is a move into a much better value area. Looking at the chart, the price action has pulled right back into the 20-day SMA, which has stepped in as short-term support. The RSI has completely reset from highly overbought levels back down to a neutral 50. Down below, the MACD histogram shows that the selling pressure is fading fast, and the lines look ready to cross back over. The broader trend remains heavily intact, and buyers are stepping back in.
Think AI data centres need power? This might be worth a watch.
..................................................
PLEASE NOTE: Nothing I post is trading advice. All investing involves risk, and past performance doesn’t predict future results. Trends can and do end. For 2026 , my goal is to try and post one new asset each trading day. Something outside the usual gold, silver, BTC, or big tech names. I like to find stocks worldwide showing steady trends with some good gains, a recent pullback, and signs of renewed strength. I don’t necessarily hold positions in these. They are simply companies I find interesting at the time of posting. I’ll often revisit them within a week to see how they went and share any updates. If you enjoy these posts, please BOOST and FOLLOW ME to discover more under-the-radar stocks and businesses from around the world.
..................................................