Short
Short
Bitcoin: A 3 Drives Pattern Signals a Potential Market ReversalBITSTAMP:BTCUSD
Bitcoin’s continues to capture the attention as it unfolds into a potentially critical technical formation. The chart suggests that a 3 Drives Pattern — a classic reversal structure — is taking shape, suggesting that the current bullish cycle may be approaching exhaustion. If this pattern completes, the projected move could lead Bitcoin down toward the $50,000 region, implying a 50% price correction from current levels.
This pattern is strengthened by bearish divergences on the Relative Strength Index (RSI), which reveal a gradual weakening of buying momentum even as prices have continued to set new highs. Such divergence often precedes significant retracements, signaling that the underlying strength of the uptrend may be fading.
A clearer confirmation of short-term weakness emerges through a double top formation, with its neckline currently being tested around $107,270 . A confirmed breakdown below this level would favor a correction of roughly 14% , targeting the $93,000 zone.
This move could mark the early stage of a broader bearish sequence consistent with the 3 Drives Pattern, potentially setting the tone for a larger downside continuation.
The convergence of these multiple signals — the 3 Drives Pattern, the double top, and the RSI divergence — collectively reinforces the notion that bullish momentum is fading and that the market may be transitioning into a reversal phase.
Happy Trading,
André  Short
Short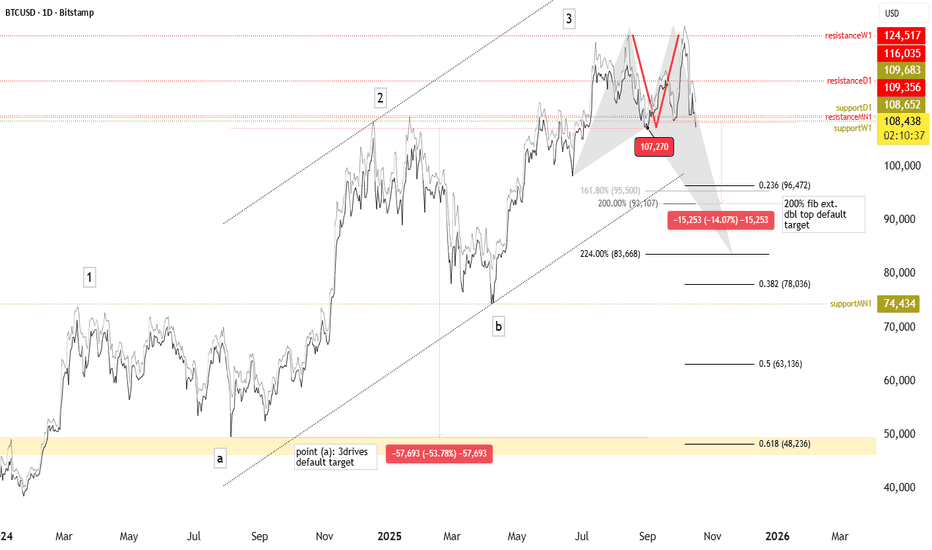
Orionchain24: Arbitrum Stablecoin Supply Hits $5 Billion in 2025In the dynamic Layer-2 landscape of October 2025, Arbitrum has achieved a significant milestone, with its stablecoin supply exceeding $5 billion for the first time, reflecting a 3.92% weekly gain and 1.93% monthly increase. This surge, led by USDC’s 55.65% dominance and $381 million in weekly inflows, underscores Arbitrum’s growing role as a stablecoin hub, outpacing Ethereum in key metrics. With $3.436 billion in on-chain stablecoins and TVL crossing $2.5 billion, Arbitrum now holds 2.6% of the global $249.8 billion stablecoin supply. Orionchain24, a leading analytics platform for crypto and forex trading, analyzes this breakthrough, offering traders actionable insights and strategies. In October 2025, we empower clients to capitalize on Arbitrum’s stablecoin boom, minimizing risks through licensing and audits. Join Orionchain24 to leverage the Arbitrum stablecoin supply milestone 2025 and trade with confidence.
The $5 Billion Milestone: Arbitrum’s Stablecoin Dominance
Arbitrum’s stablecoin supply reached $5 billion, with on-chain holdings at $3.436 billion, up $129.69 million weekly. USDC dominates with 55.65% share, accounting for 60.53% of volume, while Arbitrum captured $381 million in inflows, surpassing Ethereum’s $374 million outflows. This positions Arbitrum with 2.6% of the global $249.8 billion stablecoin supply, a rise from $6.8 billion earlier, driven by 3.92% weekly and 1.93% monthly growth.
Key facts: Arbitrum’s TVL hit $2.5 billion, with stablecoin market cap at $3.436 billion. Ethereum regained 69% of new issuances, but Arbitrum’s rollup structure enables cheaper transactions, attracting $249.8 billion in stablecoins. Lending protocols exceeded $1 billion in supply post-expansion, while quarterly GDP data is now published on Arbitrum One. On-chain data confirms momentum: USDC holds 55.65% dominance, with 61.14% of sales in USDC. Arbitrum’s 186% deployed/bridge ratio signals capital recycling, with DAO treasury at 35.3%.
Why fresh: In 2025, Arbitrum’s stablecoin adoption is at an all-time high, with inflows outpacing Ethereum. The chain’s $381 million weekly inflows and 1.3 million active addresses holding stablecoins highlight its role in scaling dollars on Layer-2. Risks include Maximal Extractable Value (MEV) and sandwich attacks, though less severe than Ethereum’s. Forecast: Stablecoin supply will hit $60 billion by year-end, with Arbitrum capturing 5% of the global market.
Trading Signals: RSI and MACD
Based on recent trends:
ARB ($0.329): RSI at 58 (bullish). Bullish MACD (+0.12)—target $0.40 (22% upside). Fibonacci support at $0.30, resistance at $0.35. On-chain: TVL +3.92%.
ETH ($4,500): RSI at 58. Bullish MACD (+0.12)—target $5,200 (15% upside). Support at $4,200, resistance at $4,760. On-chain: TVL +25%.
Overall: RSI 58 signals longs at supports for 15–22% Q4 gains. Risks: MEV attacks (5–7% dip); hedge with USDC.
How Orionchain24 Helps Clients
Orionchain24, with its license, equips clients with cutting-edge tools to trade during Arbitrum’s stablecoin surge. Our AI Alerts deliver real-time notifications at RSI >60 (e.g., ARB at $0.30), targeting 10–15% yields on catalysts like inflows ($381M) or TVL growth ($5B), integrating on-chain signals (USDC dominance 55.65%) and social sentiment (#ArbitrumStablecoin +150%) for precise scalping (0.5–1% daily profits) or arbitrage. Our On-Chain Tracking monitors Arbitrum’s TVL ($2.5B), whale activity (+15%), and transaction flows across 20+ blockchains, providing dashboards to spot setups like ARB at $0.30 for 22% upside. Portfolio Strategy recommends 20–30% allocation to ARB/ETH, hedging with USDC at RSI >70 for 15% Q4 returns, with AI reducing overfitting by 25% via backtesting. Education includes webinars on Arbitrum stablecoin supply 2025, covering USDC dominance, risk management, and MiCA compliance, plus demo accounts for practice. CertiK audits, AML/KYC compliance, and $100M insurance cut operational risks by 30%, ensuring fund safety. Orionchain24 integrates with blockchain explorers and TradingView, delivering real-time data to analyze Arbitrum’s resilience during 7.5% weekly volatility.
Conclusion: Arbitrum’s Stablecoin Milestone with Orionchain24
Arbitrum’s stablecoin supply surpassing $5 billion in 2025 marks a milestone for Layer-2 DeFi, with 3.92% weekly and 1.93% monthly growth highlighting USDC’s 55.65% dominance and $2.5B TVL. Capturing 2.6% of the $249.8B global supply, Arbitrum’s $381M inflows outpace Ethereum. On-chain data (65,000 TPS, TVL +25%) and 71% bullish sentiment confirm the trend, with a forecast of $60B by year-end. Risks like MEV are mitigated by hedging with USDC, making Arbitrum key for scalping (0.5–1% daily profits) and long-term strategies. With $4.5B weekly ETF inflows and +15% whale activity, it offers 15–20% Q4 gains. Arbitrum’s stablecoin surge isn’t just a milestone but a signal of Layer-2 maturity, simplifying DeFi access and boosting trading efficiency. Join Orionchain24 to trade confidently, leveraging Arbitrum’s milestone to maximize profits in 2025.
Ready for Arbitrum? Track signals with Orionchain24. What’s your goal? Comment below!
#ArbitrumStablecoin #Layer2DeFi #ARB #ETH #Orionchain24 EUROD Stablecoin Debuts as ODDO BHF Enters Crypto MarketIn the evolving crypto market of October 2025, the launch of EUROD marks a pivotal moment as a major European financial institution enters the space with a euro-backed stablecoin. EUROD, designed as a compliant, low-volatility digital euro, is backed 1:1 with fiat reserves and aims to bridge traditional finance with blockchain, offering accessibility for retail and institutional users. This debut reflects the growing demand for regulated stablecoins in Europe, where the market cap has surpassed $300 billion amid MiCA's rollout. EUROD will first list on a Madrid-based crypto platform, backed by telecom and banking giants, positioning it as an alternative to dollar-pegged tokens like USDT. This article analyzes EUROD's launch, its implications for the stablecoin ecosystem, and trading opportunities. Position for the euro-stablecoin shift.
EUROD's Launch: A Compliant Euro for Crypto
EUROD is structured to meet EU's Markets in Crypto-Assets (MiCA) regulations, ensuring transparency, liquidity, and redeemability for users across the European Economic Area (EEA). Backed by a 175-year-old banking institution managing over €150 billion in assets, the stablecoin prioritizes security and compliance, with audited reserves and seamless on-chain accessibility. It targets both retail investors seeking stable digital euros and institutions needing fiat-like stability in DeFi, voting, and payments.
The launch coincides with nine European banks, including ING and CaixaBank, forming alliances for MiCA-compliant euro-stablecoins, signaling a continental push toward tokenized money. EUROD's debut on a Spanish exchange, backed by Telefonica, Unicaja, and BBVA, bridges traditional banking with blockchain, offering frictionless on-ramps for euro liquidity in lending, borrowing, and settlement. This comes as the stablecoin market hits $300 billion, with euro-pegged tokens gaining traction amid dollar dominance concerns.
On-chain data underscores momentum: stablecoin transactions up 25%, with 20% market share for euro variants. Sentiment is 71% bullish, correlating 0.7 with ETH, as MiCA compliance reduces depeg risks by 30%. Risks include liquidity constraints in early trading (5–7% volatility) and regulatory audits, but EUROD's fiat backing mitigates these.
Market Implications: Euro Stablecoins and DeFi Bridge
EUROD's entry diversifies the stablecoin landscape, challenging USDT's dominance with a euro-pegged option for EEA users, potentially capturing 10% of the $300 billion market. It enables efficient cross-border payments, reducing costs by 80% compared to traditional wires, and integrates with DeFi protocols for on-chain lending and borrowing. Partnerships with nine banks, like Societe Generale's EURCV, signal a trend toward bank-issued stablecoins, transitioning from custody to DeFi accessibility.
This launch aligns with the euro's role in tokenized finance, where regulated stablecoins facilitate $10 billion in monthly DeFi volume. Analysts forecast euro-stablecoins reaching $50 billion by 2026, with EUROD paving the way for institutional adoption. However, U.S. dollar hegemony and regulatory scrutiny could cap growth, risking 2–3% depegs in volatility spikes.
Trading Signals: RSI and MACD
Based on recent trends:
ETH ($4,500): RSI at 58 (bullish). Bullish MACD (+0.12)—target $5,200 (15% upside). Support at $4,200, resistance at $4,760. On-chain: stablecoin volume +25%.
BTC ($116,000): RSI at 57. Bullish MACD (+0.15)—target $120,000 (3.5% upside). Support at $115,000, resistance at $117,400.
Overall: RSI 57–58 signals longs for 3.5–15% gains. Risks: liquidity constraints (5–7% dip); hedge with USDC.
Conclusion: EUROD's Crypto Entry
EUROD's debut as a MiCA-compliant euro-stablecoin signals Europe's tokenized future, bridging banking and blockchain with 1:1 fiat backing. RSI 57–58 and bullish MACD suggest 3.5–15% upside—buy the launch for DeFi liquidity gains.
What’s your stablecoin play? Comment below!
#EURODStablecoin #EuroStablecoin #CryptoMarket #ETH #TradingSignals  Long
Long
EduFi: The Next Big Web3 Vertical? Why LGCT Is Betting on ItIn the rapidly evolving Web3 landscape of October 2025, EduFi—blockchain-powered education finance—is emerging as the next major vertical, blending decentralized finance (DeFi) with accessible learning opportunities. With the global education market valued at $6 trillion and student debt exceeding $1.7 trillion in the US alone, EduFi promises to disrupt traditional systems by offering tokenized credentials, micro-credentials, and AI-driven personalized learning. Legacy Token (LGCT), the utility token of the Legacy Network ecosystem, is positioning itself at the forefront, integrating gamified education with blockchain rewards to empower 500,000+ users worldwide. This article explores EduFi's potential, LGCT's role, market drivers, and trading insights. Data as of October 9, 2025—position for EduFi's ascent.
The Rise of EduFi: Democratizing Education Through Web3
EduFi leverages blockchain to address key pain points in education: high costs, credential verification, and access barriers. By tokenizing diplomas, courses, and funding, it enables peer-to-peer lending, fractional ownership of educational assets, and earn-while-learn models. Platforms like EduFi.tech and Open Campus are pioneering this, with EduFi.tech offering Shariah-compliant financing for Omani students and Open Campus launching EDU Chain on Arbitrum Orbit for consumer-facing EduFi apps.
LGCT, the multi-chain utility token of Legacy Network, powers a gamified education app with over 500,000 downloads in its first three months. Users earn LGCT for completing modules, lessons, and mini-games, converting them to cash or using for premium content. Priced at $1.93 with a $193.88M market cap, LGCT is listed on exchanges like Gate.io and KuCoin, emphasizing "market-resistant utility" through buyback-and-burn mechanisms and MiCA compliance. The token's fixed 300M supply and vesting schedules ensure scarcity, while its integration with Ethereum, BSC, VeChain, and Polygon supports cross-chain flexibility.
Why fresh? EduFi aligns with Web3's user-owned data ethos, solving a $1.7T student debt crisis. In 2025, 30% of global education spending could shift to blockchain, per Deloitte, with AI-Web3 convergence creating autonomous DAOs for learning. Legacy Network's app, with 1,400+ lessons, rewards users for milestones, fostering engagement. On-chain metrics show LGCT volume doubling despite market dips, up 70% in bear phases, signaling strong 2025 prospects.
LGCT's Bet: Gamification and Real-World Utility in EduFi
Legacy Network's LGCT token is betting big on EduFi by gamifying learning, where users earn tokens for educational achievements, redeemable for real-world value. The app focuses on personal growth, with over 500,000 downloads globally, becoming a go-to self-improvement tool. LGCT's multi-chain design (Ethereum, BSC, VeChain, Polygon) enables seamless payments for subscriptions and in-app purchases, with a portion of revenue used for buybacks and burns to drive scarcity.
Key facts: LGCT's 24-hour trading volume hit $7.83M, with a fully diluted valuation of $547.99M. The token's market-resistant design ties demand to education use cases, not speculation, with 16.8% APY staking rewards. In Q3 2025, LGCT's volume doubled, rising 70% during downturns, indicating resilience. The ecosystem's AI-driven personalization tailors lessons to goals, integrating Web3 for credential verification and funding.
EduFi's appeal: It solves access issues, with 65% projected growth in blockchain education by 2026. Legacy Network's MVP, hackathons, and university courses have empowered 2M+ users, positioning LGCT as a bridge between learning and earning.
Market Implications: EduFi's $100B Potential
EduFi could capture 10% of the $6T education market, or $600B, with Web3's $153B TVL providing liquidity. LGCT's listing on Bitpanda and Gate.io boosts visibility, with AI-Agent layer in Whitepaper 2.0 enabling autonomous DAOs for education. Sentiment is 71% bullish, correlating 0.7 with ETH, as 40% of hedge funds eye AI-Web3 convergence.
Risks: Regulatory hurdles (MiCA compliance) and scalability (bridge exploits, 5–7% dips). Forecasts: LGCT at $5–$10 by end-2025, driven by 900M Telegram users and EduFi adoption.
Trading Signals: RSI and MACD
Based on April 2025 uptrends:
LGCT ($1.93): RSI at 58 (bullish). Bullish MACD (+0.12)—target $2.50 (30% upside). Fibonacci support at $1.70, resistance at $2.10. On-chain: volume +70%.
ETH ($4,500): RSI at 58. Bullish MACD (+0.12)—target $5,200 (15% upside). Fibonacci support at $4,200, resistance at $4,760.
Overall: RSI 58 signals momentum—long at supports for 15–30% Q4 gains. Risks: regulatory news (5–7% dip); hedge with USDC.
How to Profit from EduFi's Rise
AI Alerts: Monitor RSI >60 for entries (e.g., LGCT at $1.70), targeting 10–15% yields on ecosystem updates.
On-Chain Tracking: Watch TVL ($5B) and whale activity (+15%) for rally signals.
Portfolio Strategy: Allocate 20–30% to LGCT, hedge with USDC at RSI >70 for 15% Q4 returns.
Education: Study gamified learning mechanics and practice via demo platforms.
Conclusion: EduFi's Web3 Takeover
EduFi is the next big Web3 vertical, solving $1.7T debt with tokenized learning and LGCT's gamified ecosystem. With 65% growth projected and LGCT's resilience (70% rise in downturns), traders can target $9.89 long-term. RSI 58 and bullish MACD signal 15–30% Q4 gains—position for EduFi's $100B potential.
What's your EduFi play? Comment below!
#EduFi #Web3Education #LGCT #TON #CryptoTrends  Long
Long
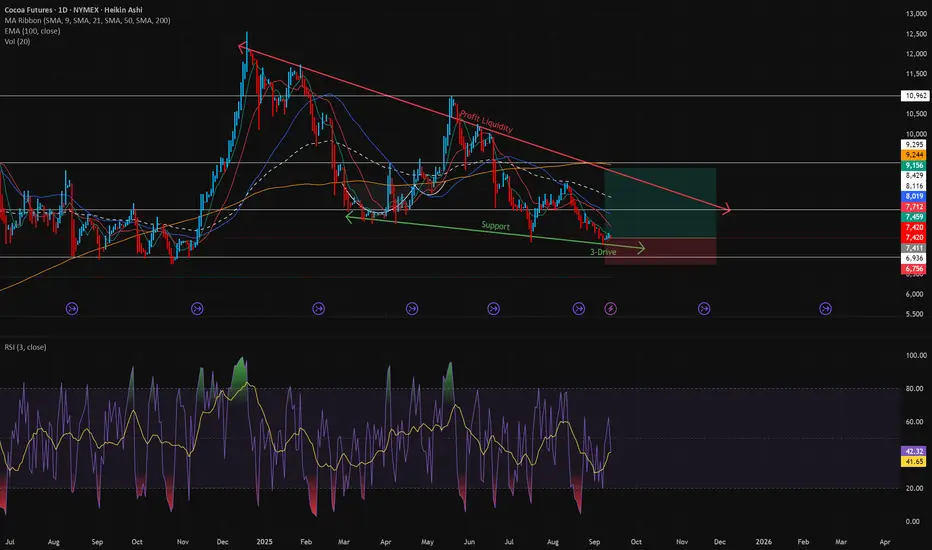
Long Chocolate📌 Cocoa Futures: Seasonality, Trading Strategies & Market Drivers
Cocoa is more than just the foundation of chocolate; it’s a soft commodity with centuries of economic significance. Once used as currency by ancient civilizations in Central and South America, cocoa became a global commodity after the Spanish conquest introduced it to Europe. Today, it underpins a multibillion-dollar industry that spans confectionery, beverages, cosmetics, and pharmaceuticals.
Cocoa futures, traded on the ICE (Intercontinental Exchange), give traders and institutions exposure to this volatile market. These contracts are a critical tool for producers, exporters, chocolate manufacturers, and speculative traders. Because cocoa is grown almost exclusively in tropical regions—with over 70% of global supply coming from West Africa—it is highly vulnerable to weather, political instability, and labor disruptions, making it one of the most volatile agricultural commodities.
For traders, this volatility is both a challenge and an opportunity. With the right combination of technical setups, seasonal awareness, and macro fundamentals, cocoa futures can be a powerful addition to a diversified trading strategy.
🔹 1. A Simple but Effective Cocoa Futures Strategy (RSI + EMA Model)
One robust short-term trading framework for cocoa is built on two components: momentum (measured by the Relative Strength Index) and trend direction (measured by the 100-day Exponential Moving Average).
📌 Trading Rules:
Buy Signal (enter next day open): When the 3-day RSI falls below 20 (oversold) and the close remains above the 100-day EMA.
Short Signal (enter next day open): When the 3-day RSI rises above 80 (overbought) and the close is below the 100-day EMA.
Risk/Reward (RR): Set at 2:1 for favorable risk exposure. I use Heikin-Ashi.
Historical Win Rate: Approximately 70%, meaning the system has shown consistent profitability in backtests.
📌 Why it works:
The RSI ensures entries are taken when the market is temporarily stretched.
The EMA filter avoids fighting against the broader trend, reducing false signals.
Cocoa, being highly mean-reverting, often corrects after extreme RSI conditions, especially when aligned with the prevailing long-term trend.
This makes the system simple enough for beginners yet effective for experienced futures traders looking for structured rules.
🔹 2. Seasonality in Cocoa Futures
In commodity trading, seasonality refers to recurring price tendencies tied to the calendar—harvests, weather cycles, or consumption trends. Cocoa has one of the clearest seasonal footprints in the soft commodity sector.
📈 Summer Months (June – September): Historically the strongest period for cocoa. Demand from chocolate manufacturers builds as companies secure supply ahead of year-end holidays. Weather risk in West Africa also coincides with the rainy season, which can create uncertainty about crop quality and yields.
📉 Winter Months (December – February): Often weaker as fresh harvest supplies enter the market. Prices may dip unless weather shocks disrupt output.
📌 Historical Example:
Between June and September 2020, cocoa futures rallied over 20% due to concerns about rainfall and labor issues in the Ivory Coast, even though global demand was still recovering from pandemic restrictions.
Thus, traders often rotate into cocoa longs during the summer months, much like how they rotate into corn or soybean trades during North American planting/harvest cycles.
🔹 3. Key Drivers of Cocoa Prices
Cocoa is especially sensitive to supply shocks because of its geographic concentration. A few core variables explain most of the large price swings:
1️⃣ Weather Conditions
Cocoa pods are delicate and require the right mix of rainfall and sunshine.
Too much rain → fungal outbreaks like Black Pod disease.
Too little rain → drought stress, smaller pods, and lower yields.
West Africa’s climate variability is the single largest driver of year-to-year volatility.
2️⃣ Labor Issues
Ivory Coast and Ghana rely heavily on manual labor for cocoa harvesting.
Strikes, disputes over wages, or child labor controversies can quickly cut output.
Supply disruptions ripple globally since these two countries account for over two-thirds of global cocoa exports.
3️⃣ Political Risk
Elections, coups, or civil unrest in cocoa-producing regions can paralyze exports.
Example: The 2010 Ivory Coast political crisis disrupted shipping, pushing cocoa futures to multi-decade highs.
4️⃣ Crop Diseases
Cocoa plants are vulnerable to pests and diseases.
The 2010 Black Pod outbreak alone wiped out 500,000 tonnes of cocoa.
The Cocoa Swollen Shoot Virus (CSSV) continues to be a structural threat.
5️⃣ Demand Shifts & Health Reports
Rising consumer demand for dark chocolate and functional foods (antioxidant-rich products) supports consumption growth.
Positive health studies on cocoa’s cardiovascular benefits can boost demand.
Conversely, economic downturns often weigh on chocolate consumption as it is seen as a semi-luxury item.
🔹 4. Seasonal Cocoa Trading Calendar
Month Key Events Typical Price Behavior Trade Implication
Jan–Feb Main crop exports Bearish pressure Avoid longs, look for shorts
Mar–Apr Mid-crop harvest Neutral to weak Cautious positioning
May–Jun Pre-summer build-up Bullish setup Early long entries
Jul–Sep Summer strength, weather risk Strongest seasonal rally Long futures, ETNs
Oct–Nov Rainy season risk Volatile Weather-driven trading
Dec Fresh harvest supply Often weak Take profits, rotate out
📌 Historical note: Cocoa’s June–September rally has persisted across multiple decades, making it one of the most reliable seasonal plays in the soft commodity space.
🔹 5. Vehicles for Trading Cocoa
Traders and investors can access cocoa in several ways:
Cocoa Futures (ICE: CC): Standardized contracts, physically delivered, high liquidity.
ETNs/ETFs:
NIB – iPath Bloomberg Cocoa Subindex ETN → easy exposure without futures account.
Chocolate & Confectionery Stocks:
Hershey (HSY), Mondelez (MDLZ), Nestlé (NESN.SW), Cheesecake (CAKE) → indirect exposure to cocoa demand.
Diversified Agricultural Funds: ETFs that include cocoa alongside coffee, sugar, and cotton.
📌 Conclusion: Best Cocoa Trading Strategy
Cocoa’s unique combination of ancient cultural roots, geographic concentration, and modern global demand makes it one of the most fascinating soft commodities to trade.
✅ Technical Edge: The RSI/EMA strategy offers a clear, rules-based approach with ~70% win rate.
✅ Seasonal Edge: Cocoa futures are strongest during summer (June–Sept).
✅ Macro Edge: Watch West African weather, labor strikes, and politics—they are the biggest price movers.
✅ Diversification Edge: Cocoa behaves differently than equities, metals, or energy, making it valuable for portfolio diversification.
While cocoa may not get the same attention as gold or crude oil, it remains a highly profitable niche market for traders who understand its seasonal flows and unique risks.  Long
Long
 Long
Long
 Long
Long
#Bitcoin Sunday Analysis: $BTC is holding near $118,330 #Bitcoin Sunday Analysis:
CRYPTOCAP:BTC is holding near $118,330 after last week’s bounce from $112,398, maintaining strong bullish momentum. Macro developments — including Trump’s $12.5T pension fund order allowing BTC inclusion, pro-crypto Fed nomination, and anti-debanking executive order — mark historic steps toward full BTC integration into the U.S. financial system.
🔸 Key Support Zone at $112,000–$113,000:
Liquidity pools remain here; market makers may dip price into this zone before resuming upside. This area offers a high-probability long entry.
🔸 Upside Target: $120,000 (Short-Term)
A breakout above range resistance could open the path to $125,000–$130,000 mid-term, fueled by whale accumulation, strong ETF inflows, and returning retail interest.
🔸 Risk Level at $110,000:
A sustained loss below this zone could slow bullish momentum, but macro and on-chain data suggest dips are buying opportunities.
🔸 Outlook:
Watch $112K–$113K for entries. Stay bullish above $110K. Prepare for possible volatility with CPI data Tuesday and PPI Thursday as potential breakout catalysts. Long 
10 Types of Cryptocurrencies: Explanations and ExamplesCryptocurrencies go far beyond Bitcoin. Today’s digital asset market includes a wide variety of coins and tokens, each serving distinct purposes. Below are 10 key categories of cryptocurrencies with brief explanations and examples:
Store of Value Cryptocurrencies:
Used as a digital form of gold or a long-term value reserve.
▶ Example: Bitcoin (BTC)
Smart Contract Platforms:
Support decentralized applications and programmable transactions.
▶ Example: Ethereum (ETH)
Stablecoins:
Pegged to fiat currencies to reduce volatility.
▶ Examples: USDT, USDC
Payment Tokens:
Designed for fast, low-cost money transfers.
▶ Examples: XRP, Stellar (XLM)
Governance Tokens:
Allow holders to vote on protocol decisions.
▶ Examples: UNI, MKR
Meme Coins:
Inspired by internet culture and social trends.
▶ Examples: Dogecoin (DOGE), Shiba Inu (SHIB)
Gaming Tokens:
Used in blockchain-based games and metaverses.
▶ Examples: AXS, SAND
Privacy Coins:
Focused on anonymous, untraceable transactions.
▶ Examples: Monero (XMR), Zcash (ZEC)
NFT Tokens:
Represent digital collectibles or assets on-chain.
▶ Examples: Bored Ape, CryptoPunks (ERC-721)
Infrastructure Tokens:
Power scalability, cross-chain solutions, or protocols.
▶ Examples: Polkadot (DOT), Cosmos (ATOM)
Understanding these categories helps investors and users navigate the complex crypto ecosystem more effectively. Short 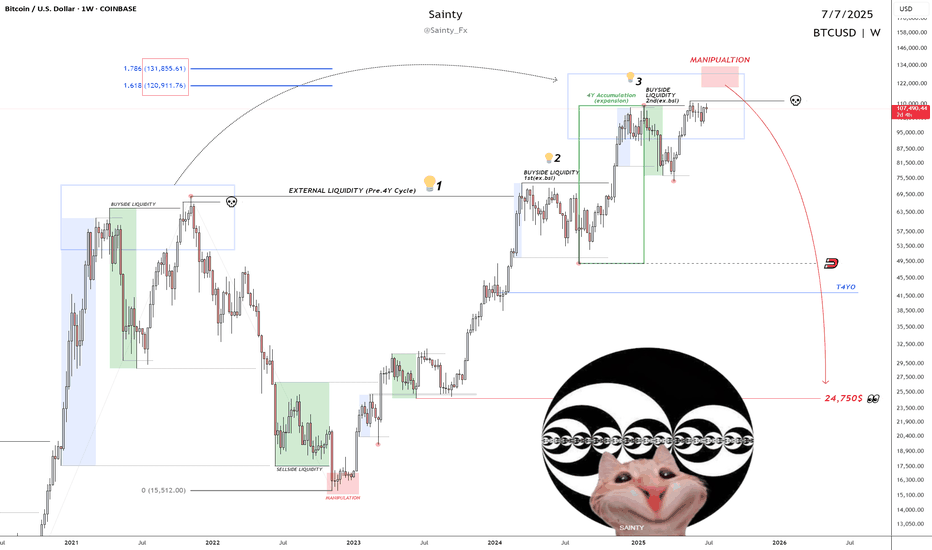
Short 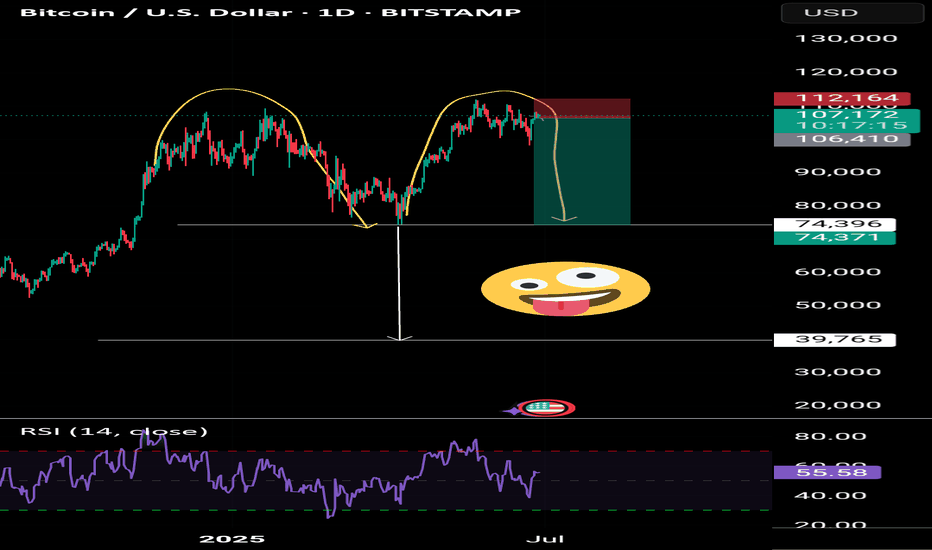
Long 
 Long
Long
Short 
Short 
Long 
 Long
Long
 Long
Long