XAUUSD — Elliott Wave Recovery From 4,286
Gold is showing a strong Elliott Wave recovery after completing the previous bearish wave 5 near the 4,286–4,300 demand area. From Kelly’s view, the current chart suggests that XAUUSD has shifted into a short-term bullish correction structure, but price is now approaching an important Fibonacci sell zone where a pullback may appear first.
The key idea is simple: gold may push higher to complete the current upside wave, then correct into the buy zone before continuing toward the next higher Fi
Trend Line Break
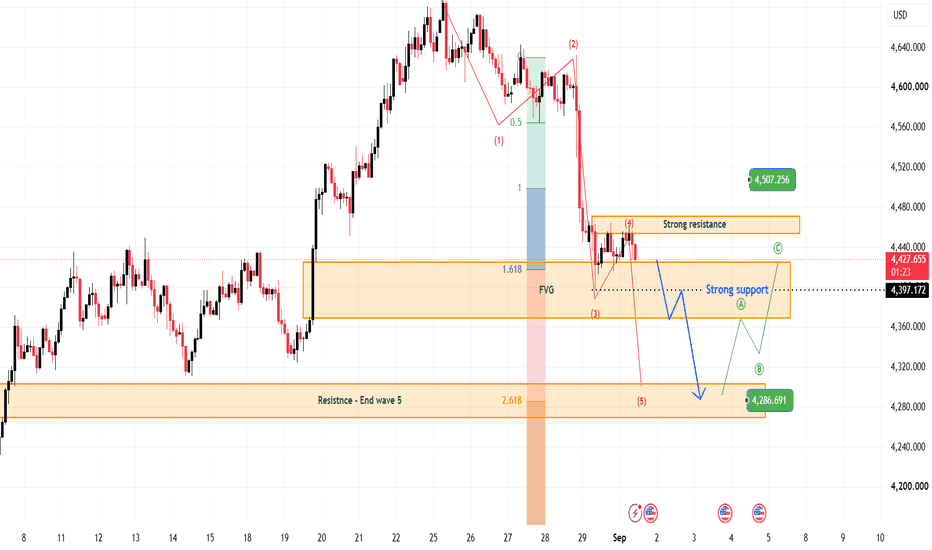
XAUUSD — Bearish Wave 5 Toward 4,286
Gold is still trading inside a bearish Elliott Wave structure after the strong selloff from the upper area. From Kelly’s view, the current chart suggests that XAUUSD may be forming a wave (4) correction under resistance before continuing lower into wave (5).
The key idea is simple: gold is still below strong resistance, and if buyers fail to reclaim the upper zone, the next bearish target remains around 4,286.
⟡ Market Structure
Gold is currently trading around 4,429, right near the upper s
XAUUSD | Trendline Breakout & RetestGold is showing signs of a potential structure shift after breaking above the descending trendline. 📊
🔹 Trendline Breakout → Buyers gained momentum
🔹 Retest Zone → 4,300–4,200
🔹 1D OB + FVG → 4,200–4,100
🔹 First Resistance → 4,600–4,700 🎯
🔹 Major Supply Zone → 4,950–5,050 ⚠️
🔹 Rejection Block → 5,450–5,600
📌 Market Structure
The current setup can be viewed as:
📉 Downtrend → 🚀 Breakout → 🔄 Retest → 📈 Potential Continuation
The 4,300–4,200 area is the key region to watch. A strong reaction fr
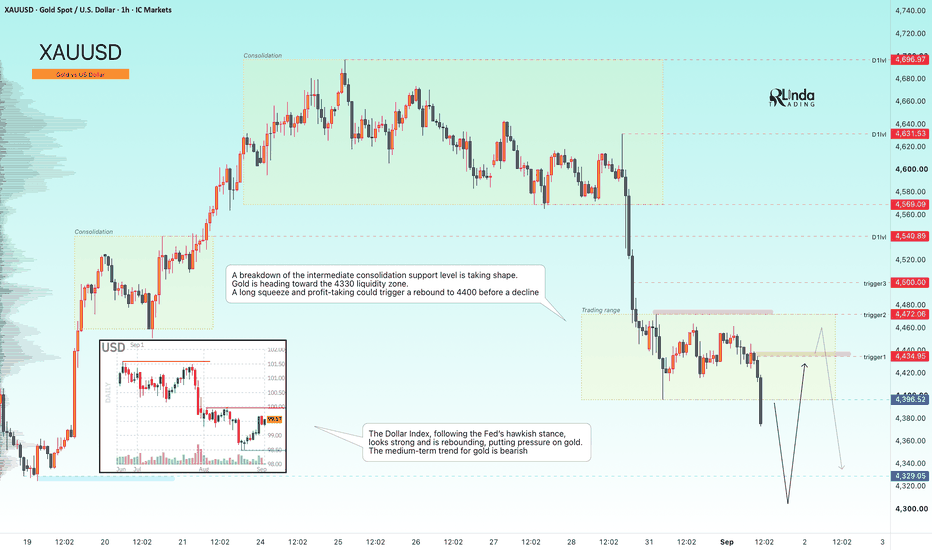
GOLD - Weak fundamentals and a bear market ICMARKETS:XAUUSD remains under selling pressure and continues to decline. Another distribution phase is developing after a short-term consolidation, with the market moving toward the 4,330–4,300 liquidity zone
The Dollar Index looks strong after the Fed adopted a hawkish stance and is bouncing higher, putting further pressure on gold. The medium-term outlook for gold remains bearish.
Gold will remain sensitive to U.S. inflation and labor market data. Central bank purchases and geopolitical
EUR/AUD Rebound at Major Support: Bullish Reversal Setup AheadTechnical Analysis
1. Key Levels & Price Action
Primary Support Zone (1.6110 – 1.6178): Price has recently tested and rejected the lower boundary of a long-term key demand zone around 1.6110 - 1.6178. The highlighted bullish reaction (circled in blue) indicates strong buying pressure and absorption of short positions at these levels.
Current Trading Price: 1.62259 (Daily Candle active).
Intermediate Resistance (1.63094): The immediate upside barrier where short-term sellers may attempt to
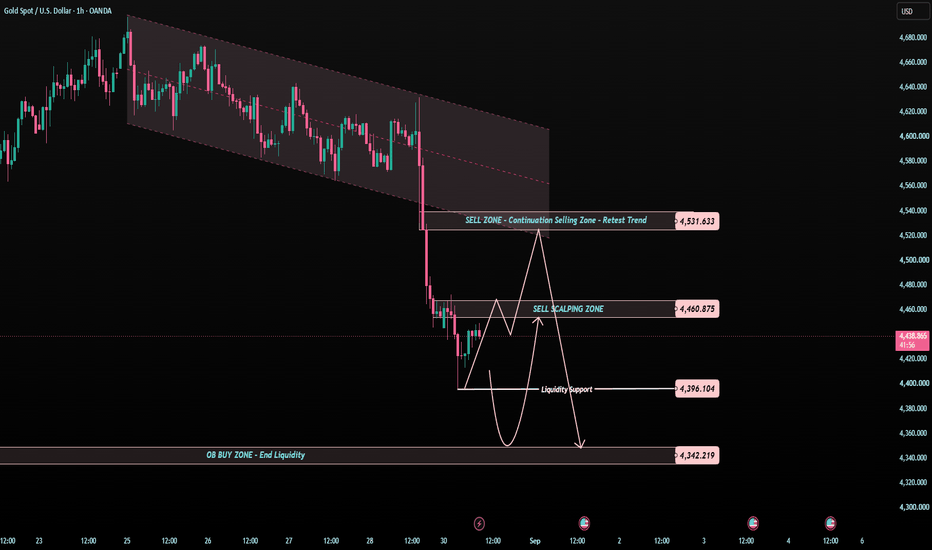
XAUUSD — 4,460 Retest or 4,342 Sweep?Gold is still trading under clear bearish pressure after breaking down from the previous channel structure.
Price is now moving around 4,430 - 4,440 after a sharp selloff.
This is not a clean buy reversal yet.
The market may bounce first, but the bigger structure is still showing seller control.
The simple read
4,396 is the first liquidity support area.
If gold holds above this level, price may create a short-term recovery toward 4,460.
But 4,460 is the Sell Scalping Zone.
If gold reache
SITCo Monday Market Review | Stable Indexes, Weakening BreadthSITCo Monday Market Review | Stable Indexes, Weakening Breadth
Market Regime
The market remains in a Mixed / Risk-Off-tilted regime.
ES and NQ continue to hold their larger balance structures, but the market beneath them weakened. Equal weight, small caps, financials, several megacaps, and international indexes are deteriorating while leadership remains concentrated in selected semiconductors and TSLA.
Risk Posture: Yellow
Risk-On, Risk-Off, or Chop?
Current classification: Mixed / Risk-Of
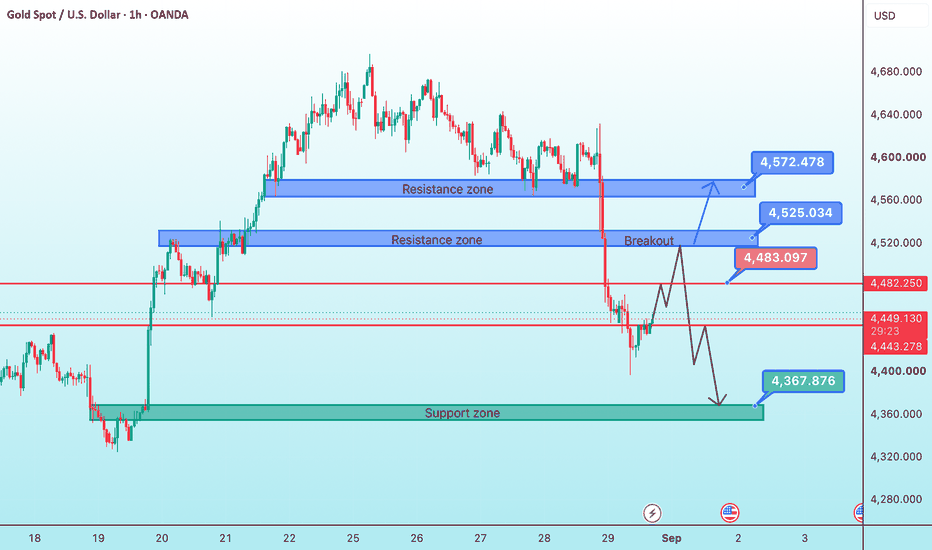
What’s Next for Gold in the New Trading Week?📊 XAUUSD – H1 | Technical Update
Current Price: ~4,448
The current H1 structure is leaning bearish following a strong breakdown below the 4,520–4,525 zone. Price is currently experiencing a technical rebound but has not yet reclaimed the key resistance levels.
🔵 Resistance
* 4,520–4,525: Near-term resistance and former breakout zone → prioritize monitoring price action here.
* 4,560–4,575: Strong resistance; if price rallies into this zone and gets rejected, selling pressure could return.
*
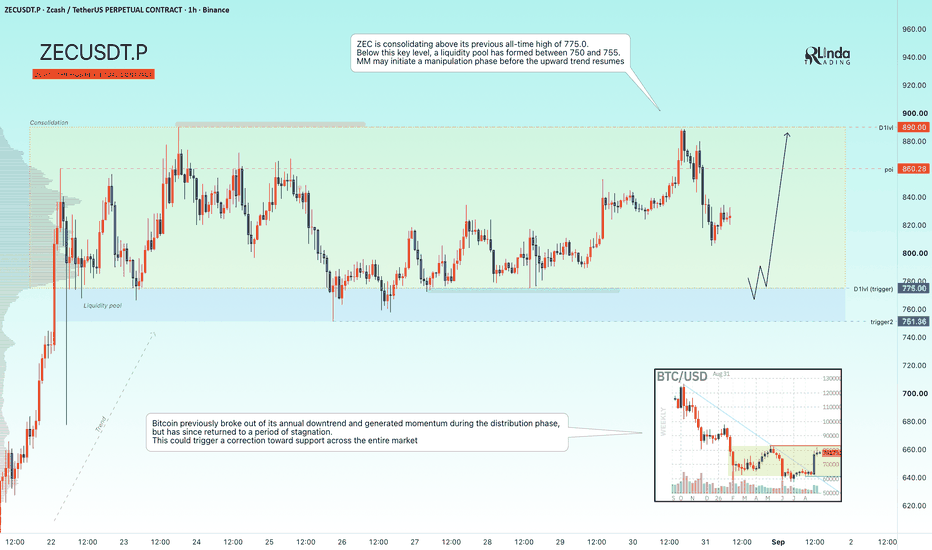
ZECUSDT - Consolidation above the previous ATHBINANCE:ZECUSDT.P currently maintains a bullish market structure and is outperforming the broader market. The altcoin is consolidating above its previous ATH and could continue higher in the medium term
Bitcoin previously broke the structure of its year-long bearish trend and formed an impulse within a distribution phase, but has now entered another period of stagnation. This could trigger a correction across the broader market toward support.
ZEC is consolidating above the previous all-ti
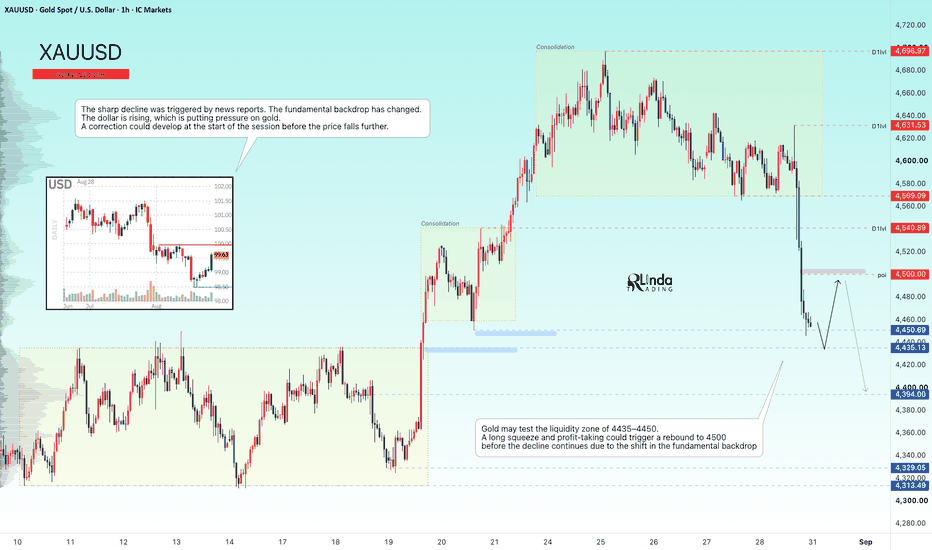
GOLD - A sudden shift in the fundamental backdropICMARKETS:XAUUSD is reacting to the news, specifically the Fed Chair’s speech. The markets have reversed sharply, and the move could continue
Risk-off sentiment has increased significantly following Waller’s hawkish comments. Expectations for a Fed rate hike this year rose sharply on Friday. The strong sell-off was news-driven, and the fundamental backdrop has shifted. The dollar is strengthening, putting pressure on gold. A correction could develop at the start of the session before the d
LINKUSDT - Hunting for liquidity before growthBINANCE:LINKUSDT.P is consolidating within the 11.00–12.00 range following a strong rally. However, corrections are typical within a consolidation phase, and the market could enter a liquidity-hunting phase before moving higher
Bitcoin has entered a consolidation phase after its strong rally. A correction could develop within this consolidation. Overall, the market still has bullish potential, and if the fundamental backdrop remains unchanged, the uptrend could resume soon.
The altcoin is
EUR/USD Daily: Bullish Reversal at Golden Pocket & TrendlineKey Trade Metrics
Direction: Buy / Long
Timeframe: Daily (1D)
Entry Zone: $1.1478 – $1.1531 (50%–61.8% Fibonacci Confluence)
Target / Take Profit: $1.1801 (Major Daily Resistance / Supply Zone)
Stop Loss: Below $1.1355 (100% Retracement / Recent Swing Low)
Technical & Market Structure Analysis
Trendline Breakout & Retest:
EUR/USD has broken out of its multi-month descending trendline, signaling a potential shift in market structure from bearish to bullish. The current price action shows a na
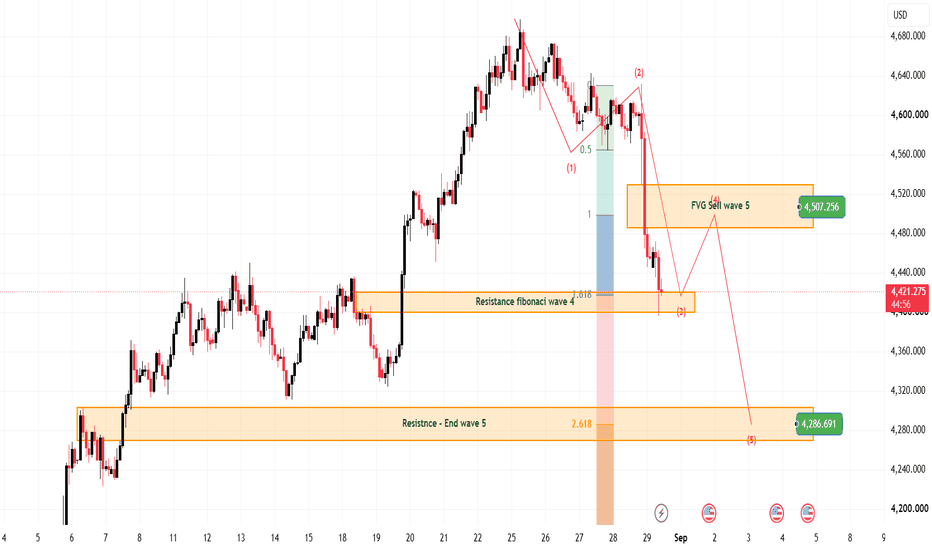
XAUUSD — Wave 4 Rebound Before Wave 5
Gold is showing a clear bearish Elliott Wave structure after the strong rejection from the upper area near 4,620–4,640. From Kelly’s view, the current chart suggests that XAUUSD may have already completed wave (3) into the 4,400–4,425 zone, and the market could now build a corrective wave (4) before continuing lower into wave (5).
The key idea is simple: gold may rebound first, but as long as the recovery stays below the sell FVG zone, the larger short-term structure still favors another bear
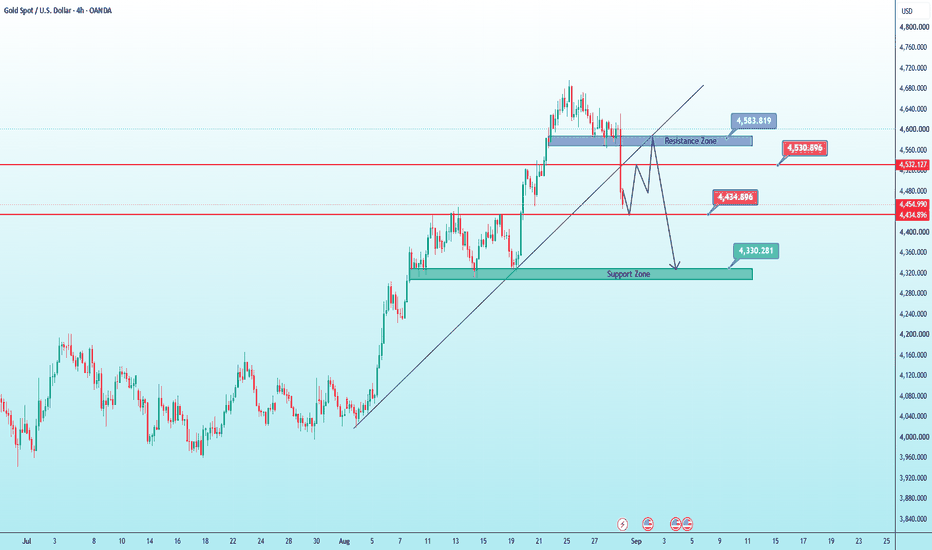
Will gold regain its position in the new week?Based on this XAU/USD H4 chart, the structure has changed noticeably compared with the previous charts: price has broken below the short-term bullish trendline and is currently trading below the 4,530 area. Therefore, in the short term, we need to be cautious with the BUY side.
🔴 Resistance
1. 4,530 – 4,585 — Main Resistance Zone
This is the Resistance Zone marked on the chart.
The 4,583.819 level is the upper boundary worth paying attention to.
Price has now fallen below this zone, so if it
BTC/USD: Bearish Retest of Broken Wedge & Golden Pocket ResistanBitcoin (BTC/USD) on the 1-hour timeframe has broken out below its upward-sloping channel/wedge structure and is currently staging a corrective pullback back toward the broken support-turned-resistance zone.
Key Resistance Zone ($78,600 – $79,700): This area intersects with the underside of the broken trendline, a horizontal resistance zone, and the Fibonacci retracement levels (38.2% to 61.8% Golden Pocket).
Target Levels: A rejection from this confluence zone indicates a potential drop down
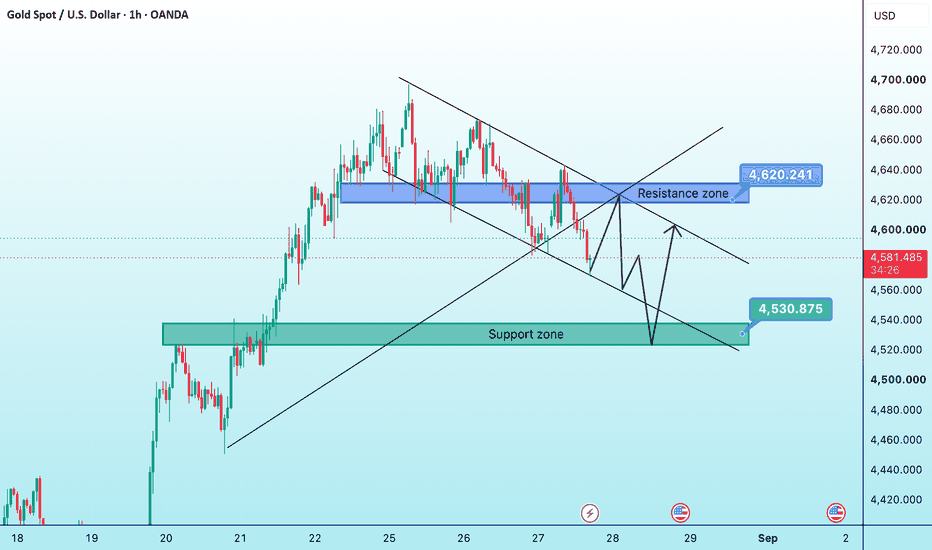
Will Gold Experience a Sharp Drop Today?📊 XAUUSD – H1 | Technical Update
Current Price: ~4,581
* 🔵 Major Resistance: 4,620–4,630 — Strong supply zone, also aligned with the descending trendline. This is the key area that will determine the short-term direction.
* 🟠 Intermediate Resistance: 4,600–4,610 — An area where a technical rebound may occur before price retests 4,620.
* 🟢 Major Support: 4,520–4,540 — Important demand zone, corresponding to the previous support area.
* 📉 Trendline: The short-term bearish structure remains intac
XAUUSD — Bullish Wave 5 Setup From Buy FVG
Gold is starting to build a bullish recovery structure after defending the lower area near 4,570–4,580. From Kelly’s view, the current chart suggests that XAUUSD may be forming a new Elliott Wave upside sequence, with the latest pullback acting as wave (2) before price attempts to continue higher into wave (3), wave (4), and finally wave (5).
The key idea is simple: if gold continues to hold above the Buy FVG zone, the bullish structure remains valid and the next upside target may open toward
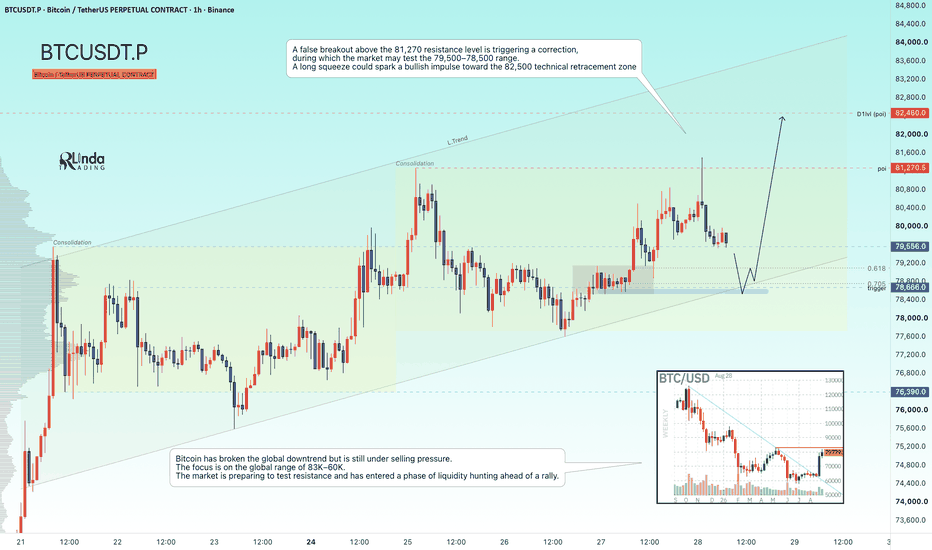
BITCOIN - Correction ahead of the rally to 83K...BINANCE:BTCUSDT.P , after a strong rally, has entered a consolidation phase. The market has not yet reached the technical pullback zone around 83K and could form a correction to build up liquidity before the next impulse.
Bitcoin has broken its global bearish trend but is still under selling pressure. We can start talking about a bullish market if Bitcoin closes above 83K and continues its upward momentum.
For now, the key focus remains on the broader 83K–60K range. The market is preparing
GOLD - The Hunt for Liquidity Ahead of a Rally ICMARKETS:XAUUSD continues its corrective phase due to the locally strengthening Dollar Index. On the D1 timeframe, price is consolidating above the intermediate range, and the market may give us an opportunity
The dollar is forming a counter-trend correction, which is also putting pressure on gold.
Gold maintains its bullish momentum amid a weaker dollar and positive medium-term market sentiment. The key events are the employment data and Waller’s speech. Technically, the target is a brea
NZDJPY - A long squeeze triggers a bullish rally FX:NZDJPY is returning to the range after a correction and a market-maker trap and could continue higher within the broader bullish trend
The Japanese yen is entering a corrective phase after its recent pump, which could support the pair as the yen weakens.
A long squeeze is forming around the liquidity zone near range support. The trend remains bullish, and a close above 94.70 could trigger an impulse toward 95.20–95.40
Resistance levels: 95.16, 95.40
Support levels: 94.70, 94.30
If t
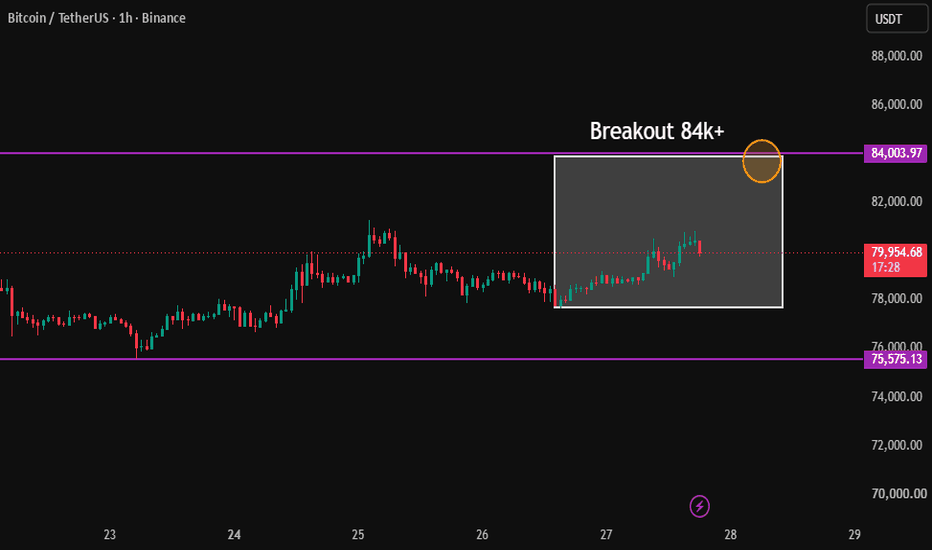
BTC:USDT CAN GAIN INTO THE COMING 24H+ up 84K as BULLRUN STARTEDBitcoin is still runing positive, and bulls are in control of trend.
There is huge chance we can see in the coming 24H a whale breakout, which can change more effect in price and getting BTC possible at 84k+, this is exactly what we are going to follow since the cycle activation.
Yes Bitcoin did confirm the bullrun 2026, and the cycle is actived, we have seen on every bullrun confirmed, that trend did change at unexpected moment with real whale volume, and this also what we expect this year 20
XAUUSD — Bearish Structure Below 4,600
Gold is starting to lose upside momentum after rejecting from the upper side of the rising channel. From this chart, the latest rebound still looks corrective, which keeps the short-term bias tilted to the downside and supports the idea of one more bearish leg.
⟡ Market structure
Price previously advanced inside an ascending channel, but after peaking near the upper boundary, momentum faded and the market began to print a weaker lower-high sequence. The Elliott Wave structure on the chart su
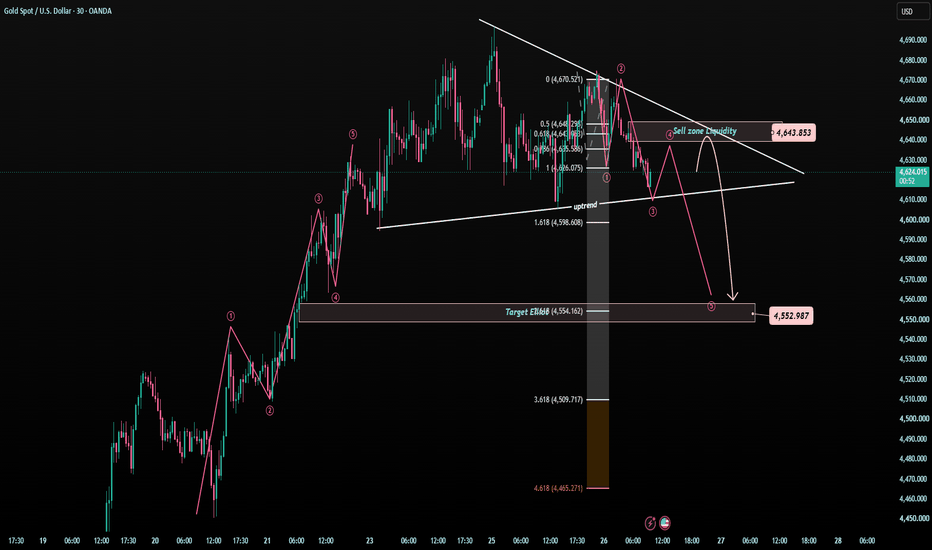
XAUUSD — 4,643 Trap or 4,553 Sweep? Gold is now trading inside XAUUSD — 4,643 Trap or 4,553 Sweep?
Gold is now trading inside a very sensitive compression area.
After the strong bullish run, price is no longer expanding cleanly. The market is now moving between the short-term uptrend support and the descending resistance line.
This is where the next move can become sharp.
The simple read
Gold is currently trading around 4,620 - 4,630.
The first resistance to watch is 4,643.
This area is marked as the Sell Zone / Liquidity Zone and also sits near the
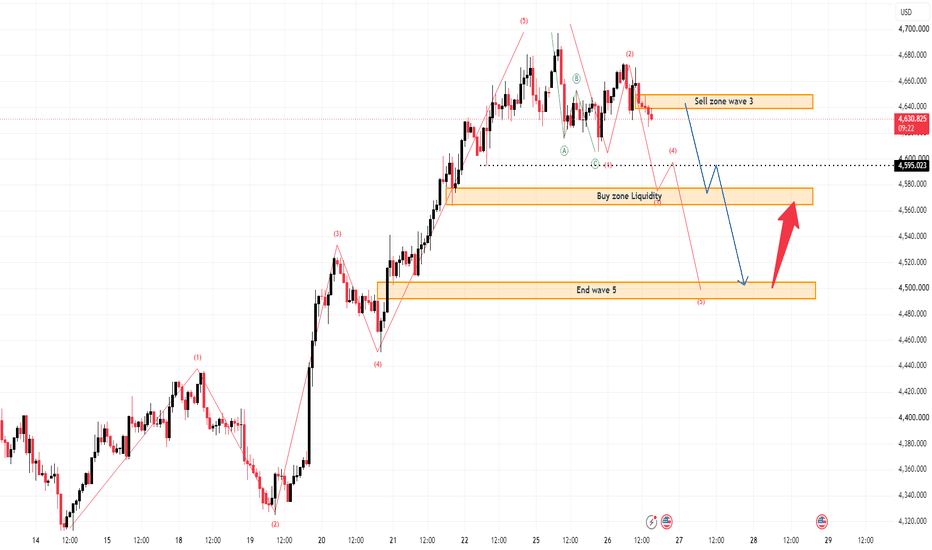
XAUUSD – Bearish Wave Toward 4,500
Gold is showing a short-term bearish Elliott Wave structure after failing to extend higher from the recent top. From Kelly’s view, price is now reacting under the wave 3 sell zone, which keeps the downside scenario active. If sellers stay in control, gold could continue lower, first into the liquidity buy zone, then deeper toward the end wave 5 area.
⟡ Market Structure
The current structure suggests gold may be building a fresh downside leg after the rejection near the upper resistance area.