 Long
LongTriangle
Long
GOLD - Consolidation before growth. Positive background?ICMARKETS:XAUUSD is holding above $4,300 on Tuesday after pulling back from the six-day high of $4,369 reached during the previous U.S. trading session. The three-day rally has given way to consolidation, leaving room for further gains
Gold is currently in a phase of strong technical recovery, driven by a combination of geopolitical optimism and a reassessment of inflation risks. The market is entering the upcoming Federal Reserve meeting in a much more balanced position than it was immediately after the jobs report.
The market is awaiting two key events: the June 16–17 Federal Reserve meeting (including the updated dot plot and Chair Warsh’s press conference) and the official signing ceremony of the peace agreement in Geneva on June 19.
If the Fed’s dot plot proves less hawkish than the market expects and Friday’s signing ceremony confirms progress, gold could test 4426–4476 and continue higher. However, if Warsh confirms a high probability of further rate hikes in the second half of the year and the details of the agreement disappoint, gold may enter a corrective phase
Resistance levels: 4363, 4426, 4476
Support levels: 4306, 4268, 4246
A false breakout of 4363 is triggering a correction (the reaction remains weak), while gold continues to consolidate above the key support zone at 4300–4310. Fundamentally, the local backdrop is improving and providing support to the market. A rebound from the 4300 area could lead to a move toward 4426–4476
Best regards,
R. Linda
 Long
Long
HYPEUSDT - Ready for the trend to continue BINANCE:HYPEUSDT.P continues to maintain its overall bullish trend and appears poised to resume its upward movement following the recent correction. Despite weakness in Bitcoin, the altcoin remains resilient and has a strong chance of retesting its all-time high.
After a period of consolidation during the corrective phase, the market is transitioning back into a rally phase and looks poised to continue higher. The coin continues to demonstrate notable relative strength, and in the medium term, it may challenge its all-time high. The broader weakness across the cryptocurrency market has had limited impact on HYPE, aside from the wave of negative news in early June that triggered panic and capital outflows.
The fundamental outlook for HYPE continues to improve, giving traders an opportunity to target the 70.0–75.0 range.
Resistance levels: 65.80, 70.0, 72.4
Support levels: 64.0, 62.40
Technically, the price remains in a bullish cycle. The key trigger is 65.800—a close above this level could open the door for the rally to continue.
Best regards, R. Linda
 Long
Long
Symmetrical Triangle Pattern: A Setup That Rewards Patience1. Price Starts to Tighten
After a strong move, the market stops trending and begins to create lower highs and higher lows. This forms a symmetrical triangle, showing that buyers and sellers are reaching a balance.
2. Momentum Builds Inside the Pattern
As the triangle gets smaller, volatility decreases and price movements become tighter. This often signals that a powerful move is getting closer.
3. Volume Tells the Story
During the formation of the triangle, trading volume usually drops. A sudden increase in volume during the breakout can be a strong confirmation that momentum is returning.
4. The Breakout Changes Everything
A daily candle closing above the upper trendline suggests that buyers have taken control. Many traders wait for this confirmation instead of entering early.
5. Managing Risk Is Simple
A practical stop loss can be placed below the last higher low or just under the lower trendline. This keeps the trade disciplined and limits unnecessary losses.
6. Measuring the Target
The expected target is often calculated by measuring the widest part of the triangle and projecting the same distance from the breakout point. This provides a logical price objective instead of guessing.
7. Final Thoughts
The Symmetrical Triangle pattern is not about predicting the market—it is about waiting for confirmation. When combined with strong volume, trend direction, and proper risk management, this pattern can offer high-quality trading opportunities while keeping the strategy simple and consistent.
 Education
CRUDE OIL (WTI): Pullback From Key Level
I think that WTI Crude Oil is positioned to pull back
from a key horizontal support level.
As a confirmation, I see a breakout of a resistance line
of a symmetrical triangle pattern on an hourly time frame.
Goal - 82.00
❤️Please, support my work with like, thank you!❤️
I am part of Trade Nation's Influencer program and receive a monthly fee for using their TradingView charts in my analysis.
 Long
Long
CDL VictoryShares ETF, long 77.7, sl 75VictoryShares US Large Cap High Div Volatility Wtd ETF Strong buying momentum, Lack of selling pressure, Higher lows
 Long
Long
NTRS Nothern Trusn Corporation, long 174, sl - 165Strong buying momentum, Lack of selling pressure, Higher lows
 Long
Long
ARCC - Ascending triangle - UptrendARCC has formed an ascending triangle on the daily chart.
**Stop Loss:** 49.00
**Targets:**
- T1: 54.50
- T2: 58.50
**Resistance at 60.00:** If the price closes above this level, the stock could reach new highs and continue its uptrend. In such a scenario, it's advisable to use a trailing stop instead of fixed targets.
*Disclaimer:* This analysis is based on chart data and is not investment advice. Consult your account manager before making any investment decisions.
Good luck!
 Long
Long
Gold Finds Support at 4,170, Recovery Toward 4,340 PossibleHello traders! Here’s my technical outlook based on the current XAUUSD (2H) chart structure. XAUUSD has been trading below a long-term descending trendline after breaking down from a broad consolidation range. Multiple failed recovery attempts confirmed continued seller dominance and kept the broader trend bearish. Currently, XAUUSD is trading above the 4,170 Buyer Zone while remaining below the 4,340 Seller Zone. Price recently rebounded from support and broke above a short-term resistance line, signaling improving bullish momentum. As long as XAUUSD holds above the 4,170 Buyer Zone, the recovery scenario remains valid. A continuation higher could push price toward the 4,340 Seller Zone (TP1). However, a breakdown below support would weaken the bullish outlook and favor renewed selling pressure. Please share this idea with your friends and click “Boost” 🚀
Long
GOLD - Countertrend correction may continueICMARKETS:XAUUSD continues its correction amid a temporary pullback in the U.S. Dollar Index. Technically, this remains a countertrend move. All eyes are now on geopolitical developments and the upcoming Federal Reserve rate decision
Gold is caught between geopolitical support and intense macroeconomic pressure, compounded by the technical break below the 200-day SMA. Wall Street analysts continue to maintain a predominantly bearish outlook.
The U.S. dollar is currently correcting after a false breakout above the 100.0 level. Technically, however, the index remains in a bullish trend, which continues to weigh on gold amid ongoing geopolitical uncertainty.
Against the backdrop of both local and global bearish trends, the market is developing a countertrend corrective phase. The focus remains on the 4246–4170 range. Fundamentally, gold lacks strong support, although a local bullish reaction is currently visible. The market is targeting the 4325–4368 liquidity zone before a potential continuation lower
Resistance levels: 4246, 4315, 4347
Support levels: 4170, 4100, 4057
I expect the local bullish impulse to continue. Before extending higher, gold may retest the 4180–4170 area. A long squeeze could trigger an advance toward 4315–4347. However, a short squeeze around the resistance zone could increase selling pressure and lead to a decline toward 4170–4100.
Best regards,
R. Linda
Short
GBPJPY 15M | Descending Triangle Near BreakdownGBPJPY continues to trade below a descending trendline, forming a potential Descending Triangle on the 15-minute timeframe. Price remains compressed between falling resistance and key support, suggesting a breakout may be approaching.
As long as the trendline remains intact, the bearish continuation scenario remains favored. A decisive break below support could trigger the next downside leg toward lower liquidity levels.
📉 Bias: Bearish
🎯 Focus: Triangle Breakdown
⚠️ Invalidation: Sustained move above trendline resistance
Trade the reaction, not the prediction.

 Short
Short
MESM June 12: Mother bar low at 7375 is keyMESM analysis for Friday, June 12
MESM printed a 4H mother bar, and for today that slightly shifts my tone toward a bounce setup, but only as long as the key support level continues to hold.
On the 4H chart, the most important level for me is 7375, which is the low of the previous 4H mother bar. As long as price stays above that level, I think the bounce setup remains valid.
If bulls stay in control, then the first upside target I’m watching is 7491. If price can push through that level, then the next upside target is the 4H gap around 7532.
If price loses 7375, then I think the bounce idea weakens and price could continue lower toward 7330.
On the 1H chart, the structure supports the same idea. 7375 is still the main line in the sand. If price revisits and loses that level, selling pressure could step back in.
On the 15M chart, there is also a lower fair value gap / order block lining up in the green zone below, which could become the next reaction area if price breaks down.
Key levels
7375 = low of the 4H mother bar / key support
7491 = first upside target
7532 = 4H gap / second upside target
7330 = downside target if support fails
Lower green zone = possible reaction area if price breaks lower
Plan for today
Slightly bullish while price holds 7375
Watch 7491 first on the bounce
If bulls stay strong, watch 7532 next
If price loses 7375, watch for downside toward 7330
Not financial advice. No confirmation, no trade. CME_MINI:MESM2026
 Long
Long
GOLD - Countertrend correction to the liquidity zoneFollowing the false breakout below the 4030 support level, ICMARKETS:XAUUSD is rebounding higher, with recent shifts in the geopolitical backdrop adding fuel to the move. However, the market remains bearish overall.
Optimism sparked by Trump's decision to cancel major strikes against Iran and renewed hopes for a deal has been replaced by fresh clashes in the Strait of Hormuz. Geopolitical instability remains elevated. Against this backdrop, the U.S. Dollar Index continues to hold firm, putting pressure on gold. Hotter-than-expected U.S. inflation data has reinforced expectations of a 0.25% Fed rate hike in December. Sellers are therefore likely to remain in control.
Key catalysts ahead include consumer sentiment and inflation expectations data on Friday, as well as the first Federal Reserve meeting under the new Chair, Kevin Warsh, next week. Geopolitics will continue to play a decisive role
Resistance levels: 4246 – 4315 – 4368
Support levels: 4171, 4100, 4060
The market is reacting to the false breakdown of support, resulting in a countertrend correction. Gold is moving toward a key liquidity zone, with the main area of interest located between 4315 and 4368.
A short squeeze within this zone would confirm a liquidity-driven manipulation and could trigger a reversal, leading to a move lower toward the next key areas of interest.
Best regards,
R. Linda
Short
BTCUSDT: Signals Potential Upside From Demand Zone To 64KHello traders! Here’s my technical outlook based on the current BTCUSDT (2H) chart structure. BTCUSDT previously traded inside a broad consolidation range before breaking below support and starting a strong bearish trend. After the breakdown, price continued to decline beneath a descending trendline, while multiple bearish breakouts confirmed that sellers remained firmly in control. Currently, BTCUSDT is trading above the 60,500 Buyer Zone while remaining below the 64,000 Seller Zone. Price recently rebounded from support and attempted to recover, but the descending trendline and resistance zone continue to cap bullish momentum. As long as BTCUSDT holds above the 60,500 Buyer Zone and respects the ascending support line, a short-term recovery scenario remains valid. A bounce from current levels could push price toward the 64,000 Seller Zone (TP1). Please share this idea with your friends and click “Boost” 🚀
Long
USOIL | 4H Descending Triangle Breakdown📉
WTI Crude is breaking key support near $86, signaling a potential continuation of the downtrend.
🔹 Price has been forming a descending triangle, with lower highs compressing toward support.
🔹 Current break below $86 confirms bearish momentum.
🔹 Immediate downside targets: $77.5 and $70 , aligned with previous structural lows.
🔹 Traders may watch for brief pullbacks toward the broken support before continuation.
⚠️ Trend remains strongly bearish while below $86.
#CrudeOil #USOIL #Trading #TechnicalAnalysis #WTI
Short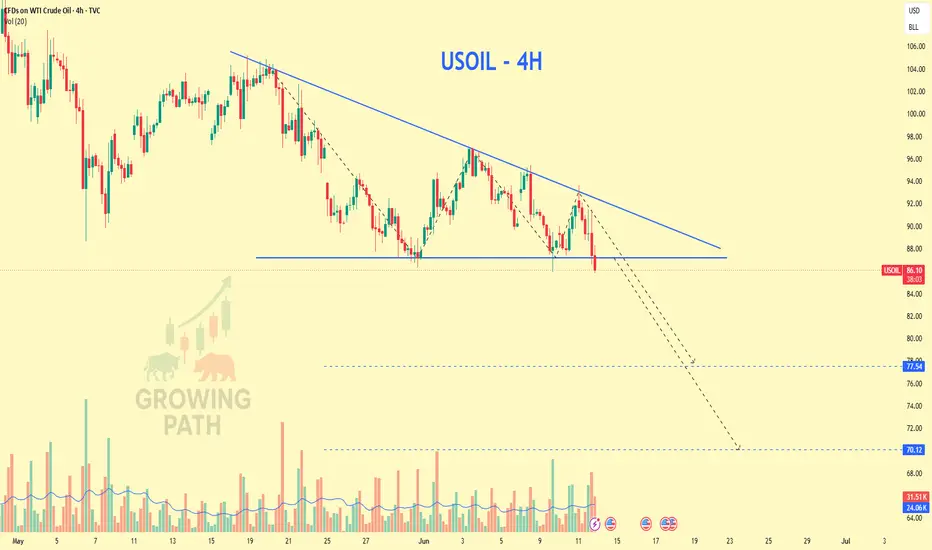
US30 Strategy: Reclaiming the Deviation & Short Squeeze1. Market Context
As shown in the $1\text{H}$ chart of image_131178.png, US30 recently broke below a critical support level at $50,375$. However, the breakdown was short-lived. The price quickly swept liquidity at the major historical support near $49,750$ and initiated a sharp, aggressive rebound. Currently, the price is trading at $50,147.3$, recovering within the lower consolidation range ($49,750 - 50,375$) and heading toward the red descending trendline.
2. Psychology & Price Action Analysis
• The Bear Trap (Deviation): The break below $50,375$ triggered panic and induced retail breakout traders to enter short positions. Instead of continuing downward, institutional buyers absorbed this selling pressure at $49,750$, turning the breakdown into a massive "Bear Trap" (Deviation).
• The Trendline & Resistance Squeeze ($50,375$): As the price recovers, trapped sellers are holding underwater positions. The red descending trendline and the $50,375$ horizontal level form a major confluence of resistance. A successful breakout above this zone will force these sellers to cover their positions (market buy orders), triggering a classic short squeeze that will rapidly drive the price into the upper expansion zone ($50,375 - 51,010.7$).
3. The Trade Setup (Rebound & Breakout Play)
We target an entry on the current recovery momentum, anticipating a breakout and a full reclaim of the broken range.
• Entry: $50,148$ (Current market rebound momentum).
• Stop Loss (SL): $49,747.7$ (Placed safely below the deviation/liquidity sweep low).
• Take Profit 1 (TP1): $50,375$ (Horizontal resistance & red trendline confluence).
• Take Profit 2 (TP2): $51,010.7$ (Targeting the top of the upper expansion box / key structural swing high).
• Risk-to-Reward Ratio (R:R): $\approx 2.15:1$ (Calculated based on TP2).
 Long
Long
EURUSD - Consolidation before downward distributionFX:EURUSD maintains its medium-term bearish trend and may continue to decline against the backdrop of a strong DXY
The pair remains in consolidation within the 1.1500–1.1560 range as the market awaits the outcome of the ECB meeting, including the rate decision and Christine Lagarde's press conference. Any signals from the ECB may have only a short-term impact given the strength of the U.S. Dollar Index, which continues to benefit from an unstable geopolitical environment.
On the daily chart, EURUSD remains in a downtrend after breaking and closing below the 200-day moving average in May. Price is currently consolidating within the narrow 1.1530–1.1572 range, building a base for the next move following the ECB meeting
Resistance levels: 1.1575, 1.1584, 1.1661
Support levels: 1.1527, 1.1506, 1.1450
Within the prevailing downtrend, the currency pair may continue moving lower. A breakout from consolidation and a close below 1.1527 could trigger a further decline toward 1.1450.
Best regards,
R. Linda

 Short
Short
XAUUSD Bears Stay in Control: Is 4,080$ the Next Target?Hello traders! Here’s my technical outlook based on the current XAUUSD (1H) chart structure. XAUUSD was previously trading inside a broad descending channel after reversing from a major high. During the decline, price formed several consolidation phases, but each recovery attempt failed near the channel resistance, confirming persistent bearish pressure. Currently, XAUUSD is trading below the 4,200 Seller Zone while holding above the 4,080 Buyer Zone. Price recently broke beneath the channel support and the 4,200 resistance area, extending the downside move and keeping sellers in control. As long as XAUUSD remains below the 4,200 resistance level, the bearish outlook stays valid. A short-term pullback toward the 4,200 Seller Zone is possible, but if resistance holds, price could continue lower toward the 4,080 Buyer Zone (TP1). Please share this idea with your friends and click “Boost” 🚀
Short
Gold Forms a Possible Rebound To The Resistance Level of 4380$Hello traders! Here’s my technical outlook based on the current XAUUSD (4H) chart structure. XAUUSD has been trading under a long-term descending trendline after reversing from a major high. Several consolidation ranges formed during the decline, but each recovery attempt failed to break the bearish structure, confirming continued selling pressure. Currently, XAUUSD is trading below the 4,380 Seller Zone after a strong bearish breakout from both the ascending support line and the recent range structure. Price has now reached the 4,310 Buyer Zone, which acts as the next key support area. As long as XAUUSD remains below the 4,380 resistance level and continues to respect the descending trendline, the bearish scenario remains valid. A short-term rebound toward the 4,380 Seller Zone (TP1) is possible, but failure to reclaim resistance could lead to further downside. Please share this idea with your friends and click “Boost” 🚀
Long
BITCOIN - Correction before the decline. Bearish trend BINANCE:BTCUSD.P remains in a bearish trend on both the local and global timeframes. Following the sharp sell-off and the formation of a new low, the market has entered a corrective phase, which may not last long
Bitcoin remains trapped in a deeply bearish structure after failing to establish acceptance above the 64,500 resistance zone and being rejected from that area on Tuesday. On both the daily and weekly timeframes, the market is returning to retest key technical levels. Technically, there is still no sign of strong institutional buying activity, and during this countertrend correction the market may form another short squeeze before continuing lower. From a medium-term perspective, Bitcoin may extend its decline toward major historical support levels at 53,500–49,000.
Resistance levels: 62350, 64250
Support levels: 60700, 59700
Bitcoin's global bearish structure remains intact. The market is testing the key 60K support zone, but the reaction remains relatively weak. As a result, the probability of a continuation lower is increasing. The next major downside target is 53K.
Technically, the market has left significant liquidity above the key daily level, as well as a liquidity pool above 64,250. A short squeeze into these areas could trigger a move lower toward the key zones of interest
Best regards, R. Linda
Short
AXSM Therateupics long 245.5 , sl. - 215.5Strong buying momentum, Lack of selling pressure, Higher lows
 Long
Long
INOD Innodata, long 122, sl - 102Level breakout with aggressive buying, lack of selling, and higher lows.
 Long
Long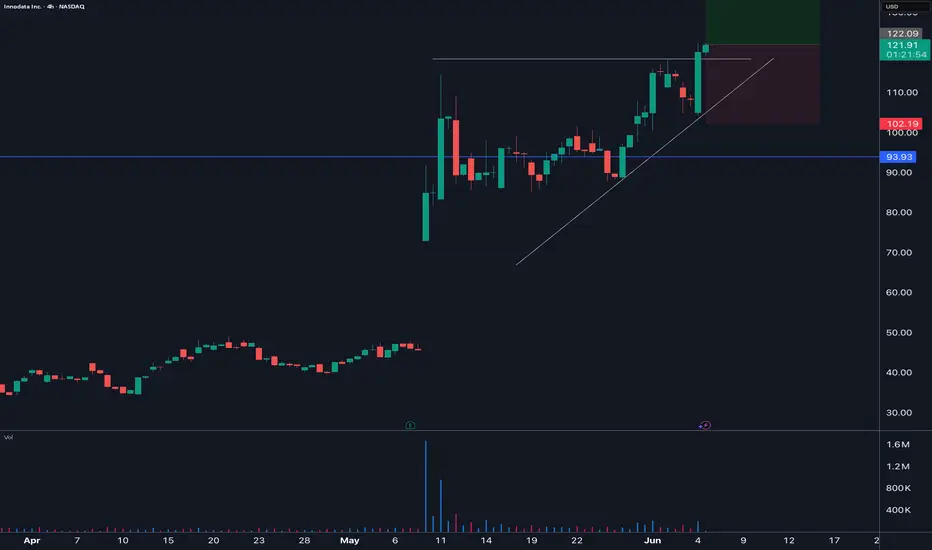
GOLD - A countertrend correction before a decline ICMARKETS:XAUUSD is in a corrective phase after printing a new low at 4268. Both the local and global bearish trends remain intact; however, the geopolitical backdrop continues to be unstable
Gold is undergoing a fundamental and technical shift to the downside, driven by several factors acting simultaneously: a sharp increase in expectations for further Fed rate hikes (now above 70% by December), a break and close below the 200-day moving average for the first time since October 2023, a stronger U.S. dollar above the psychological 100.0 level, and rising Treasury yields toward the 4.55–4.57% range
Technically, the market remains under pressure, and short positions continue to be the preferred strategy. A short squeeze into a liquidity zone could trigger another sharp decline toward support and lower target levels. However, a sudden positive shift in the fundamental backdrop could invalidate the local bearish structure
Resistance levels: 4353, 4368, 4400
Support levels: 4311–4300, 4268
The U.S. dollar is consolidating after a strong rally but shows no signs of weakness. This technical factor continues to weigh on an already bearish gold market.
From a technical perspective, gold may perform a retest of resistance as part of a liquidity-hunting move. A short squeeze into the 4380–4400 area could trigger a decline toward the key zones of interest at 4300–4250
Best regards, R. Linda
Short