GOLD - A hunt for liquidity ahead of a drop to 4,400 ICMARKETS:XAUUSD has found itself in a difficult position: the Federal Reserve's hawkish stance and a strong U.S. dollar continue to weigh on the metal. Following the latest advance in the dollar, price has entered a liquidity-hunting phase
On June 17, the first FOMC meeting under new Fed Chair Kevin Warsh took place. The Committee unanimously kept interest rates unchanged within the 3.50%–3.75% range. However, the market is still pricing in one full rate hike this year, and the Fed's hawkish outlook continues to support an already bullish U.S. Dollar Index, creating additional pressure on gold.
Gold is currently trapped between three major forces: the Fed's hawkish pivot, the cancellation of negotiations in Geneva, and the technical breakdown of key support levels.
Technically, the market is forming a countertrend correction toward key liquidity zones before a potential continuation of the broader decline
Resistance levels: 4171, 4200, 4219
Support levels: 4123, 4052, 4000
Following another sharp decline, gold has stabilized around the local support level at 4123. The market may develop a corrective move aimed at sweeping liquidity before the next leg lower. The primary area of interest remains 4200–4220. A short squeeze within this zone could trigger another decline toward 4120–4050
Best regards,
R. Linda  Short
Short
 Short
Short
 Long
Long
ICICIGI Three White Soldiers Within a Large Ascending Triangle📊 ICICI Lombard General Insurance: Daily Technical Snapshot – Three White Soldiers Emerging Within a Large Ascending Triangle
📊STWP Equity Snapshot
________________________________________
MARKET STRUCTURE SNAPSHOT | NSE: ICICIGI | DAILY
________________________________________
• Closing Price: 1,839.00 (+48.50 | +2.71%)
• Core Trend: Downtrend (Weakening) / Recovery Structure Emerging
• Market State: Consolidation Near Breakout Zone
• Price Structure: Ascending Triangle Formation with bullish reversal characteristics
________________________________________
OPERATIONAL PRICE GRID & KEY REFERENCE LEVELS
________________________________________
• Model Reference Level: 1,844.00
• Hard Invalidation Level: 1,669.50
• Structural Risk: 174.50 (9.46%)
• Resistance Levels: R1 1,860.23 | R2 1,881.47 | R3 1,918.90
• Support Levels: S1 1,801.53 | S2 1,764.07 | S3 1,742.83
• Range Structure: Low 1,671.80 | High 1,908.90
• Higher Timeframe Observation Zones: 2,018.50 | 2,193.00
________________________________________
MOMENTUM, PARTICIPATION & CPR DATA
________________________________________
• Volume Profile: 539.56K Shares
• Volume Character: Normal Participation
• RSI Metric: 58.80 (Bullish Momentum Recovery)
• ADX Reading: 12.78 (Weak Trend Environment)
• ROC: +6.12%
• MACD Status: Recovery Phase | Momentum Improving
• Stochastic Reading: 97.10 (Strong Momentum Zone)
• Current Bias: BUY ON PULLBACKS
• CPR State: Bullish Zone | CPR Moving Up (Wide)
• Today's CPR: Pivot 1786.20 | Top 1788.35 | Base 1784.05
• Tomorrow's CPR (Projected): Pivot 1822.75 | Top 1830.90 | Base 1814.65
________________________________________
📚 EDUCATIONAL OBSERVATION
________________________________________
ICICI Lombard is displaying a constructive technical structure after spending several months consolidating within a broad contracting range. Price action has developed into what appears to be a large Ascending Triangle pattern, characterized by rising lows and a relatively stable resistance zone near the 1,900 region. Such formations often reflect gradual accumulation as buyers become increasingly willing to absorb supply at higher prices.
The dashboard identifies a Three White Soldiers pattern with an estimated reliability of approximately 64%, suggesting a strong bullish reversal signal following a period of weakness. Recent candles demonstrate improving buyer participation, with price recovering sharply from the lower boundary of the triangle and approaching the upper resistance region once again.
Momentum indicators are beginning to support the improving structure. RSI has recovered to 58.80 and remains comfortably above the neutral zone, indicating strengthening buying pressure. ROC has turned positive at 6.12%, while Stochastic readings near 97 reflect strong short-term momentum. ADX remains relatively low at 12.78, indicating that a powerful directional trend has not yet fully developed despite the recent improvement in price behavior.
The projected CPR structure remains bullish and has shifted higher, with tomorrow's Pivot projected near 1,822.75. Rising CPR structures generally indicate improving market acceptance of higher price levels and often support continuation moves when price remains above the projected range.
From a broader structural perspective, the most important level remains the descending resistance trendline near the 1,900–1,920 zone. A decisive breakout above this region could complete the larger Ascending Triangle structure and potentially shift market focus toward the higher timeframe observation zones near 2,018 and 2,193. Until such a breakout occurs, the stock remains in a consolidation-to-recovery phase rather than a confirmed expansion phase.
From a business perspective, ICICI Lombard continues to benefit from growing insurance penetration in India, increasing awareness of health and general insurance products, and long-term expansion opportunities within the domestic insurance sector. While technical analysis remains the primary focus of this report, the broader sector backdrop remains supportive for long-term growth.
Support and resistance levels should be treated as observation zones rather than predictive targets. Chart patterns, momentum indicators, volume analysis, and CPR frameworks are educational tools that help market participants understand evolving market structure within a disciplined risk-management framework.
________________________________________
⚠️ Disclaimer
________________________________________
• This analysis is provided strictly for educational and informational purposes.
• This is not financial, investment, or trading advice and should not be considered a recommendation to buy or sell any security.
• Stock market investments are subject to market risks, including the possible loss of capital.
• Past performance, historical observations, chart patterns, and technical indicators do not guarantee future results.
• Please conduct your own research and consult a SEBI-registered financial advisor before making investment decisions.
• STWP assumes no responsibility or liability for any financial loss arising directly or indirectly from the use of this information.
 Long
Long
BTCUSDT: Faces Triangle Resistance – Bearish Pullback At 63,6K?Hello everyone, here is my breakdown of the current BTCUSDT setup.
Market Analysis
BTCUSDT previously traded inside a well-defined downward channel, where sellers maintained control after a strong decline from the local highs. Following multiple bearish breakouts, price reached a major pivot low and started a recovery phase, eventually breaking out of the channel and shifting momentum back to the upside.
Currently, BTCUSDT is trading inside a large symmetrical triangle formation between the 67,000 Resistance Zone and the 63,600 Support Zone. Recent bullish momentum pushed price into the upper boundary of the triangle, but the market is now showing signs of rejection from the resistance area.
My Scenario & Strategy
As long as BTCUSDT remains below the 67,000 Resistance Zone and continues to respect the triangle resistance line, the bearish scenario remains valid. A rejection from current levels could trigger a pullback toward the 63,600 Support Zone (TP1), where buyers may attempt to defend the market again.
However, if BTCUSDT breaks above the resistance zone and confirms a triangle breakout, the bearish outlook would weaken and a stronger bullish continuation could follow.
That’s the setup I’m tracking. Thank you for your attention, and always manage your risk.  Short
Short
XAUUSD: Retest of Resistance May Trigger Another Decline To 4240Hello everyone, here is my breakdown of the current XAUUSD setup.
Market Analysis
XAUUSD has been trading under a long-term descending trendline after failing to sustain a previous recovery. A breakout below the triangle support triggered a strong bearish move, and price continued lower through several key support levels, confirming seller dominance.
Currently, XAUUSD is trading below the 4,360 Resistance Zone while holding near the 4,240 Support Zone. After a sharp decline, price has staged a short-term rebound and is now retesting the former resistance area from below, where bearish pressure may return.
My Scenario & Strategy
As long as XAUUSD remains below the 4,360 resistance level and continues to respect the broken structure, the bearish scenario remains valid. A rejection from current levels could push price back toward the 4,240 Support Zone (TP1).
However, a breakout above resistance would weaken the bearish outlook and open the door for a stronger recovery.
That’s the setup I’m tracking. Thank you for your attention, and always manage your risk. Short 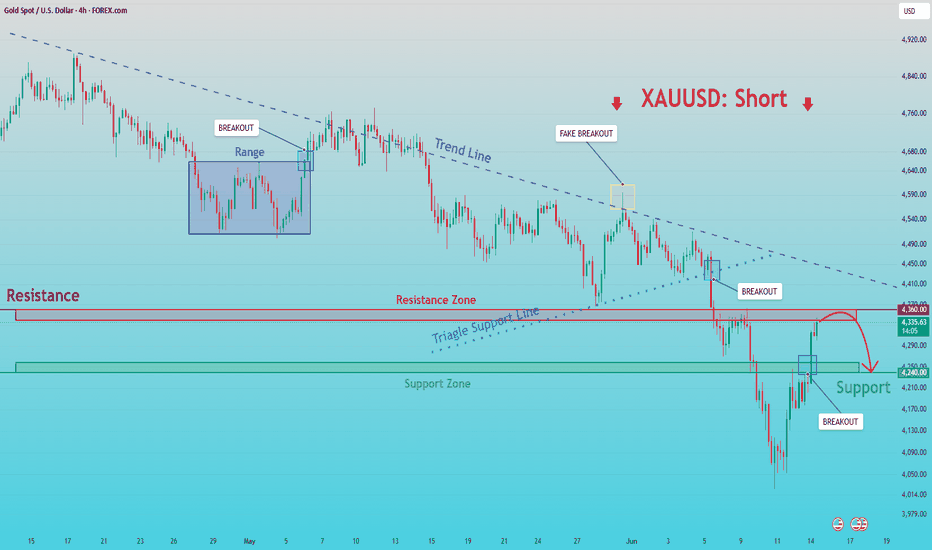
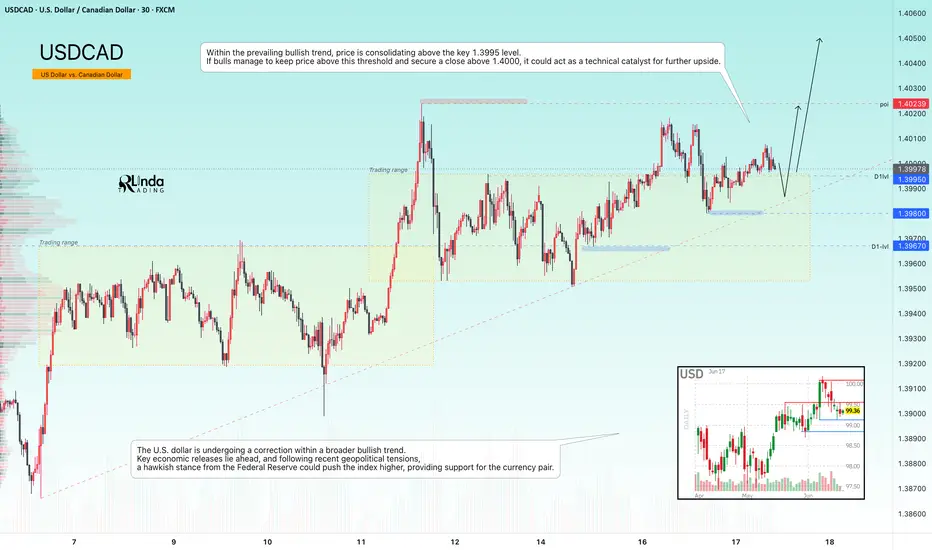
USDCAD - Retest of 1.40. Markets are awaiting the Fed's decisionFX:USDCAD maintains a strong bullish trend and is testing the 1.4000 resistance level while attempting to hold above this key threshold. The Federal Reserve meeting is now in focus
USDCAD has entered a consolidation phase ahead of major news events, with the primary focus on the Fed's interest rate decision and comments from the new Fed Chair
The U.S. dollar is currently correcting within a broader bullish trend. With key economic releases approaching and geopolitical tensions still in the background, a hawkish stance from the Federal Reserve could push the Dollar Index higher, providing additional support for the currency pair.
Resistance levels: 1.4000, 1.4024, 1.4100
Support levels: 1.3995, 1.3980, 1.3967
Within the prevailing bullish trend, price is consolidating above the key 1.3995 level. If bulls manage to defend this area and secure a close above 1.4000, it could become a technical catalyst for further upside
Best regards,
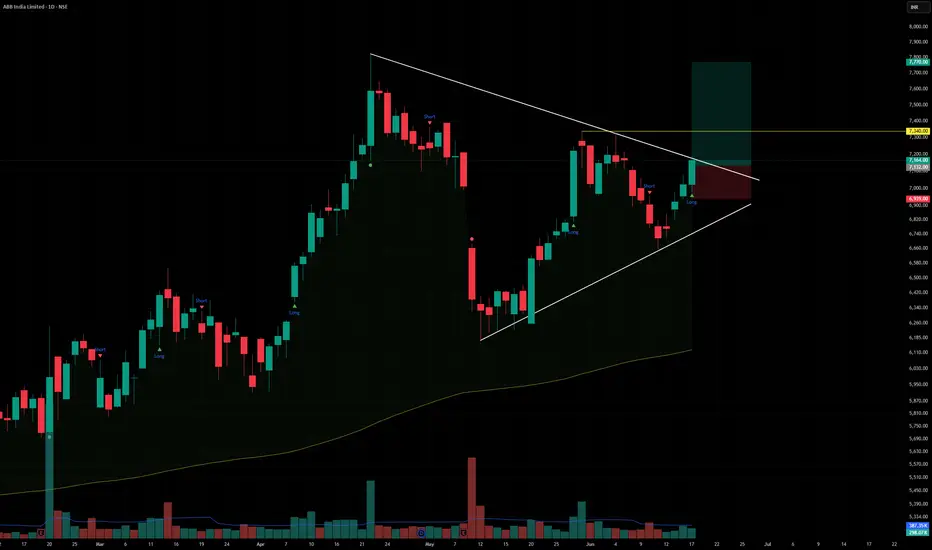
R. Linda ABBABB India Ltd. (CMP ₹7,164.00, NSE: ABB)
Prepared by Sucrit Patil | The SmartWay Research Desk | 18 June 2026
A Bengaluru‑based engineering and automation company, incorporated in 1949. ABB India operates across electrification, robotics, industrial automation, and motion solutions, serving power, manufacturing, transport, and infrastructure sectors.
Promoter Holding (Mar 2026): ABB Asea Brown Boveri Ltd. — 75.00% stake (no pledges)
FY22–FY26 Snapshot
Revenue Growth: FY26 revenue ₹12,842 Cr vs ₹11,215 Cr in FY25 (+14.5% YoY). → Good
Net Profit: FY26 PAT ₹1,215 Cr vs ₹1,048 Cr in FY25 (+15.9% YoY). → Good
Operating Margin: FY26 EBITDA ₹2,312 Cr, margin 18.0% vs 17.2% last year (+80 bps). → Good
Equity Capital: Stable, face value ₹2. → Good
Dividend Policy: Dividend ₹25.00/share declared for FY26. → Good
Asset Building: Investments in robotics, EV charging, and smart grid solutions. → Good
Sales: Strong demand from industrial automation and electrification projects. → Good
Expense: Raw material cost pressures (steel, copper) remain. → Neutral/Good
EPS: FY26 EPS ₹72.15 vs ₹62.20 last year (+16%). → Good
Institutional Interest & Ownership Trends (Mar 2026)
Promoter Holding: 75.00% (no pledges)
FII Holding: 8.12%
DII Holding: 10.34%
Retail & Others: 6.54%
Strategic Moves & Innovations
Expansion in EV charging infrastructure and smart grids.
Focus on industrial robotics and automation solutions.
Partnerships with state utilities for electrification projects.
Diversification into renewable energy integration and digital solutions.
Cash Flow & Balance Sheet Strength
Market cap ~₹1,52,800 Cr.
Debt‑to‑equity ratio ~0.18 (low leverage).
Book value per share ₹412.00; P/B ~17.4.
EPS (TTM) ₹72.15; P/E ~99.3.
Risk Factors
High P/E ratio ~99.3, indicating premium valuations.
Dependence on industrial capex cycles.
Exposure to commodity price volatility (steel, copper).
Competition from Siemens India, Schneider Electric, and GE India.
Investor Takeaway
ABB India has delivered robust FY26 performance, supported by electrification, automation, and robotics demand. With strong promoter backing, dividend payouts, and leadership in industrial technology, ABB remains a premium play on India’s industrial automation and electrification growth story. At CMP ₹7,164.00, valuations are expensive (P/E ~99.3, P/B ~17.4), reflecting high growth expectations but also significant risk.  Long
Long
BlackRock ($BLK): Symmetrical Triangle CompressionBlackRock ( NYSE:BLK ): Symmetrical Triangle Compression – Range Inefficient Trading vs. Macro Breakout Vectors
### 💼 BlackRock Inc. ( NYSE:BLK ) Daily Technical Framework (Ref: BLK_2026-06-17_10-12-33.png)
We are tracking a highly defined, multi-month structural compression pattern on BlackRock Inc. ( NYSE:BLK - NYSE) on the Daily (1D) chart.
The stock concluded its last formal session up **+0.29% at 1,052.23**, with pre-market data prints hovering slightly lower near **1,050.11**. Price action is now deeply locked inside a massive, tightening **Symmetrical Triangle** framework, which is developing within a broader macro consolidation trading range.
---
### 🔍 Structural Geometry & Cluster Confluence:
1. **The Overhead Descending Trendline (LTB):** Connecting the structural lower highs since the January peaks. Price is currently expanding upward toward a retest of this diagonal supply barrier (as indicated by the immediate blue arrow).
2. **The Lower Ascending Trendline (LTA):** Formed by the consecutive higher lows established since March, providing a reliable demand floor for swing long positions.
3. **The Exponential Moving Average Cluster:** Both the long-term **200-period EMA (blue line at 1,046.25)** and the intermediate **72-period EMA (red line at 1,039.72)** have completely flattened out and entangled. This behavior is a textbook indicator of a non-trending, highly compressed market equilibrium where moving averages act as an axis rather than a dynamic trend guide.
4. **The Macro Range Limits:** The overall accumulation block is heavily defined by two major horizontal boundaries: resistance supply at **1,108.48** and a key historical demand floor at **985.17**.
---
### ⚡ Operational Playbook: Two-Phase Execution
* **Phase 1: Inside-the-Range Mean Reversion (Immediate Setup)**
As long as the price remains bound within the converging boundaries of the triangle, the optimal strategy focuses on range-bound execution. Traders can look to deploy capital to short/sell near the upper diagonal LTB and buy/long near the lower diagonal LTA, capturing the rotational waves (noted by the alternating blue and red internal vectors).
* **Phase 2: The Apex Volatility Expansion (The Breakout Setup)**
As the price action pushes closer to the apex of the triangle, volatility will inevitably collapse before exploding into a directional expansion. We must maintain high alertness for a decisive daily candle close outside either trendline boundary:
* **Upside Escape:** A clean breakout above the LTB opens a rapid liquidity pocket to test the **1,108.48** macro ceiling.
* **Downside Escape:** A breakdown below the LTA (as projected by the large red extension arrow near the apex) will signal a major institutional distribution phase, paving the way for a sharp wave downward into the crucial macro baseline support floor at **985.17**.
### Summary:
Trade the boundaries with tight risk definitions for now, but save core allocation capacity for the ultimate breakout confirmation.
---
📊 **ChartPro Data** | By Rogerio Zaglia
*Institutional Asset Research, Geometric Compression & Systematic Range Management.*
⚠️ **Disclaimer:** For educational and informational purposes only. This technical analysis represents a personal trading framework and does not constitute financial or investment advice.  Long
Long
GOLD - Consolidation before growth. Positive background?ICMARKETS:XAUUSD is holding above $4,300 on Tuesday after pulling back from the six-day high of $4,369 reached during the previous U.S. trading session. The three-day rally has given way to consolidation, leaving room for further gains
Gold is currently in a phase of strong technical recovery, driven by a combination of geopolitical optimism and a reassessment of inflation risks. The market is entering the upcoming Federal Reserve meeting in a much more balanced position than it was immediately after the jobs report.
The market is awaiting two key events: the June 16–17 Federal Reserve meeting (including the updated dot plot and Chair Warsh’s press conference) and the official signing ceremony of the peace agreement in Geneva on June 19.
If the Fed’s dot plot proves less hawkish than the market expects and Friday’s signing ceremony confirms progress, gold could test 4426–4476 and continue higher. However, if Warsh confirms a high probability of further rate hikes in the second half of the year and the details of the agreement disappoint, gold may enter a corrective phase
Resistance levels: 4363, 4426, 4476
Support levels: 4306, 4268, 4246
A false breakout of 4363 is triggering a correction (the reaction remains weak), while gold continues to consolidate above the key support zone at 4300–4310. Fundamentally, the local backdrop is improving and providing support to the market. A rebound from the 4300 area could lead to a move toward 4426–4476
Best regards,
R. Linda Long 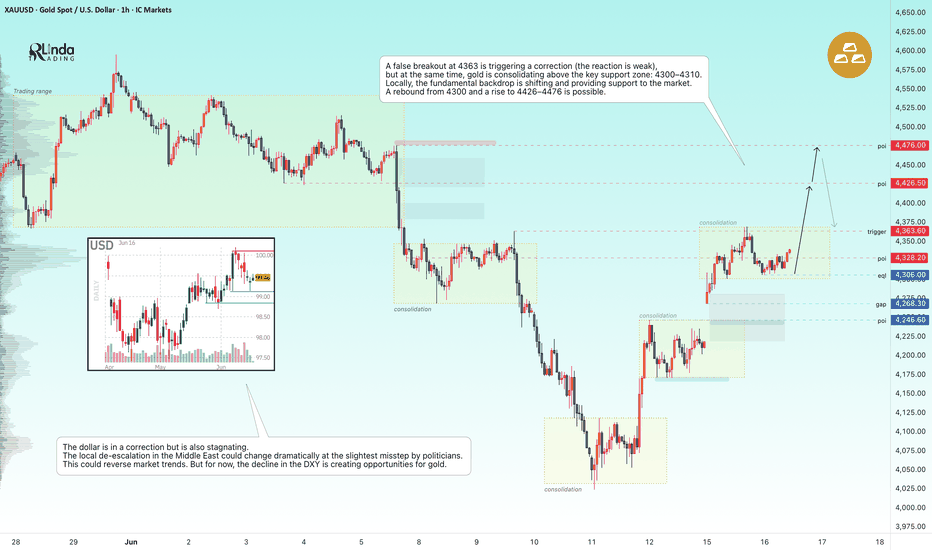
HYPEUSDT - Ready for the trend to continue BINANCE:HYPEUSDT.P continues to maintain its overall bullish trend and appears poised to resume its upward movement following the recent correction. Despite weakness in Bitcoin, the altcoin remains resilient and has a strong chance of retesting its all-time high.
After a period of consolidation during the corrective phase, the market is transitioning back into a rally phase and looks poised to continue higher. The coin continues to demonstrate notable relative strength, and in the medium term, it may challenge its all-time high. The broader weakness across the cryptocurrency market has had limited impact on HYPE, aside from the wave of negative news in early June that triggered panic and capital outflows.
The fundamental outlook for HYPE continues to improve, giving traders an opportunity to target the 70.0–75.0 range.
Resistance levels: 65.80, 70.0, 72.4
Support levels: 64.0, 62.40
Technically, the price remains in a bullish cycle. The key trigger is 65.800—a close above this level could open the door for the rally to continue.
Best regards, R. Linda  Long
Long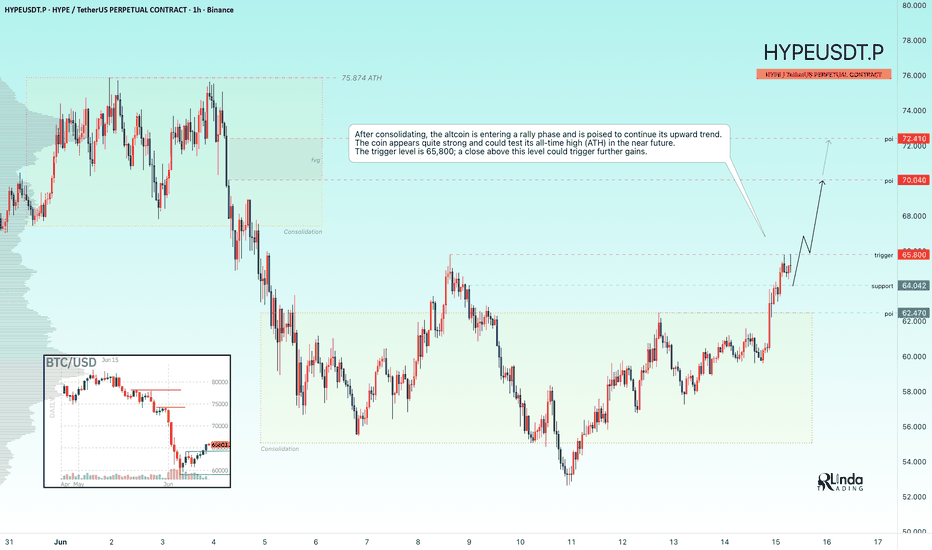
Education 
 Long
Long
 Long
Long
 Long
Long
 Long
Long
Gold Finds Support at 4,170, Recovery Toward 4,340 PossibleHello traders! Here’s my technical outlook based on the current XAUUSD (2H) chart structure. XAUUSD has been trading below a long-term descending trendline after breaking down from a broad consolidation range. Multiple failed recovery attempts confirmed continued seller dominance and kept the broader trend bearish. Currently, XAUUSD is trading above the 4,170 Buyer Zone while remaining below the 4,340 Seller Zone. Price recently rebounded from support and broke above a short-term resistance line, signaling improving bullish momentum. As long as XAUUSD holds above the 4,170 Buyer Zone, the recovery scenario remains valid. A continuation higher could push price toward the 4,340 Seller Zone (TP1). However, a breakdown below support would weaken the bullish outlook and favor renewed selling pressure. Please share this idea with your friends and click “Boost” 🚀 Long 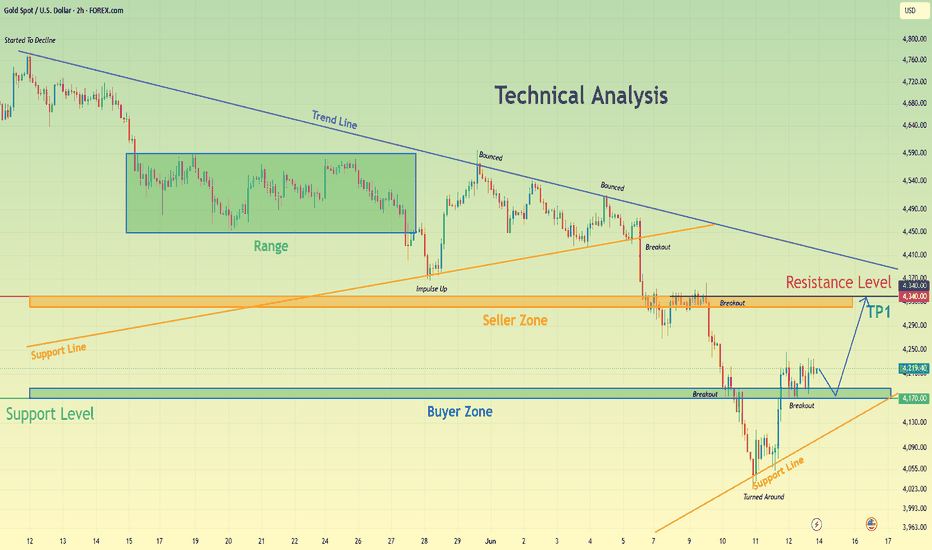
GOLD - Countertrend correction may continueICMARKETS:XAUUSD continues its correction amid a temporary pullback in the U.S. Dollar Index. Technically, this remains a countertrend move. All eyes are now on geopolitical developments and the upcoming Federal Reserve rate decision
Gold is caught between geopolitical support and intense macroeconomic pressure, compounded by the technical break below the 200-day SMA. Wall Street analysts continue to maintain a predominantly bearish outlook.
The U.S. dollar is currently correcting after a false breakout above the 100.0 level. Technically, however, the index remains in a bullish trend, which continues to weigh on gold amid ongoing geopolitical uncertainty.
Against the backdrop of both local and global bearish trends, the market is developing a countertrend corrective phase. The focus remains on the 4246–4170 range. Fundamentally, gold lacks strong support, although a local bullish reaction is currently visible. The market is targeting the 4325–4368 liquidity zone before a potential continuation lower
Resistance levels: 4246, 4315, 4347
Support levels: 4170, 4100, 4057
I expect the local bullish impulse to continue. Before extending higher, gold may retest the 4180–4170 area. A long squeeze could trigger an advance toward 4315–4347. However, a short squeeze around the resistance zone could increase selling pressure and lead to a decline toward 4170–4100.
Best regards,
R. Linda Short 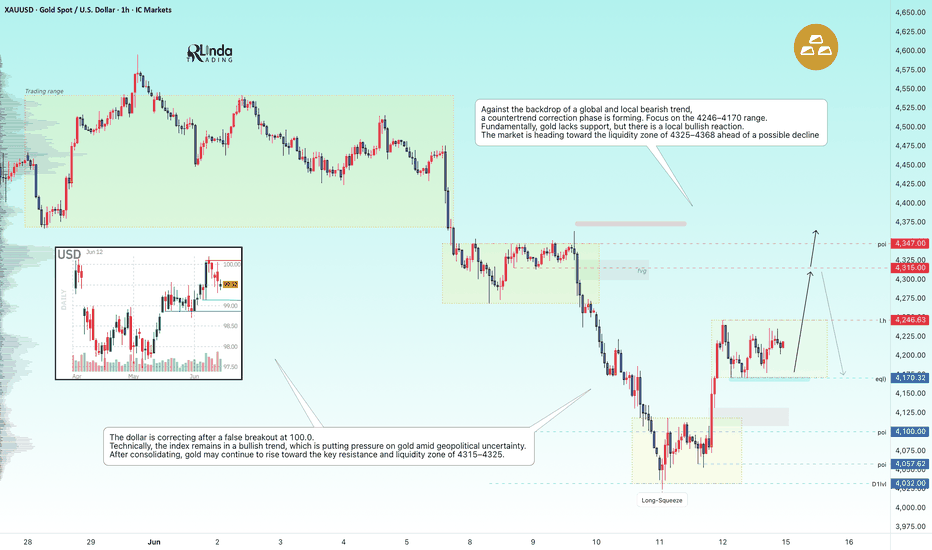
MESM June 12: Mother bar low at 7375 is keyMESM analysis for Friday, June 12
MESM printed a 4H mother bar, and for today that slightly shifts my tone toward a bounce setup, but only as long as the key support level continues to hold.
On the 4H chart, the most important level for me is 7375, which is the low of the previous 4H mother bar. As long as price stays above that level, I think the bounce setup remains valid.
If bulls stay in control, then the first upside target I’m watching is 7491. If price can push through that level, then the next upside target is the 4H gap around 7532.
If price loses 7375, then I think the bounce idea weakens and price could continue lower toward 7330.
On the 1H chart, the structure supports the same idea. 7375 is still the main line in the sand. If price revisits and loses that level, selling pressure could step back in.
On the 15M chart, there is also a lower fair value gap / order block lining up in the green zone below, which could become the next reaction area if price breaks down.
Key levels
7375 = low of the 4H mother bar / key support
7491 = first upside target
7532 = 4H gap / second upside target
7330 = downside target if support fails
Lower green zone = possible reaction area if price breaks lower
Plan for today
Slightly bullish while price holds 7375
Watch 7491 first on the bounce
If bulls stay strong, watch 7532 next
If price loses 7375, watch for downside toward 7330
Not financial advice. No confirmation, no trade. CME_MINI:MESM2026  Long
Long
GOLD - Countertrend correction to the liquidity zoneFollowing the false breakout below the 4030 support level, ICMARKETS:XAUUSD is rebounding higher, with recent shifts in the geopolitical backdrop adding fuel to the move. However, the market remains bearish overall.
Optimism sparked by Trump's decision to cancel major strikes against Iran and renewed hopes for a deal has been replaced by fresh clashes in the Strait of Hormuz. Geopolitical instability remains elevated. Against this backdrop, the U.S. Dollar Index continues to hold firm, putting pressure on gold. Hotter-than-expected U.S. inflation data has reinforced expectations of a 0.25% Fed rate hike in December. Sellers are therefore likely to remain in control.
Key catalysts ahead include consumer sentiment and inflation expectations data on Friday, as well as the first Federal Reserve meeting under the new Chair, Kevin Warsh, next week. Geopolitics will continue to play a decisive role
Resistance levels: 4246 – 4315 – 4368
Support levels: 4171, 4100, 4060
The market is reacting to the false breakdown of support, resulting in a countertrend correction. Gold is moving toward a key liquidity zone, with the main area of interest located between 4315 and 4368.
A short squeeze within this zone would confirm a liquidity-driven manipulation and could trigger a reversal, leading to a move lower toward the next key areas of interest.
Best regards,
R. Linda Short