AUD H3: Buyers Are Strong at ChannelAUDUSD has returned to the lower boundary of its ascending channel, where the next directional move is likely to begin.
The broader structure remains constructive: price has continued to form higher lows since late June, and the current decline is reaching the same demand zone that previously triggered strong bullish reactions.
The key area is 0.6950–0.6975. This zone overlaps with the rising channel support and the latest structural base, while momentum is already approaching an exhausted con
W-pattern
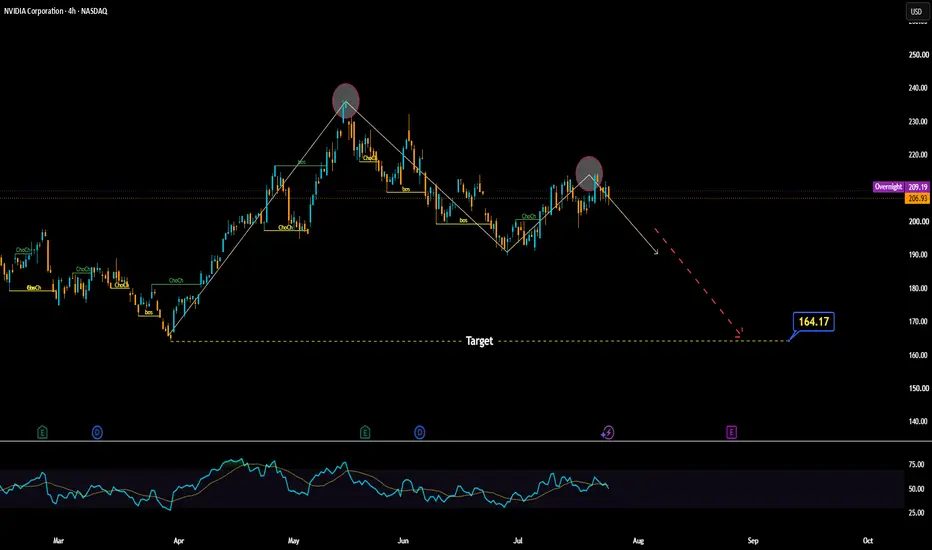
NVDA H4: Deep Downward Risk!On H4, the price fell from the peak of about 235 USD, then only recovered to the area of 212–216 USD before continuing to be sold down.
The formation of a lower peak with RSI turning around the neutral zone shows that the upward momentum is fading. The $208–214 area currently acts as near resistance.
The main scenario is that NVDA continues to be held below 214–216 USD, then clearly breaks the 200 USD zone. At that time, selling pressure could pull the price back to 190 USD. Only when the 190
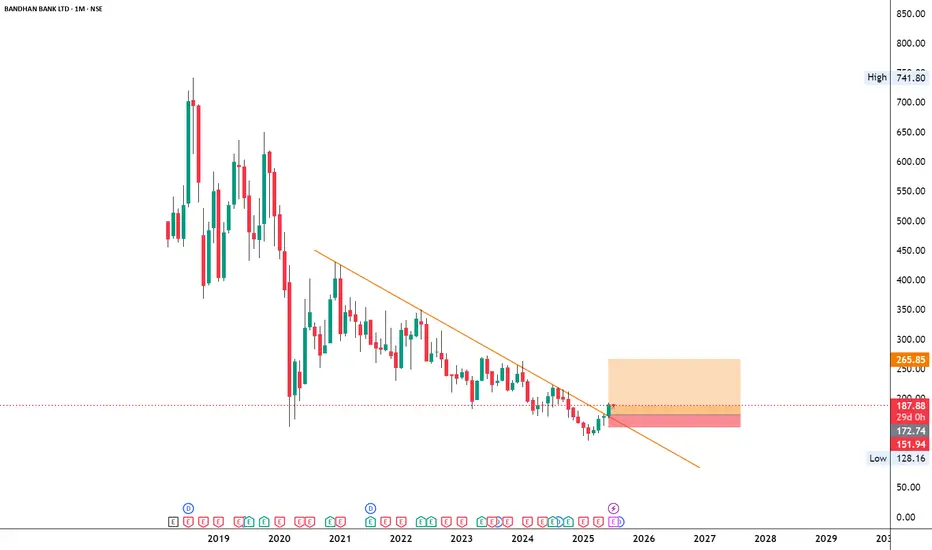
BANDHANBANKNSE:BANDHANBNK
Note :
1. One should go long with a Stop Loss, below the Trendline or the Previous Swing Low.
2. Risk :Reward ratio should be minimum 1:2.
3. Plan your trade as per the Money Management and Risk Appetite.
Disclaimer :
>You are responsible for your profits and loss.
>The idea shared here is purely for Educational purpose.
>Follow back, for more ideas and their notifications on your email.
>Support and Like incase the idea works for you.
GBPJYP trend reversal soon?After a sustained up-move, GBPJPY seems to be taking a halt at the top of the rally & forming a head and shoulder formation, which is a bearish trend reversal pattern. These patterns are most effective especially when they are preceded by a good rally, which is really the situation in our case.
H&S Levels.
The neckline of the pattern is at 216.36 and the highest point on the Right shoulder is at 217.41, top most point on the pattern is at 218.01 and the distance between head & the neckline is e
Short time in BNB tooHello Traders!
Market is strong bearish and BNB is also showing very strong bearish patterns.
BNB is inside an expanding triangle. There is a chance that BNB will move up to touch the line but we are not waiting for that as market is strong bearish so we are Selling BNB From 573
Stoploss 600(-4.5%)
Target 535(+6.8%)
My goal is to be recognized as one of the highest win-rate traders in the TradingView community. :)
Trade Analysis Based on
> Fibonacci Tool (A1000x Way) – Custom Fibonacci a
BTCUSDT: Changing the BEATHello Traders!
First of all this looks unrealistic target with mega dump, But those who trade with A1000x knows very well we don't miss our targets.
If we watch the current pattern there is Triangle breakout and now market is forming a reversal pattern. Which means it is ready for a dump.
Now lets talk about 49,500 Target. Its not a new pattern, Its an old pattern. Even when market was at peak it was supposed to dump to 49,500. It made perfect bullish move and crossed 100K after 100K there wa
Crash in MorphousdtHello Traders!
MORPHOUSE is at the peak and bulls are not able to push it further and market is forming bearish pattern. There will be a crash in Morphousdt.
We can see a rising triangle in MORPHOUSE and there will be a crash soon after breakout and there are multiple bearish patterns in Morphousdt.
We are selling Morphousdt from 2.1
Stoploss 2.2695(-7.9%)
Target 1.7612(+16.2%)
My goal is to be recognized as one of the highest win-rate traders in the TradingView community. :)
Trade Analy
Aigensyn is at the bottomHello Traders!
After a massive win in Aigensyn we are entering again. We are again buying it from 0.027.
In chart we can see there is a breakout of a pattern but after breaking, Aigensyn is forming a reversal pattern which means it is going to push the price back inside the pattern. There are many more bullish confirmations in this pair.
We are buying Aigensyn from 0.027
Stoploss 0.02542(-5.7%)
Target 0.03270(+21.2%)
My goal is to be recognized as one of the highest win-rate traders in th
GBPUSD - Engulfing Pro By INTELA strategyShort Description:
Engulfing Pro by INTELA identifies bullish and bearish engulfing candlestick patterns and combines them with volume (RVOL) and support/resistance context to highlight high‑probability reversal setups. This backtest shows how integrating candlestick signals with market structure improves trade accuracy.
AAVE - Trend-Following Long Opportunity?AAVE remains overall bullish, continuing to trade within a well-defined rising blue wedge. 📈
Price is now approaching a high-confluence support area formed by the intersection of the lower bound of the rising wedge and the demand zone marked in blue.
📌 As long as this confluence holds, we will be looking for trend-following long setups, anticipating the continuation of the broader bullish trend.
As always, rather than buying blindly into support, we will wait for bullish confirmation before c
Big bullish move in BeraHello Traders!
This is a wonderful opportunity in Bear as this pump is more than a 100% move.
We can see a golden trendline on the chart. This is the main trendline for now, and BERA is moving around it.
Earlier, BERA formed a reversal pattern after breaking above the trendline, which pushed the price down. Now, it is forming another pattern that looks like a "W" shape. If this pattern plays out, it could push the price higher.
My target is 0.60, but the price could reach as high as 0.63. Th
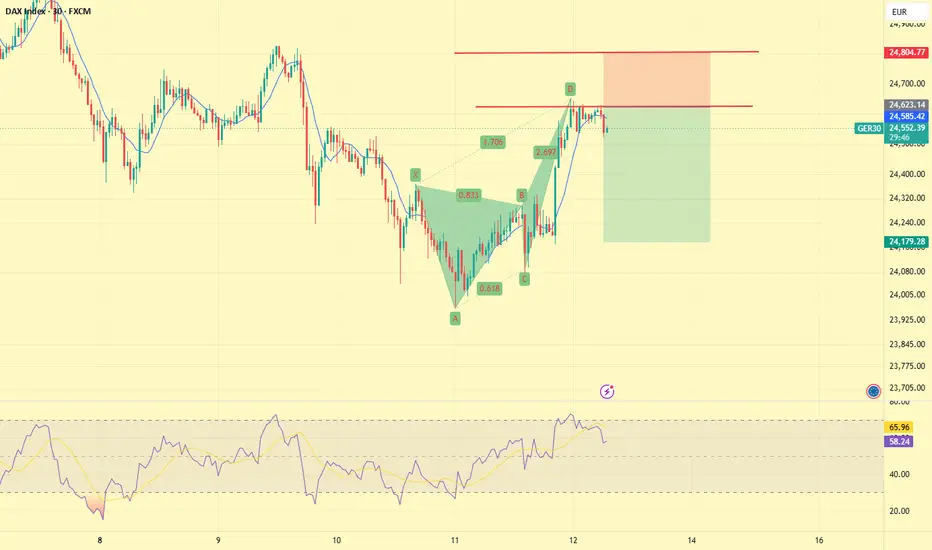
GER30 SHORT• Alignment with the H4 and Daily Trend
This setup is supported by the broader H4 and Daily directional bias. While the market has recently pushed higher, the larger trend structure still favors downside pressure, making this an attractive area to look for short opportunities rather than chasing further upside.
• Retest of a Key Rejection Zone
Price has returned to a significant level that has acted as resistance over the past two weeks. This area has repeatedly rejected bullish advances, and t
GBPUSD: Dual-Timeframe Triangle Play—Tactical 2X Bounce off MajoWe are breaking down a highly precise dual-timeframe study on the British Pound vs. US Dollar ( OANDA:GBPUSD - OANDA), mapping out an asymmetrical, short-term long opportunity within a dominant macro compression pattern.
### 1. The Macro Range & Daily Outlook (Ref: GBPUSD_2026-06-08_08-35-14.png)
On the Daily (1D) chart, the Cable is trading inside a massive historical rectangle structure bounded by **1.38700** at the ceiling and **1.31080** at the floor. This provides a clear high-level bluep
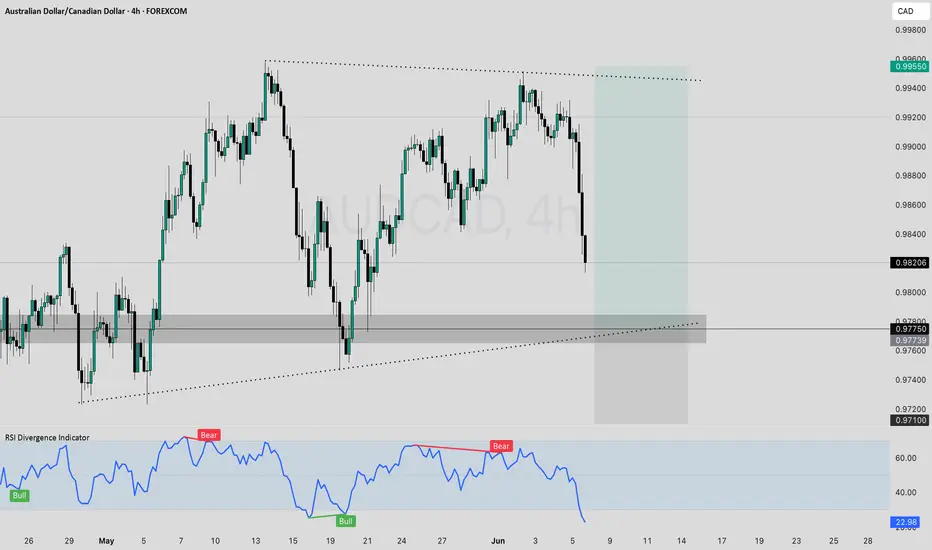
AUDCAD Pullback Into Demand AUDCAD continues to show strength across the higher timeframes as the fundamental and technical picture remains firmly tilted in favor of the Australian Dollar.
The divergence between the RBA and the BoC remains one of the key drivers behind this move. While the RBA continues to maintain a relatively restrictive stance due to persistent inflation pressures and a resilient labor market, the BoC has shifted toward a more accommodative approach as economic growth slows. This widening policy gap co
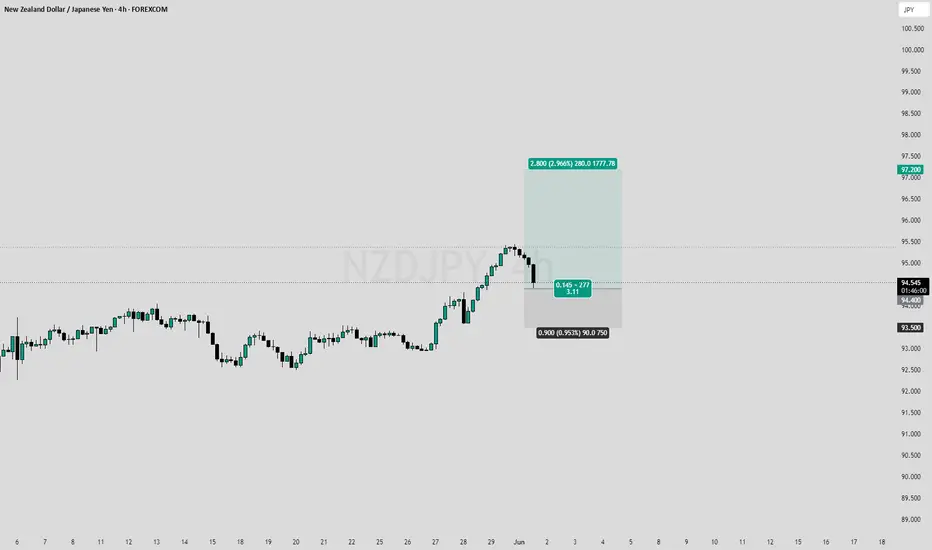
NZDJPY Pulling Back Into Demand. Is The Next Bullish Expansion?NZDJPY continues to offer one of the most attractive carry-trade opportunities in the market. With a significant yield advantage favoring the New Zealand Dollar and institutional money continuing to lean against the Japanese Yen, the broader trend remains firmly bullish. Rather than chasing price higher, the current pullback is bringing the market back into a key demand area where buyers have previously stepped in with conviction.
From a technical perspective, the higher timeframe structure rem
Shorting BTCUSD: Let the Channel Do the WorkFollowing up on our earlier analysis — Bitcoin testing support inside a falling channel on the 1-hour chart. That support is now showing signs of weakness, so I'm considering a short entry on BTCUSD. The channel structure remains intact, with lower highs continuing to pressure price downward. This looks like a steady opportunity to follow the trend rather than fight it. A simple approach: place your stop just above the latest high and look toward the lower side of the channel for your target. As
EGX: ATQA — Bull Flag SetupEGX: ATQA — Bull Flag Setup
Misr National Steel ( EGX:ATQA ) has shifted to a structurally bullish bias on the daily chart after breaking a major multi-month descending trendline, now forming a Bull Flag continuation pattern.
Setup Breakdown
* **The Breakout:** Price decisively cleared the long-term blue descending resistance line in April 2026.
* **The Flagpole:** A sharp, high-volume rally followed the breakout, driving the price up to a peak of **11.00 EGP**.
* **The Flag:** The sto