OPEN-SOURCE SCRIPT
Harmonic Patterns All-in-One Scanner [TradingFinder]XABCD 3Drive
🔵Introduction
Harmonic Patterns are one of the most structured approaches in technical analysis, combining geometric price formations with specific Fibonacci retracement and extension ratios to identify potential market reversal areas. Instead of treating every swing as a random price movement, harmonic analysis focuses on the relationship between consecutive price legs and checks whether those movements form recognizable structures such as XABCD, ABCD, 5-0, or 3 Drive patterns. These structures are commonly used to locate Potential Reversal Zones (PRZ), where the probability of a bullish or bearish reaction may increase if the required Fibonacci relationships are completed.

The Harmonic Patterns All-in-One Scanner brings several major harmonic pattern structures into a single indicator and scanner environment. It is designed to detect bullish and bearish harmonic patterns across multiple markets while automatically evaluating the price legs, swing points, Fibonacci ratios, and pattern geometry behind each setup. The indicator covers a broad group of harmonic formations, including Gartley, Butterfly, Bat, Shark, Deep Crab, Cypher, Alternative Shark, Alternate Bat, Nen-Star, Dragon, 5-0, ABCD, and 3 Drive patterns, allowing traders to monitor different types of harmonic reversal structures without loading a separate harmonic pattern indicator for each model.
Most XABCD harmonic patterns share a similar visual structure but use different Fibonacci ratios between points X, A, B, C, and D. The relationship between XA, AB, BC, and CD determines whether a developing structure matches a Gartley, Butterfly, Bat, Shark, Cypher, or another harmonic pattern. Other formations use different structures: the ABCD pattern focuses on the relationship between AB, BC, and CD, while the 3 Drive harmonic pattern is built around three consecutive price drives and specific Fibonacci extensions. Despite their structural differences, these harmonic patterns share the same core idea: measuring price symmetry and Fibonacci relationships to identify areas where the current market move may be approaching exhaustion or a potential reversal.
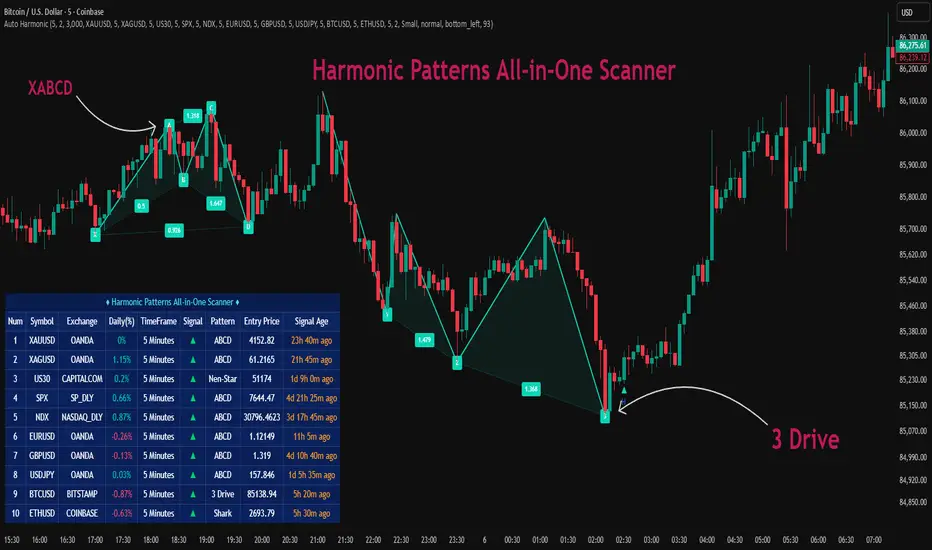
By combining harmonic pattern detection, XABCD pattern scanning, ABCD analysis, 3 Drive detection, Fibonacci ratio analysis, bullish and bearish harmonic signals, and multi-symbol scanning in one tool, the indicator provides a broader view of harmonic opportunities across different symbols and timeframes. The scanner makes it possible to follow several markets simultaneously and quickly see where a valid harmonic structure has recently appeared, while the chart component visually displays the detected pattern and its key price points. This makes the indicator suitable both for traders who actively use harmonic trading strategies and for users who want a faster way to find Fibonacci-based reversal structures without manually measuring every price leg.
🔵How to Use
The Harmonic Patterns All-in-One Scanner is designed to automatically detect harmonic structures by comparing consecutive price swings with predefined Fibonacci retracement and extension ratios. Instead of manually drawing XABCD patterns, measuring every price leg, and checking whether the Fibonacci relationships match a valid harmonic setup, traders can use the indicator to monitor the chart and multiple symbols simultaneously.
When a valid bullish or bearish harmonic pattern is completed, the structure is detected after the signal candle closes, and the pattern can be displayed directly on the chart together with its main swing points and Fibonacci relationships.
The scanner can be used as both a harmonic pattern detector and a multi-symbol harmonic screener. Each symbol can use its own timeframe, allowing traders to monitor different markets and different harmonic trading timeframes from a single dashboard. The screener shows the latest detected pattern, bullish or bearish direction, timeframe, entry price based on the signal candle close, and signal age.
The chart visualization can then be used to study the completed XABCD, OXABCD, ABCD, or 3 Drive structure in more detail. A detected harmonic pattern should generally be treated as a potential reversal setup rather than an automatic trade signal; price action, market structure, trend context, support and resistance, and other confirmation methods can be used alongside the harmonic pattern.
🟣Gartley Pattern
The Gartley harmonic pattern is one of the most widely recognized XABCD reversal structures. It usually represents a controlled retracement inside a larger price movement rather than an extreme extension beyond the original X point. In this indicator, the Gartley structure requires the AB/XA ratio to remain between 0.58 and 0.63, the BC/AB retracement between 0.382 and 0.886, the CD/BC extension between 1.13 and 1.618, and the final AD/XA relationship between 0.77 and 0.82. When these Fibonacci conditions align around point D, the scanner identifies the structure as a potential bullish or bearish Gartley pattern.

🟣Butterfly Pattern
The Butterfly harmonic pattern is an XABCD pattern in which point D extends beyond the initial X point, making it useful for identifying more extended reversal zones. The indicator searches for an AB/XA retracement between 0.77 and 0.82, followed by a BC/AB ratio between 0.382 and 0.886. The CD leg must extend between 1.618 and 2.24 of BC, while the final AD/XA extension must fall between 1.27 and 1.41. This deeper final extension separates the Butterfly from patterns such as the Gartley and Bat and places its potential reversal area outside the initial XA range.

🟣Shark Pattern
The Shark harmonic pattern uses broader Fibonacci relationships and can capture more aggressive price structures. For a valid Shark setup, the scanner accepts an AB/XA relationship between 0.10 and 0.90, a BC/AB extension from 1.13 to 1.618, and a CD/BC extension between 1.618 and 2.24. The final AD/XA ratio must remain between 0.886 and 1.13. Because its internal retracements are relatively flexible, the Shark pattern can appear in structures that would not qualify as Gartley, Bat, or Butterfly formations.

🟣Bat Pattern
The Bat harmonic pattern is another classic XABCD structure, generally characterized by a relatively shallow B point and a deeper completion near point D. The indicator requires AB/XA to remain between 0.382 and 0.50, while BC/AB can range between 0.382 and 0.886. The CD leg must extend approximately 1.618 to 2.618 times BC, and the final AD/XA retracement must fall between 0.86 and 0.899. The combination of the shallow B point and deeper D retracement gives the Bat pattern a distinct harmonic geometry.

🟣Deep Crab Pattern
The Deep Crab harmonic pattern uses a much deeper B retracement than many other XABCD patterns and finishes with a strong extension beyond X. The scanner identifies a Deep Crab when AB/XA is between 0.860 and 0.895, BC/AB is between 0.382 and 0.886, and CD/BC extends between 2.0 and 3.618. The final AD/XA extension must reach approximately 1.58 to 1.63. Because point D forms far beyond the XA leg, the Deep Crab often represents one of the more extended harmonic reversal structures monitored by the scanner.

🟣Cypher Pattern
The Cypher harmonic pattern has a different internal geometry from many traditional XABCD structures, particularly because the BC leg extends beyond the previous XA relationship before price moves toward D. The indicator requires AB/XA between 0.382 and 0.618, BC/AB between 1.13 and 1.414, and CD/BC between 1.272 and 2.0. The final AD/XA retracement is restricted to approximately 0.756 to 0.796. When these relationships converge, point D becomes the completion area for the bullish or bearish Cypher setup.

🟣Alternative Shark Pattern
The Alternative Shark harmonic pattern follows a Shark-like structure but uses a more restrictive first retracement. The scanner requires an AB/XA ratio between 0.382 and 0.618, followed by a BC/AB extension between 1.13 and 1.618. The CD leg must extend between 1.618 and 2.24 of BC, while the final AD/XA relationship must remain between 0.886 and 1.13. These conditions allow the scanner to separate the Alternative Shark from the broader standard Shark configuration.

🟣Alternate Bat Pattern
The Alternate Bat harmonic pattern, or Alt Bat, is a modified Bat structure with a shallower B point and a more extended completion zone. The indicator looks for an AB/XA retracement between 0.345 and 0.399, while BC/AB remains between 0.382 and 0.886. The CD leg must extend between 2.0 and 3.618 of BC, and the final AD/XA ratio must fall between 1.00 and 1.20. The combination of a shallow B retracement and D extending around or beyond X distinguishes the Alternate Bat from the standard Bat pattern.

🟣Nen-Star Pattern
The Nen-Star harmonic pattern is another XABCD-based reversal structure included in the all-in-one harmonic scanner. For this setup, AB/XA must remain between 0.382 and 0.786, followed by a BC/AB extension between 1.13 and 1.272. The CD leg can extend from 1.272 to 2.618 of BC, while the final AD/XA relationship must remain between 1.13 and 1.414. These wider Fibonacci ranges allow the Nen-Star pattern to capture a different type of extended harmonic price formation.

🟣Dragon Pattern
The Dragon harmonic pattern is built around a different balance between retracement and extension compared with the more conventional Gartley or Butterfly structures. The indicator checks for an AB/XA ratio between 0.38 and 0.62, a BC/AB relationship between 0.80 and 1.10, a CD/BC ratio between 0.40 and 0.80, and a final AD/XA relationship between 0.20 and 0.40. When these proportions appear together, the scanner classifies the structure as a Dragon pattern and tracks its bullish or bearish completion.

🟣5-0 Pattern
The 5-0 harmonic pattern belongs to the OXABCD family and therefore contains an additional structural point compared with standard XABCD formations. It typically appears after an extended directional move followed by a specific sequence of expansion and retracement. The scanner requires the AB/XA relationship to remain between 1.13 and 1.618, the BC/AB extension between 1.618 and 2.24, and the final CD/BC retracement between 0.45 and 0.55. The near-50% final retracement is one of the key characteristics used to identify the 5-0 harmonic structure.

🟣ABCD Pattern
The ABCD harmonic pattern is one of the simplest harmonic structures because it does not require the full XABCD sequence. It is based on three connected price legs—AB, BC, and CD—and focuses heavily on symmetry between the first and final legs. The scanner accepts a BC/AB retracement between 0.382 and 0.886 and a CD/BC extension between 1.13 and 2.618. In addition, the AB and CD legs must remain approximately equal in size, with the indicator allowing roughly a ±2.5% tolerance around AB = CD. This combination of Fibonacci relationships and price symmetry is used to identify bullish and bearish ABCD reversal structures.

🟣3 Drive Pattern
The 3 Drive harmonic pattern is based on three consecutive directional price drives separated by corrective swings. Unlike a standard XABCD pattern, the emphasis is placed on the proportional relationship between the successive drives and the symmetry of the expanding structure. The indicator requires the relevant Drive 2 to Drive 1 relationship to remain between 1.27 and 1.618, while the Drive 3 to Drive 2 relationship must also remain between 1.27 and 1.618. When the third drive reaches its harmonic extension area, the pattern can indicate that the directional move is becoming exhausted and approaching a potential reversal zone.

🟣Bullish and Bearish Harmonic Patterns
For most harmonic structures, the same Fibonacci logic is applied in both directions. A bullish harmonic pattern develops when the final point D forms after a downward completion leg and the pattern geometry suggests a potential upward reaction. A bearish harmonic pattern is the mirrored structure, with point D completing after an upward price leg and creating a potential bearish reversal area. The scanner performs these measurements automatically and classifies the completed setup as bullish or bearish, so traders do not need to calculate each Fibonacci retracement or extension manually.
The most practical workflow is to use the screener to identify where a new harmonic pattern has appeared, check the Pattern, Signal, Timeframe, Entry Price, and Signal Age columns, and then open the relevant chart to inspect the complete price structure. The Fibonacci ratios and harmonic geometry identify the setup, while the surrounding market context can help determine whether the Potential Reversal Zone is worth acting on. This approach combines the speed of a multi-symbol harmonic pattern scanner with the visual analysis of XABCD, OXABCD, ABCD, and 3 Drive harmonic patterns, making it possible to monitor a broad set of Fibonacci-based reversal structures without manually searching each chart.
🔵Settings
ZigZag Pivot Period: controls the swing sensitivity used to build the harmonic structures. Lower values react to smaller price swings and can detect more patterns, while higher values focus on larger market movements and produce fewer, broader structures.
Show Valid Format: adds an extra validation layer to the harmonic structure. When enabled, the indicator checks whether the developing pattern remains within the expected structural limits before accepting the setup.
Formation Last Pivot Confirm: controls whether the final pivot of the harmonic pattern must be confirmed before the setup is accepted. When enabled, the indicator waits for the selected confirmation period before validating the final pattern point.
Last Pivot Confirm Period: defines the number of bars used for the final pivot confirmation when Formation Last Pivot Confirm is enabled.
History Bars Per Symbol: determines how many historical bars are processed for each symbol in the harmonic scanner. A larger value allows the screener to search further back in history but also requires more calculations.
Harmonic Types: The Harmonic Types section allows traders to choose which harmonic patterns should be included in the detection process. Each pattern can be enabled or disabled independently.
Available patterns include Gartley, Butterfly, Shark, Bat, Deep Crab, Cypher, Alternative Shark, 5-0, ABCD, 3 Drive, Alternate Bat, Nen-Star, and Dragon.
The Bullish option enables bullish harmonic pattern detection, while the Bearish option enables bearish harmonic pattern detection. Traders can keep both active or scan only one market direction.
Symbol 1 to Symbol 10: The scanner can monitor up to 10 symbols, and every symbol has its own independent settings.
Each Symbol input selects the market that should be monitored, while the corresponding Timeframe input defines the timeframe used to calculate harmonic patterns for that specific symbol.
Because every scanner row has its own timeframe, traders can combine different markets and different timeframes inside the same harmonic pattern screener. For example, one symbol can be scanned on the 5-minute timeframe while another is monitored on the 1-hour or daily timeframe.
The selected screener timeframe should be equal to or higher than the current chart timeframe. If a lower screener timeframe is selected, the indicator displays a warning instead of processing that invalid configuration.
Alert: Alert on New Chart Signal enables alerts when a new harmonic pattern is detected on the currently opened chart. Alert on New Screener Signal enables alerts when a new harmonic pattern appears on one of the symbols monitored by the multi-symbol harmonic scanner. These alert options can be used to follow new bullish or bearish harmonic setups without continuously watching every chart manually.
🔵Conclusion
The Harmonic Patterns All-in-One Scanner combines multiple harmonic structures into one practical workflow for identifying potential reversal zones across different symbols and timeframes. By automatically measuring swing relationships and Fibonacci retracement and extension ratios, the indicator can detect a wide range of harmonic formations, including Gartley, Butterfly, Bat, Shark, Deep Crab, Cypher, Alternative Shark, Alternate Bat, Nen-Star, Dragon, 5-0, ABCD, and 3 Drive patterns. This makes it easier to follow both classic XABCD structures and other harmonic models without manually measuring every price leg.
The main advantage of the scanner is that it brings harmonic pattern detection, multi-symbol scanning, independent timeframes, bullish and bearish signals, entry price, signal age, and chart visualization into a single interface. Traders can use the screener to quickly locate recently completed harmonic patterns and then examine the corresponding chart to study the structure in more detail. As with any harmonic trading method, the detected pattern should be considered a potential setup rather than a guaranteed reversal, and the final decision can be supported by market structure, trend direction, support and resistance, and additional confirmation tools.
Harmonic Patterns are one of the most structured approaches in technical analysis, combining geometric price formations with specific Fibonacci retracement and extension ratios to identify potential market reversal areas. Instead of treating every swing as a random price movement, harmonic analysis focuses on the relationship between consecutive price legs and checks whether those movements form recognizable structures such as XABCD, ABCD, 5-0, or 3 Drive patterns. These structures are commonly used to locate Potential Reversal Zones (PRZ), where the probability of a bullish or bearish reaction may increase if the required Fibonacci relationships are completed.
The Harmonic Patterns All-in-One Scanner brings several major harmonic pattern structures into a single indicator and scanner environment. It is designed to detect bullish and bearish harmonic patterns across multiple markets while automatically evaluating the price legs, swing points, Fibonacci ratios, and pattern geometry behind each setup. The indicator covers a broad group of harmonic formations, including Gartley, Butterfly, Bat, Shark, Deep Crab, Cypher, Alternative Shark, Alternate Bat, Nen-Star, Dragon, 5-0, ABCD, and 3 Drive patterns, allowing traders to monitor different types of harmonic reversal structures without loading a separate harmonic pattern indicator for each model.
Most XABCD harmonic patterns share a similar visual structure but use different Fibonacci ratios between points X, A, B, C, and D. The relationship between XA, AB, BC, and CD determines whether a developing structure matches a Gartley, Butterfly, Bat, Shark, Cypher, or another harmonic pattern. Other formations use different structures: the ABCD pattern focuses on the relationship between AB, BC, and CD, while the 3 Drive harmonic pattern is built around three consecutive price drives and specific Fibonacci extensions. Despite their structural differences, these harmonic patterns share the same core idea: measuring price symmetry and Fibonacci relationships to identify areas where the current market move may be approaching exhaustion or a potential reversal.
By combining harmonic pattern detection, XABCD pattern scanning, ABCD analysis, 3 Drive detection, Fibonacci ratio analysis, bullish and bearish harmonic signals, and multi-symbol scanning in one tool, the indicator provides a broader view of harmonic opportunities across different symbols and timeframes. The scanner makes it possible to follow several markets simultaneously and quickly see where a valid harmonic structure has recently appeared, while the chart component visually displays the detected pattern and its key price points. This makes the indicator suitable both for traders who actively use harmonic trading strategies and for users who want a faster way to find Fibonacci-based reversal structures without manually measuring every price leg.
🔵How to Use
The Harmonic Patterns All-in-One Scanner is designed to automatically detect harmonic structures by comparing consecutive price swings with predefined Fibonacci retracement and extension ratios. Instead of manually drawing XABCD patterns, measuring every price leg, and checking whether the Fibonacci relationships match a valid harmonic setup, traders can use the indicator to monitor the chart and multiple symbols simultaneously.
When a valid bullish or bearish harmonic pattern is completed, the structure is detected after the signal candle closes, and the pattern can be displayed directly on the chart together with its main swing points and Fibonacci relationships.
The scanner can be used as both a harmonic pattern detector and a multi-symbol harmonic screener. Each symbol can use its own timeframe, allowing traders to monitor different markets and different harmonic trading timeframes from a single dashboard. The screener shows the latest detected pattern, bullish or bearish direction, timeframe, entry price based on the signal candle close, and signal age.
The chart visualization can then be used to study the completed XABCD, OXABCD, ABCD, or 3 Drive structure in more detail. A detected harmonic pattern should generally be treated as a potential reversal setup rather than an automatic trade signal; price action, market structure, trend context, support and resistance, and other confirmation methods can be used alongside the harmonic pattern.
🟣Gartley Pattern
The Gartley harmonic pattern is one of the most widely recognized XABCD reversal structures. It usually represents a controlled retracement inside a larger price movement rather than an extreme extension beyond the original X point. In this indicator, the Gartley structure requires the AB/XA ratio to remain between 0.58 and 0.63, the BC/AB retracement between 0.382 and 0.886, the CD/BC extension between 1.13 and 1.618, and the final AD/XA relationship between 0.77 and 0.82. When these Fibonacci conditions align around point D, the scanner identifies the structure as a potential bullish or bearish Gartley pattern.
🟣Butterfly Pattern
The Butterfly harmonic pattern is an XABCD pattern in which point D extends beyond the initial X point, making it useful for identifying more extended reversal zones. The indicator searches for an AB/XA retracement between 0.77 and 0.82, followed by a BC/AB ratio between 0.382 and 0.886. The CD leg must extend between 1.618 and 2.24 of BC, while the final AD/XA extension must fall between 1.27 and 1.41. This deeper final extension separates the Butterfly from patterns such as the Gartley and Bat and places its potential reversal area outside the initial XA range.
🟣Shark Pattern
The Shark harmonic pattern uses broader Fibonacci relationships and can capture more aggressive price structures. For a valid Shark setup, the scanner accepts an AB/XA relationship between 0.10 and 0.90, a BC/AB extension from 1.13 to 1.618, and a CD/BC extension between 1.618 and 2.24. The final AD/XA ratio must remain between 0.886 and 1.13. Because its internal retracements are relatively flexible, the Shark pattern can appear in structures that would not qualify as Gartley, Bat, or Butterfly formations.
🟣Bat Pattern
The Bat harmonic pattern is another classic XABCD structure, generally characterized by a relatively shallow B point and a deeper completion near point D. The indicator requires AB/XA to remain between 0.382 and 0.50, while BC/AB can range between 0.382 and 0.886. The CD leg must extend approximately 1.618 to 2.618 times BC, and the final AD/XA retracement must fall between 0.86 and 0.899. The combination of the shallow B point and deeper D retracement gives the Bat pattern a distinct harmonic geometry.
🟣Deep Crab Pattern
The Deep Crab harmonic pattern uses a much deeper B retracement than many other XABCD patterns and finishes with a strong extension beyond X. The scanner identifies a Deep Crab when AB/XA is between 0.860 and 0.895, BC/AB is between 0.382 and 0.886, and CD/BC extends between 2.0 and 3.618. The final AD/XA extension must reach approximately 1.58 to 1.63. Because point D forms far beyond the XA leg, the Deep Crab often represents one of the more extended harmonic reversal structures monitored by the scanner.
🟣Cypher Pattern
The Cypher harmonic pattern has a different internal geometry from many traditional XABCD structures, particularly because the BC leg extends beyond the previous XA relationship before price moves toward D. The indicator requires AB/XA between 0.382 and 0.618, BC/AB between 1.13 and 1.414, and CD/BC between 1.272 and 2.0. The final AD/XA retracement is restricted to approximately 0.756 to 0.796. When these relationships converge, point D becomes the completion area for the bullish or bearish Cypher setup.
🟣Alternative Shark Pattern
The Alternative Shark harmonic pattern follows a Shark-like structure but uses a more restrictive first retracement. The scanner requires an AB/XA ratio between 0.382 and 0.618, followed by a BC/AB extension between 1.13 and 1.618. The CD leg must extend between 1.618 and 2.24 of BC, while the final AD/XA relationship must remain between 0.886 and 1.13. These conditions allow the scanner to separate the Alternative Shark from the broader standard Shark configuration.
🟣Alternate Bat Pattern
The Alternate Bat harmonic pattern, or Alt Bat, is a modified Bat structure with a shallower B point and a more extended completion zone. The indicator looks for an AB/XA retracement between 0.345 and 0.399, while BC/AB remains between 0.382 and 0.886. The CD leg must extend between 2.0 and 3.618 of BC, and the final AD/XA ratio must fall between 1.00 and 1.20. The combination of a shallow B retracement and D extending around or beyond X distinguishes the Alternate Bat from the standard Bat pattern.
🟣Nen-Star Pattern
The Nen-Star harmonic pattern is another XABCD-based reversal structure included in the all-in-one harmonic scanner. For this setup, AB/XA must remain between 0.382 and 0.786, followed by a BC/AB extension between 1.13 and 1.272. The CD leg can extend from 1.272 to 2.618 of BC, while the final AD/XA relationship must remain between 1.13 and 1.414. These wider Fibonacci ranges allow the Nen-Star pattern to capture a different type of extended harmonic price formation.
🟣Dragon Pattern
The Dragon harmonic pattern is built around a different balance between retracement and extension compared with the more conventional Gartley or Butterfly structures. The indicator checks for an AB/XA ratio between 0.38 and 0.62, a BC/AB relationship between 0.80 and 1.10, a CD/BC ratio between 0.40 and 0.80, and a final AD/XA relationship between 0.20 and 0.40. When these proportions appear together, the scanner classifies the structure as a Dragon pattern and tracks its bullish or bearish completion.
🟣5-0 Pattern
The 5-0 harmonic pattern belongs to the OXABCD family and therefore contains an additional structural point compared with standard XABCD formations. It typically appears after an extended directional move followed by a specific sequence of expansion and retracement. The scanner requires the AB/XA relationship to remain between 1.13 and 1.618, the BC/AB extension between 1.618 and 2.24, and the final CD/BC retracement between 0.45 and 0.55. The near-50% final retracement is one of the key characteristics used to identify the 5-0 harmonic structure.
🟣ABCD Pattern
The ABCD harmonic pattern is one of the simplest harmonic structures because it does not require the full XABCD sequence. It is based on three connected price legs—AB, BC, and CD—and focuses heavily on symmetry between the first and final legs. The scanner accepts a BC/AB retracement between 0.382 and 0.886 and a CD/BC extension between 1.13 and 2.618. In addition, the AB and CD legs must remain approximately equal in size, with the indicator allowing roughly a ±2.5% tolerance around AB = CD. This combination of Fibonacci relationships and price symmetry is used to identify bullish and bearish ABCD reversal structures.
🟣3 Drive Pattern
The 3 Drive harmonic pattern is based on three consecutive directional price drives separated by corrective swings. Unlike a standard XABCD pattern, the emphasis is placed on the proportional relationship between the successive drives and the symmetry of the expanding structure. The indicator requires the relevant Drive 2 to Drive 1 relationship to remain between 1.27 and 1.618, while the Drive 3 to Drive 2 relationship must also remain between 1.27 and 1.618. When the third drive reaches its harmonic extension area, the pattern can indicate that the directional move is becoming exhausted and approaching a potential reversal zone.
🟣Bullish and Bearish Harmonic Patterns
For most harmonic structures, the same Fibonacci logic is applied in both directions. A bullish harmonic pattern develops when the final point D forms after a downward completion leg and the pattern geometry suggests a potential upward reaction. A bearish harmonic pattern is the mirrored structure, with point D completing after an upward price leg and creating a potential bearish reversal area. The scanner performs these measurements automatically and classifies the completed setup as bullish or bearish, so traders do not need to calculate each Fibonacci retracement or extension manually.
The most practical workflow is to use the screener to identify where a new harmonic pattern has appeared, check the Pattern, Signal, Timeframe, Entry Price, and Signal Age columns, and then open the relevant chart to inspect the complete price structure. The Fibonacci ratios and harmonic geometry identify the setup, while the surrounding market context can help determine whether the Potential Reversal Zone is worth acting on. This approach combines the speed of a multi-symbol harmonic pattern scanner with the visual analysis of XABCD, OXABCD, ABCD, and 3 Drive harmonic patterns, making it possible to monitor a broad set of Fibonacci-based reversal structures without manually searching each chart.
🔵Settings
ZigZag Pivot Period: controls the swing sensitivity used to build the harmonic structures. Lower values react to smaller price swings and can detect more patterns, while higher values focus on larger market movements and produce fewer, broader structures.
Show Valid Format: adds an extra validation layer to the harmonic structure. When enabled, the indicator checks whether the developing pattern remains within the expected structural limits before accepting the setup.
Formation Last Pivot Confirm: controls whether the final pivot of the harmonic pattern must be confirmed before the setup is accepted. When enabled, the indicator waits for the selected confirmation period before validating the final pattern point.
Last Pivot Confirm Period: defines the number of bars used for the final pivot confirmation when Formation Last Pivot Confirm is enabled.
History Bars Per Symbol: determines how many historical bars are processed for each symbol in the harmonic scanner. A larger value allows the screener to search further back in history but also requires more calculations.
Harmonic Types: The Harmonic Types section allows traders to choose which harmonic patterns should be included in the detection process. Each pattern can be enabled or disabled independently.
Available patterns include Gartley, Butterfly, Shark, Bat, Deep Crab, Cypher, Alternative Shark, 5-0, ABCD, 3 Drive, Alternate Bat, Nen-Star, and Dragon.
The Bullish option enables bullish harmonic pattern detection, while the Bearish option enables bearish harmonic pattern detection. Traders can keep both active or scan only one market direction.
Symbol 1 to Symbol 10: The scanner can monitor up to 10 symbols, and every symbol has its own independent settings.
Each Symbol input selects the market that should be monitored, while the corresponding Timeframe input defines the timeframe used to calculate harmonic patterns for that specific symbol.
Because every scanner row has its own timeframe, traders can combine different markets and different timeframes inside the same harmonic pattern screener. For example, one symbol can be scanned on the 5-minute timeframe while another is monitored on the 1-hour or daily timeframe.
The selected screener timeframe should be equal to or higher than the current chart timeframe. If a lower screener timeframe is selected, the indicator displays a warning instead of processing that invalid configuration.
Alert: Alert on New Chart Signal enables alerts when a new harmonic pattern is detected on the currently opened chart. Alert on New Screener Signal enables alerts when a new harmonic pattern appears on one of the symbols monitored by the multi-symbol harmonic scanner. These alert options can be used to follow new bullish or bearish harmonic setups without continuously watching every chart manually.
🔵Conclusion
The Harmonic Patterns All-in-One Scanner combines multiple harmonic structures into one practical workflow for identifying potential reversal zones across different symbols and timeframes. By automatically measuring swing relationships and Fibonacci retracement and extension ratios, the indicator can detect a wide range of harmonic formations, including Gartley, Butterfly, Bat, Shark, Deep Crab, Cypher, Alternative Shark, Alternate Bat, Nen-Star, Dragon, 5-0, ABCD, and 3 Drive patterns. This makes it easier to follow both classic XABCD structures and other harmonic models without manually measuring every price leg.
The main advantage of the scanner is that it brings harmonic pattern detection, multi-symbol scanning, independent timeframes, bullish and bearish signals, entry price, signal age, and chart visualization into a single interface. Traders can use the screener to quickly locate recently completed harmonic patterns and then examine the corresponding chart to study the structure in more detail. As with any harmonic trading method, the detected pattern should be considered a potential setup rather than a guaranteed reversal, and the final decision can be supported by market structure, trend direction, support and resistance, and additional confirmation tools.
Skrip open-source
Dengan semangat TradingView yang sesungguhnya, pembuat skrip ini telah menjadikannya sebagai sumber terbuka, sehingga para trader dapat meninjau dan memverifikasi fungsinya. Salut untuk penulisnya! Meskipun Anda dapat menggunakannya secara gratis, perlu diingat bahwa penerbitan ulang kode ini tunduk pada Tata Tertib kami.

💎Paid Space (VIP): tradingview.com/spaces/TradingFinder/
✅Telegram support team: t.me/TFLABS
🧠Free Forex, Crypto & Stock Trading tutorial, same as ICT, Smart Money & Price Action:
tradingfinder.com/education/forex/
✅Telegram support team: t.me/TFLABS
🧠Free Forex, Crypto & Stock Trading tutorial, same as ICT, Smart Money & Price Action:
tradingfinder.com/education/forex/
Pernyataan Penyangkalan
Informasi dan publikasi ini tidak dimaksudkan, dan bukan merupakan, saran atau rekomendasi keuangan, investasi, trading, atau jenis lainnya yang diberikan atau didukung oleh TradingView. Baca selengkapnya di Ketentuan Penggunaan.
Skrip open-source
Dengan semangat TradingView yang sesungguhnya, pembuat skrip ini telah menjadikannya sebagai sumber terbuka, sehingga para trader dapat meninjau dan memverifikasi fungsinya. Salut untuk penulisnya! Meskipun Anda dapat menggunakannya secara gratis, perlu diingat bahwa penerbitan ulang kode ini tunduk pada Tata Tertib kami.
💎Paid Space (VIP): tradingview.com/spaces/TradingFinder/
✅Telegram support team: t.me/TFLABS
🧠Free Forex, Crypto & Stock Trading tutorial, same as ICT, Smart Money & Price Action:
tradingfinder.com/education/forex/
✅Telegram support team: t.me/TFLABS
🧠Free Forex, Crypto & Stock Trading tutorial, same as ICT, Smart Money & Price Action:
tradingfinder.com/education/forex/
Pernyataan Penyangkalan
Informasi dan publikasi ini tidak dimaksudkan, dan bukan merupakan, saran atau rekomendasi keuangan, investasi, trading, atau jenis lainnya yang diberikan atau didukung oleh TradingView. Baca selengkapnya di Ketentuan Penggunaan.