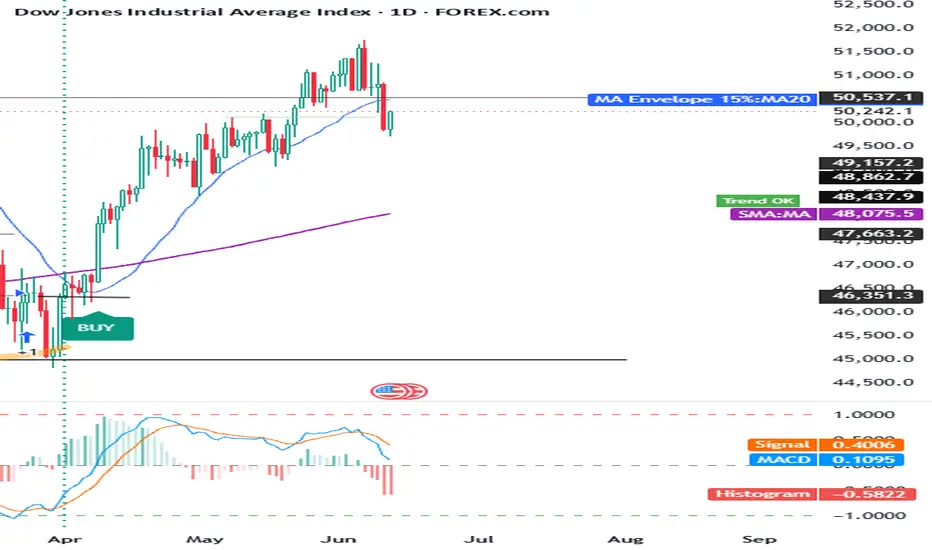
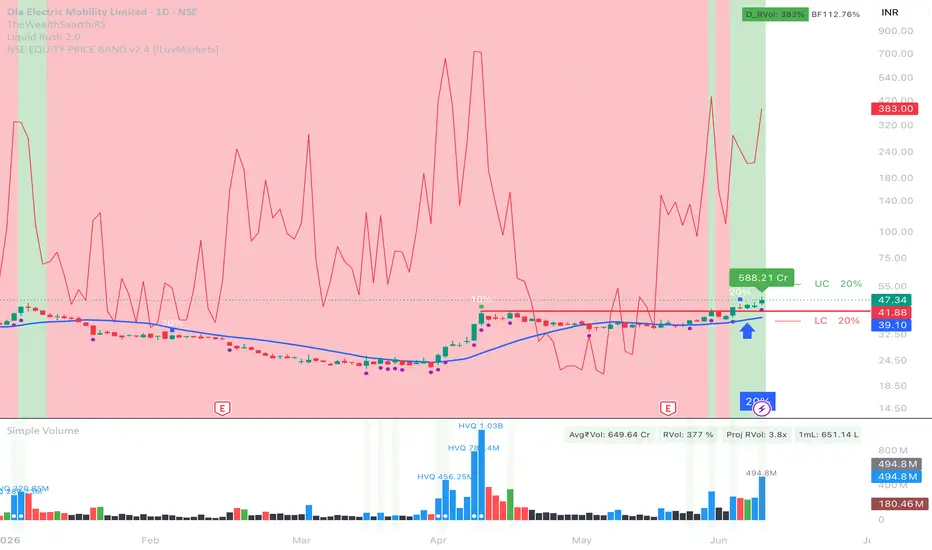
Golden Cross Chob ZoneGolden Cross Chob Zone
Golden Cross Chob Zone is a visual trend-following indicator designed to help traders study bullish trend regimes using EMA 50, EMA 200, Chop Zone trend strength, pullback behavior, and structured visual risk references.
The script combines:
* EMA 50 and EMA 200 regime analysis
* Golden Cross and Death Cross detection
* Chop Zone trend-strength coloring
* Sideways / no-trade filtering
* Multiple bullish entry-event types
* Visual Entry / Stop / Target reference lines
* EMA 200 exit logic
* Compact labels with detailed tooltips
* Dashboard status and event counters
* Alert conditions for key events
This script is an indicator, not a strategy. It does not place orders, does not execute trades, and does not produce TradingView Strategy Tester backtest results. The visual BUY, TP, SL, and EMA200 EXIT labels are chart-analysis events only. They are intended to help users study how the selected rules behave on the chart, not to guarantee performance or provide financial advice.
Important note about signals and performance
Golden Cross Chob Zone does not guarantee profitable trades.
The BUY labels are not automatic trading recommendations. They mark technical conditions where the script detected one of its bullish entry-event rules.
The TP HIT, SL HIT, EMA200 EXIT, and DC EXIT labels are visual tracking references only. They are not broker fills, not strategy orders, and not official backtest results.
The dashboard statistics are simple event counters based on the script’s visual tracking logic. They should not be interpreted as verified strategy performance, win rate, or realistic trading results.
Users should combine this tool with their own analysis, risk management, position sizing, and market context.
Core idea
The main idea of this indicator is to detect bullish market conditions where EMA 50 is above EMA 200, then look for structured bullish continuation events such as:
* Golden Cross breakout
* EMA 50 pullback confirmation
* EMA 50 bounce
* EMA 50 reclaim
The script also uses Chop Zone coloring to estimate whether the trend environment is strong, weak, choppy, or bearish. A sideways / no-trade filter can block normal BUY events when the market is too flat, too compressed, or price is not clearly above EMA 200.
Main components
1. EMA 50 and EMA 200 trend regime
The script uses two exponential moving averages:
Fast EMA
Default: EMA 50
Slow EMA
Default: EMA 200
The Fast EMA is used for pullbacks, bounces, reclaims, and Golden Cross entries.
The Slow EMA is used as the main regime filter and as an optional dynamic exit reference.
Bullish regime
A bullish regime exists when EMA 50 is above EMA 200.
This is the script’s most important directional filter. The script is designed mainly for long-side trend analysis.
Golden Cross
A Golden Cross occurs when the Fast EMA crosses above the Slow EMA.
The script can mark this event with a GC label.
Death Cross
A Death Cross occurs when the Fast EMA crosses below the Slow EMA.
The script can mark this event with a DC label.
Important: GC and DC labels are moving-average structure events. They are not guaranteed buy or sell signals.
2. EMA regime fill
The script can shade the area between EMA 50 and EMA 200.
Green fill
Fast EMA is above Slow EMA.
Red fill
Fast EMA is below Slow EMA.
This helps users quickly identify whether the chart is in a bullish or bearish EMA regime.
3. Chop Zone filter
The Chop Zone section estimates the slope strength of a selected EMA by measuring its angle relative to the recent price range.
The script calculates:
* a recent high-low range,
* an EMA slope,
* a normalized slope angle,
* a color grade based on the slope direction and strength.
The Chop Zone grade is then translated into color categories.
Positive Chop Zone grades
Turquoise
Strong upward trend condition.
Dark green
Clear upward trend condition.
Pale green
Mild upward trend condition.
Teal
Weak upward condition.
Neutral / yellow
Yellow
Choppy or neutral slope condition.
Negative Chop Zone grades
Light orange
Weak downward condition.
Orange
Mild downward condition.
Pink
Clear downward condition.
Dark red
Strong downward condition.
The Chop Zone is used as a trend-quality filter for normal BUY signals. Users can choose the minimum Chop Zone grade required to allow buys.
Minimum Grade To Allow Buys
Any green
Allows any positive green / teal condition.
Pale green or better
Requires a stronger positive Chop Zone reading.
Dark green or better
Requires a clear upward trend condition.
Turquoise only
Requires the strongest upward Chop Zone condition.
4. Chop Zone strip
The script can plot a small colored strip at the bottom of the price pane.
Each square represents the Chop Zone color for that bar.
This gives a compact visual reading of trend strength and choppiness without needing a separate pane.
5. Candle coloring by Chop Zone
The script can color price candles using the Chop Zone colors.
This helps the user visually connect candle movement with the current trend-strength classification.
Candle coloring is visual context only. It is not a standalone entry or exit signal.
Entry logic
The script supports several bullish entry-event types.
A BUY label can appear only when the script’s selected rules are met. By default, the logic is long-side focused and requires EMA 50 to be above EMA 200, except that Golden Cross breakout has its own optional filter settings.
1. Golden Cross Breakout Entry
The Golden Cross breakout entry is designed to identify a bullish breakout condition on the bar where EMA 50 crosses above EMA 200.
A GC breakout BUY can occur when:
* Golden Cross happens,
* EMA 50 is above EMA 200,
* close is above EMA 50,
* close is above EMA 200,
* candle is bullish,
* optional Chop Zone condition passes,
* optional sideways filter condition passes.
This entry type is displayed as:
GC BREAKOUT
Important: This is not a guaranteed breakout signal. It only marks that the selected Golden Cross breakout conditions were met.
2. Classic Pullback Entry
The classic pullback logic waits for price to touch or come close to EMA 50, then requires a bullish confirmation candle within a selected number of bars.
A classic pullback BUY can occur when:
* EMA 50 is above EMA 200,
* Chop Zone filter allows buys,
* price touches or nearly touches EMA 50,
* confirmation candle appears within the selected confirmation window,
* candle closes above EMA 50,
* optional prior-high confirmation passes.
This entry type is displayed as:
PULLBACK
3. EMA 50 Bounce Entry
The EMA 50 bounce entry is a more direct bounce condition.
A bounce BUY can occur when:
* EMA 50 is above EMA 200,
* Chop Zone filter allows buys,
* candle is bullish,
* close is above EMA 50,
* low touches or nearly touches EMA 50.
This entry type is displayed as:
EMA50 BOUNCE
4. EMA 50 Reclaim Entry
The EMA 50 reclaim entry looks for price recovering back above EMA 50.
A reclaim BUY can occur when:
* EMA 50 is above EMA 200,
* Chop Zone filter allows buys,
* candle is bullish,
* close is above EMA 50,
* previous close was at or below EMA 50.
This entry type is displayed as:
EMA50 RECLAIM
5. One open signal at a time
The script includes an option called:
Only One Open Signal At A Time
When enabled, the script does not print a new BUY signal while a previous signal is still being visually tracked by the Entry / SL / TP logic.
This helps reduce repeated labels in the same open setup.
Sideways / no-trade filter
The script includes a market filter designed to reduce normal BUY events in sideways or unclear conditions.
The sideways filter can check:
* EMA 50 / EMA 200 spread,
* EMA 50 slope,
* EMA 200 slope,
* price position relative to EMA 200,
* cooldown after previous exit.
The filter is designed to block normal BUY signals when market conditions are too flat, compressed, or unclear.
Important: The Golden Cross breakout entry can be allowed separately from the normal sideways filter, depending on the user settings. This is useful when the user wants to observe the first strong breakout immediately after a Golden Cross.
Filter elements
Minimum EMA50-EMA200 Spread %
Measures the distance between EMA 50 and EMA 200 as a percentage of price.
Higher values reduce signals in sideways markets.
EMA Slope Lookback
Defines how many bars are used to check if EMA 50 or EMA 200 is rising.
Require EMA 50 Slope Up
When enabled, normal BUY events require EMA 50 to be rising.
Require EMA 200 Slope Up
When enabled, normal BUY events require EMA 200 to be rising.
Require Price Above EMA 200
When enabled, normal BUY events require close to be above EMA 200.
Cooldown After Exit
Blocks new normal BUY events for a selected number of bars after TP, SL, or EMA200 exit.
This is intended to reduce repeated entries after an exit, especially in sideways markets.
Stop / exit and target logic
The script includes visual reference levels for Entry, Stop / Exit, and Target.
These levels are not strategy orders. They are chart references only.
Stop / Exit Mode
The script supports three stop / exit modes:
1. EMA 200 Break Exit
This mode uses the current EMA 200 as a dynamic exit reference.
The exit can trigger when:
* low touches EMA 200, or
* close falls below EMA 200,
depending on the selected EMA 200 break trigger.
This mode is dynamic because the EMA 200 changes as new bars form.
2. Fixed EMA 200 at Entry
This mode freezes the stop reference at the EMA 200 value on the BUY signal bar.
Unlike the dynamic EMA 200 exit, this reference does not move after entry.
3. Fixed Pullback Low
This mode places the stop reference below the recent pullback low.
The pullback low is calculated using the selected lookback period.
SL Buffer
The script allows an optional ATR-based buffer under the chosen stop anchor.
A buffer of 0.00 uses the stop anchor directly.
Increasing the value places the fixed stop reference farther away from the stop anchor.
Take-profit logic
The take-profit level is based on prior swing-high structure.
The script first looks for the highest high over the selected swing-high lookback period before the signal bar.
If that swing-high target is not available, is below entry, or gives too little reward-to-risk, the script uses a fallback R-multiple target.
Target: Swing-High Lookback
Defines how far back the script looks for a prior swing-high target.
Fallback R Multiple
Defines the fallback target based on risk distance.
Minimum Acceptable Target RR
If the prior swing-high target gives less than this minimum RR, the script uses the fallback R target instead.
Visual lines
When enabled, the script can draw:
Entry line
A dashed reference at the BUY close price.
SL / exit reference line
A red reference line based on the selected stop / exit mode.
TP line
A green reference line based on the selected target logic.
If EMA 200 Break Exit is used, the SL reference line can follow the EMA 200 dynamically.
Labels
BUY label
The BUY label appears when one of the selected entry-event rules is triggered.
If compact labels are enabled, the label stays small and the full details are placed in the tooltip.
The BUY tooltip can include:
* entry type,
* entry price,
* reference SL,
* target,
* RR,
* target mode,
* exit mode,
* EMA 50 / EMA 200 regime,
* EMA spread,
* filter status,
* cooldown status,
* Golden Cross breakout status,
* Chop Zone grade.
TP HIT label
The TP HIT label appears when price reaches the visual take-profit reference.
This label is a visual tracking event only. It is not a broker fill or a verified backtest result.
SL HIT label
The SL HIT label appears when the fixed stop reference is touched.
This applies when the selected mode uses a fixed stop reference.
EMA200 EXIT label
The EMA200 EXIT label appears when the dynamic EMA 200 exit condition is triggered.
Depending on settings, this can happen when:
* low touches EMA 200, or
* close falls below EMA 200.
DC EXIT label
The DC EXIT label can appear when a Death Cross occurs while a tracked signal is open and the selected exit logic allows that condition.
This is a moving-average structure exit event, not a strategy order.
Label spacing
The script places labels using ATR-based spacing so they are not directly attached to candles.
Label Distance From Candles controls how far labels are placed vertically away from price bars.
Dashboard
The dashboard summarizes the current condition of the indicator.
Dashboard fields
Regime
Shows whether the EMA structure is bullish or bearish.
BULL
EMA 50 is above EMA 200.
BEAR
EMA 50 is below EMA 200.
The dashboard can also show how many bars have passed since the last Golden Cross or Death Cross.
Chop Zone
Shows the current Chop Zone condition, such as:
* STRONG UP
* TREND UP
* MILD UP
* WEAK UP
* CHOP
* WEAK DOWN
* MILD DOWN
* TREND DOWN
* STRONG DOWN
Filter
Shows whether the normal market filter is allowing signals or blocking them.
OK
Normal market filter conditions are acceptable.
NO TRADE
Normal market filter is blocking normal BUY events.
The dashboard also shows EMA spread percentage.
Setup
Shows the current setup state, such as:
SIGNAL OPEN
A visual signal is currently being tracked.
COOLDOWN
New normal signals are blocked temporarily after an exit.
GC BREAKOUT READY
Golden Cross breakout conditions are present.
NO TRADE
Market filter is blocking normal entries.
PULLBACK ARMED
Price has touched the EMA 50 pullback zone and is waiting for confirmation.
WAITING PULLBACK
Bullish regime exists, but no valid entry event has triggered.
STAND ASIDE
The EMA regime is not bullish.
Open
Shows current open visual tracking references:
* Entry
* SL / exit reference
* TP
Stats
Shows simple event counters:
* total signals,
* wins counted by TP events,
* losses counted by SL / exit events,
* TP-rate based on the script’s internal visual events.
Important: These are not official Strategy Tester results and should not be presented as backtesting performance. They are simple chart-event counters for study and comparison only.
Alerts
The script includes alert conditions for:
Golden Cross
Triggered when EMA 50 crosses above EMA 200.
GC Breakout BUY
Triggered when the Golden Cross breakout entry conditions are met.
Death Cross
Triggered when EMA 50 crosses below EMA 200.
Pullback Touch
Triggered when price touches or approaches the EMA 50 pullback zone.
BUY Signal
Triggered when a selected BUY event occurs.
Chop Zone -> Green
Triggered when Chop Zone shifts into a positive / green condition.
Chop Zone -> Red
Triggered when Chop Zone shifts into a negative / red condition.
TP Hit
Triggered when the visual take-profit reference is reached.
Stop / EMA200 Exit
Triggered when the stop reference or EMA 200 exit condition is reached.
Alerts are notifications only. They do not instruct the user to buy or sell.
Settings explained
Trend EMAs
Fast EMA Length
Sets the fast EMA. Default is EMA 50.
Slow EMA Length
Sets the slow EMA. Default is EMA 200.
Fill Between EMAs
Shows or hides the colored area between the two EMAs.
Chop Zone Filter
Range Lookback
Defines the range used to normalize the EMA slope.
Slope EMA Length
Defines the EMA used for the Chop Zone slope calculation.
Minimum Grade To Allow Buys
Defines how strong the Chop Zone must be before normal BUY events are allowed.
Show Chop Zone Strip
Shows or hides the colored strip at the bottom of the price pane.
Color Price Bars By Chop Zone
Colors candles using the Chop Zone condition.
Entry Logic
Allow Golden Cross Breakout Entry
Allows a BUY event on the Golden Cross bar if the breakout conditions are met.
GC Breakout Requires Green Chop Zone
Requires Chop Zone to be green for Golden Cross breakout entries.
Fast-EMA Touch Tolerance (%)
Allows a candle low to come close to EMA 50 instead of requiring an exact touch.
Confirm Within (bars)
Defines how many bars are allowed between an EMA 50 touch and a confirmation candle.
Confirm Candle Must Close Above Prior High
Requires the confirmation candle to close above the previous bar’s high.
Allow Classic Pullback Entry
Enables the classic pullback entry-event logic.
Allow EMA 50 Bounce Entry
Enables the EMA 50 bounce entry-event logic.
Allow EMA 50 Reclaim Entry
Enables the EMA 50 reclaim entry-event logic.
Only One Open Signal At A Time
Blocks new BUY events while a previous visual signal is still open.
Sideways / No-Trade Filter
Enable Sideways / No-Trade Filter
Enables or disables the normal market filter.
Apply Sideways Filter To GC Breakout
Applies the sideways filter to Golden Cross breakout entries when enabled.
Minimum EMA50-EMA200 Spread (%)
Requires a minimum distance between EMA 50 and EMA 200.
EMA Slope Lookback (bars)
Defines the slope lookback for EMA slope checks.
Require EMA 50 Slope Up
Requires EMA 50 to be rising.
Require EMA 200 Slope Up
Requires EMA 200 to be rising.
Require Price Above EMA 200
Requires close to be above EMA 200.
Cooldown After Exit (bars)
Blocks normal BUY events after an exit for the selected number of bars.
Stop Loss / Target
Stop / Exit Mode
Chooses between dynamic EMA 200 exit, fixed EMA 200 at entry, or fixed pullback low.
EMA 200 Break Trigger
Chooses whether the dynamic EMA 200 exit uses a low touch or a close below EMA 200.
ATR Length
Controls the ATR used for stop buffer and label spacing.
SL Buffer (ATR multiples)
Adds an optional ATR buffer to the stop reference.
Pullback Low Lookback (bars)
Defines the lookback for the fixed pullback low stop mode.
Target: Swing-High Lookback (bars)
Defines the lookback for the prior swing-high target.
Fallback R Multiple
Defines the fallback target if the swing-high target is not usable.
Minimum Acceptable Target RR
Defines the minimum reward-to-risk required before using the swing-high target.
Visuals / Dashboard
Show Dashboard
Shows or hides the dashboard.
Dashboard Position
Moves the dashboard to a selected chart corner.
Mark Golden / Death Crosses
Shows or hides GC and DC labels.
Draw Entry / SL / TP Lines
Shows or hides the visual reference lines.
Show BUY Triangle
Shows or hides the BUY triangle marker.
Use Compact Labels
Uses smaller labels with full details stored in tooltips.
Show BUY Label
Shows or hides the BUY label.
Label Distance From Candles (ATR)
Controls vertical spacing between labels and candles.
How to use this indicator
A practical workflow:
1. Check whether EMA 50 is above EMA 200.
2. Check the Chop Zone condition.
3. Check whether the dashboard says OK or NO TRADE.
4. Watch for one of the selected BUY event types.
5. Review the visual Entry, SL / exit reference, and TP reference.
6. Use the tooltip on the label for full signal details.
7. Treat all labels as chart-analysis events, not as automatic trade instructions.
8. Combine the signal event with market structure, volume, higher timeframe analysis, and risk management.
Example interpretation
If a GC BREAKOUT label appears, it means EMA 50 crossed above EMA 200 and the selected breakout conditions were met. It does not guarantee that price will continue higher.
If a PULLBACK label appears, it means price touched the EMA 50 pullback zone and then produced a bullish confirmation candle within the selected confirmation window.
If an EMA50 BOUNCE label appears, it means price touched or nearly touched EMA 50 and closed back above it with a bullish candle.
If an EMA50 RECLAIM label appears, it means price closed back above EMA 50 after previously being at or below it.
If EMA200 EXIT appears, it means the dynamic EMA 200 exit condition was triggered.
If TP HIT appears, it means price reached the visual target reference.
Important limitations
This indicator does not predict future price movement.
It does not guarantee profitable trades.
It does not place orders.
It does not produce Strategy Tester results.
BUY labels are not financial advice.
TP / SL / exit labels are not broker fills.
Dashboard stats are internal visual event counters, not verified backtest statistics.
EMA-based systems can perform poorly in choppy, sideways, or low-volume markets.
Chop Zone classification is based on slope and range normalization, not on future price prediction.
The script is designed mainly for long-side trend-following analysis.
Different symbols, markets, sessions, and timeframes may require different settings.
Users are responsible for their own trade decisions, risk management, and position sizing.
Recommended use
Golden Cross Chob Zone is best used as a decision-support and chart-analysis tool for traders who study:
* Golden Cross / Death Cross structure,
* EMA 50 and EMA 200 trend regimes,
* EMA pullbacks,
* EMA 50 bounces,
* EMA 50 reclaim events,
* trend strength and choppiness,
* visual risk references,
* long-side trend continuation conditions.
It should be used as one part of a broader trading process, not as a standalone trading system.
Originality and purpose
Golden Cross Chob Zone combines several visual and analytical components into one workflow:
* EMA 50 / EMA 200 regime detection,
* Golden Cross breakout logic,
* Chop Zone trend-strength filter,
* pullback / bounce / reclaim entry-event logic,
* sideways market filtering,
* visual Entry / SL / TP references,
* dynamic EMA 200 exit option,
* compact labels with detailed tooltips,
* dashboard state monitoring,
* alert conditions for key events.
The purpose is to help users study bullish trend-continuation conditions with clearer visual context and fewer signals during weak or sideways conditions.
Indikator

Indikator

Indikator

Indikator

MA Suite SMA + EMA [Institutional]MA Suite SMA + EMA
A single overlay that replaces a whole stack of separate moving-average indicators. It plots up to 6 fully configurable SMAs and 6 EMAs side by side, with everything you need to read trend structure at a glance — and nothing you have to fight with.
Core
- 6 SMA + 6 EMA slots, each with its own enable toggle, length, color, and line width.
- Sensible institutional defaults (20 / 50 / 100 / 150 / 200) with the 20, 50 and 200 emphasized by thickness.
- Disabled lines disappear from both the chart and the status line, so the data window stays clean — you only ever see the values you actually use.
Multi-timeframe
- Compute every MA from a higher timeframe (e.g. show daily MAs while viewing an intraday chart).
- Permanent 20-week and 200-week SMA anchors that hold their value on any lower timeframe, with optional smoothing to remove the weekly "staircase."
Slope projection
- Tick ext on any line to extend it forward along its current slope — a quick look at where a moving average is heading. The 200 SMA and both weekly anchors are projected by default.
Context tools
- % distance table showing how far price sits from each active MA — fast read on stretch and mean-reversion.
- Slope coloring (lines fade when falling) and an optional bias background (price above/below the 200 SMA).
- Golden / death-cross markers, a configurable ribbon fill, and an anchored VWAP with standard-deviation bands.
- Built-in alerts for MA crosses and price/MA crossovers.
One indicator, every moving-average reference an institutional trader actually looks at. Indikator

Indikator

Indikator

Indikator

Arc Radius Trend [JOAT]Arc Radius Trend
Introduction
Arc Radius Trend is an open-source, overlay-based trend-following system that replaces the static ATR band of conventional supertrend-style indicators with a curved, acceleration-responsive radius. The band does not scale linearly with volatility alone — it also responds to how fast price is accelerating or decelerating, expanding when momentum surges and tightening when price action becomes uniform. This gives it a shape that mirrors how institutional participants view momentum: not as a constant envelope, but as one that breathes with the market.
The problem ART solves is over-sensitivity. Standard ATR-based trailing stops flip direction too freely during acceleration events, producing false exits at exactly the moment when the trend is strongest. By expanding the radius during acceleration, ART gives trends room to breathe without permanently widening the band for all conditions.
Core Concepts
1. Velocity and Acceleration from Price
ART computes price velocity as the EMA of the bar-to-bar change in close, and acceleration as the EMA of the change in velocity. Both use the same smoothing length. Acceleration is normalized by ATR so that it is dimensionless and comparable across instruments and timeframes:
velocity = ta.ema(ta.change(close), accelLength)
accel = ta.ema(ta.change(velocity), accelLength)
accelNorm = atr > 0 ? accel / atr : 0.0
2. Curved Radius Scaling
The base radius is ATR multiplied by a configurable multiplier. The acceleration norm is then used to scale that radius with a power function, creating a nonlinear expansion curve. The exponent (Curve Strength) controls how aggressively acceleration widens the band:
radiusScale = math.pow(1.0 + math.min(math.abs(accelNorm), 2.0), curvePower)
radius = atr * baseMult * radiusScale
3. Ratcheting Band Logic
The active band ratchets in the direction of the current trend. When price is above the band (bull), the lower band is preserved at its maximum achieved value, preventing it from retreating while the trend holds. The trend flips when price closes through the opposite band:
trend := close > upperBand ? 1 : close < lowerBand ? -1 : nz(trend , 1)
activeBand = trend == 1 ? lowerBand : upperBand
4. JOAT Institutional Expansion Layer
Each JOAT indicator carries a shared Expansion Layer — an adaptive spine built from price efficiency, Shannon entropy, Parkinson range volatility, and a market impact ratio. The spine tracks the dominant flow using an KAMA-style adaptive constant, and its width is scaled by ATR ratio, range volatility, and noise. Stress and calm rails extend beyond the outer context boundary and change color based on composite stress readings. Bull and bear regime shift nodes mark confirmed directional transitions in the expansion layer state.
Features
Curved radius expansion: Band width nonlinearly expands during price acceleration events
Ratcheting trend band: Lower band preserved on bull trend, upper band preserved on bear trend — no backward drift
Outer envelope: A second ring outside the active band provides an extended volatility reference
Trend-state candle coloring: Candles tinted to reflect current trend direction
Regime flip nodes: Circle markers on the active band at confirmed bull and bear regime transitions
JOAT Expansion Layer: Adaptive spine with efficiency/entropy scoring, context box, stress rails, calm rails, and shift nodes
Stress and calm telemetry rails: Outer halos that widen with impact ratio and volatility stress
Dashboard (top right): Live display of trend state, active band level, normalized acceleration, and last flip
All signals on confirmed bars: No repainting — all state changes fire only on barstate.isconfirmed
Input Parameters
Radius Model:
Radius ATR Length: ATR period for radius computation (default: 21)
Base Radius Multiplier: Baseline band width in ATR units (default: 2.4)
Acceleration Smoothing: EMA length for velocity and acceleration (default: 8)
Curve Strength: Power applied to acceleration scale — higher values expand the band more aggressively (default: 1.35)
Outer Envelope: Multiplier for the secondary outer ring (default: 1.65)
Display:
Trend-State Candles toggle
Show Dashboard toggle
JOAT Expansion Layer:
Efficiency, Entropy, Impact lengths; Adaptive Fast/Slow periods; Context Width
Spine, Context Box, Regime Nodes, Candle Tint, Projection Bars, and Opacity toggles
Independently configurable Bull, Bear, Neutral, and Accent colors
How to Use This Indicator
Step 1: Establish trend direction
Read the active band color and the dashboard. Green indicates bull trend; red indicates bear. Use this as the primary directional filter for entries.
Step 2: Watch for confirmed flip nodes
Circle markers at confirmed trend reversals mark the bar where the band direction changed. These are not entry signals — they are context anchors. Evaluate what triggered the flip (structural break, momentum loss) before acting.
Step 3: Use the outer envelope as a volatility reference
When price extends to the outer envelope, the market is in elevated acceleration. This is not necessarily a reversal signal — it may indicate trend continuation with excess momentum.
Step 4: Read the Expansion Layer spine
The JOAT spine color and state convey institutional flow independent of the ART band. Bull spine with bull ART band is high-confidence alignment. Divergence between the two (e.g., bull ART, neutral spine) suggests weakening conditions.
Indicator Limitations
Acceleration-driven radius expansion may produce very wide bands during high-velocity events, temporarily reducing the band's usefulness as a stop reference
The ratchet mechanism preserves the band in the trend direction — during prolonged consolidation, the band will not tighten until a directional break occurs
On very low-liquidity instruments, the ATR-based radius may be structurally noisy; increasing the ATR length reduces this
Arc Radius Trend does not generate entries. It identifies directional state and provides a trailing reference level
Originality Statement
Arc Radius Trend is original in its use of normalized price acceleration as a multiplicative, power-scaled modifier to ATR radius. Existing supertrend variants use static ATR multiples or linear volatility adjustments. The combination of:
Velocity → acceleration derivation applied to a curved radius (not a flat multiplier)
Power-function scaling that produces nonlinear radius expansion only during acceleration events
Ratcheting band logic that is conditioned on the curved radius (not a fixed channel)
An institutional expansion layer carrying efficiency, entropy, Parkinson range vol, and impact scoring as a second independent context layer
...makes ART a structurally distinct contribution rather than a parameter variation of existing published work.
Disclaimer
This indicator is provided for educational and informational purposes only. It is not financial advice or a recommendation to buy or sell any instrument. Trading involves substantial risk of loss. Past behavior of this indicator does not guarantee future results. All signals should be validated within a complete trading framework that includes risk management. The author is not responsible for trading losses resulting from the use of this indicator.
-Made with passion by jackofalltrades
Indikator

Market Regime RSI MatrixMarket Regime RSI Matrix (MRM)
Market Regime RSI Matrix (MRM) is a multi-timeframe momentum and market context framework designed to transform traditional RSI analysis into a broader market regime model.
Rather than relying on a single RSI reading from the active chart timeframe, this indicator combines RSI measurements from multiple independent timeframes into a weighted composite engine called the Master RSI. It then evaluates the degree of agreement between those timeframes, estimates the persistence of the current market condition, classifies the prevailing market regime, and visualizes these relationships through adaptive momentum zones and dashboard components.
The objective of this script is not to generate isolated buy or sell signals, but to provide a structured view of how momentum is distributed throughout the market across multiple horizons.
📊 How It Works
The indicator is built around a hierarchical momentum framework composed of several interconnected modules.
Multi-Timeframe Master RSI Engine
At the core of the indicator is the Master RSI, a composite momentum value constructed from up to ten independent RSI calculations.
Each timeframe can be individually selected and assigned its own weight.
The composite value is calculated as:
Master RSI =
Σ(RSI × Weight) / Σ(Weight)
This allows shorter-term traders to emphasize lower timeframes, while swing traders can prioritize higher timeframe momentum.
Unlike traditional RSI implementations, the resulting Master RSI represents the collective behavior of multiple market participants operating on different time horizons.
🤝 Consensus Engine
Momentum strength alone does not necessarily imply broad market participation.
To address this, the script measures how many monitored timeframes agree on directional bias.
Each timeframe contributes to a bullish or bearish count according to whether its RSI is above or below the equilibrium level:
Bullish TF:
RSI ≥ 50
Bearish TF:
RSI < 50
Consensus is then calculated as:
Consensus Score =
|Bull TF − Bear TF| / Total TF × 100
Higher values indicate stronger alignment among market participants.
For example:
Consensus = 90%
9 timeframes bullish
1 timeframe bearish
suggests broad agreement across the monitored horizons.
Lower values indicate disagreement and fragmented market participation.
📈 Trend Strength Module
The indicator estimates momentum persistence by smoothing the Master RSI through two exponential moving averages:
Fast Trend EMA = EMA(Master RSI, 5)
Slow Trend EMA = EMA(Master RSI, 13)
The distance between these two curves provides an estimate of directional intensity.
Trend conditions are classified into:
• Weak
• Moderate
• Strong
• Very Strong
This framework helps distinguish between stable trends and environments where momentum lacks conviction.
🎯 Probability Engine
The Probability Engine combines several independent components into a unified score designed to estimate the persistence of the current market condition.
Inputs include:
• Consensus alignment
• Trend strength
• Master RSI positioning
• Dynamic Fibonacci context
The model aggregates these components using weighted contributions:
Probability Score =
Consensus × 40%
+ Trend Strength × 30%
+ Fibonacci Context × 20%
+ RSI Position × 10%
The resulting value is expressed as a percentage.
Higher scores indicate that the current market condition exhibits stronger internal agreement within the framework.
The Probability Score is intended as contextual information and should not be interpreted as a prediction of future price movement.
📐 Adaptive Fibonacci Momentum Zones
Instead of relying on fixed RSI thresholds such as 30 and 70, the script constructs dynamic Fibonacci zones using the observed Master RSI range.
The calculation window automatically adapts to the chart timeframe through the Adaptive Lookback Engine.
Typical lookback behavior:
Lower timeframes:
Longer observation windows
Higher timeframes:
Shorter observation windows
Standard Fibonacci ratios are then projected throughout the observed Master RSI range:
0.000
0.236
0.382
0.500
0.618
0.786
1.000
These zones serve as contextual momentum regions rather than predictive targets.
The indicator additionally estimates the corresponding price levels associated with each momentum zone, allowing users to compare momentum structure with actual price location.
🌡️ Multi-Timeframe RSI Heatmap
To improve readability, the script provides a visual heatmap displaying RSI values from every monitored timeframe.
Each row represents one timeframe and its current RSI value.
Color intensity reflects the relative position of the RSI within its momentum range, allowing users to quickly identify:
• Broad directional alignment
• Divergence between short-term and long-term momentum
• Emerging transitions in participation
The heatmap is intended to complement the Consensus Engine by providing a more granular view of internal market structure.
🧭 Market State Engine
One of the defining components of the framework is the Market State Engine.
Rather than describing conditions simply as bullish or bearish, the indicator classifies the market into five distinct regimes:
Bull Trend
Occurs when:
• Consensus is elevated
• Trend strength is positive
• Probability is high
• Master RSI maintains strong momentum
This environment suggests broad participation and directional persistence.
Bear Trend
Occurs when:
• Consensus is elevated
• Trend strength is negative
• Probability is high
• Master RSI reflects persistent downside momentum
This environment suggests coordinated selling pressure across timeframes.
Accumulation
Occurs when:
• Consensus is limited
• Probability remains subdued
• Master RSI operates below equilibrium
This condition may represent balance-building phases where directional conviction has not yet emerged.
Distribution
Occurs when:
• Consensus remains weak
• Probability remains subdued
• Master RSI operates above equilibrium
This condition may indicate loss of participation following sustained advances.
Transition
Any market environment not satisfying the criteria above is classified as Transition.
These phases often occur during regime changes, trend exhaustion, or evolving participation dynamics.
⚙️ Customization Options
Users can configure:
• Up to ten independent RSI timeframes
• Individual timeframe weights
• RSI calculation length
• Signal smoothing length
• Adaptive or manual Fibonacci lookback
• Fibonacci visualization settings
• Heatmap visibility
• Dashboard display preferences
This flexibility allows the framework to adapt to different asset classes, trading styles, and analytical objectives.
📖 How To Use
Possible applications include:
Use Consensus as a directional filter.
Higher Consensus values suggest broader market agreement.
Monitor Probability before acting on directional setups.
Increasing Probability may indicate strengthening market conditions.
Use Market State to identify the dominant regime.
Trend environments and transitional environments often require different decision-making approaches.
Observe the Heatmap for internal divergence.
Conflicting lower and higher timeframe momentum may signal weakening participation.
Use Fibonacci Momentum Zones as contextual reference areas.
These regions are intended to frame momentum behavior rather than provide precise price targets.
The indicator is designed to complement existing analytical processes and may be combined with price action, market structure, volume analysis, or individual risk management techniques.
💡 Originality
This script represents an original framework that integrates weighted multi-timeframe momentum aggregation, participation consensus measurement, adaptive momentum zoning, probability modeling, and market regime classification into a unified analytical dashboard.
Its primary innovation lies in treating RSI not as an isolated oscillator, but as a distributed representation of market participation across multiple horizons.
The combination of:
• Weighted Master RSI construction,
• Consensus-based participation analysis,
• Adaptive Fibonacci momentum zones,
• Composite probability estimation,
• Multi-timeframe heatmap visualization,
• and Market State classification,
forms a cohesive framework designed to improve contextual awareness rather than generate deterministic trading signals.
This complete implementation was developed as an integrated analytical model and is not derived from any previously published TradingView script.
⚠️ Disclaimer
This script is provided for educational and informational purposes only.
It does not constitute financial advice, investment advice, trading advice, or a recommendation to buy or sell any financial instrument.
All calculations are derived from historical market data and mathematical transformations of price behavior. Technical analysis is inherently uncertain, and past performance does not guarantee future results.
Users should conduct their own research and apply appropriate risk management before making trading decisions. Indikator

McGinley Dynamic + LWPI ConfluenceWHAT IT DOES
This overlay combines two complementary reads of the market into a single confluence framework: the McGinley Dynamic, an adaptive trend line that speeds up when price runs and slows down in quiet conditions, and the Larry Williams Proxy Index (LWPI), a volatility-scaled balance-of-power oscillator. A signal prints only when both engines agree: trend direction from the McGinley Dynamic, momentum confirmation from the LWPI.
WHY COMBINE THEM
Every fixed-length moving average lags by a constant amount, which makes it too slow in fast markets and too jumpy in slow ones. The McGinley Dynamic addresses that by scaling its own smoothing factor with the ratio of price to its previous value — but, like any trend line, it says nothing about who is actually in control of the move. The LWPI measures exactly that: the average open-to-close pressure normalized by ATR. On its own, however, the LWPI whipsaws inside strong trends. Each component covers the other's blind spot, which is the reason for the mashup: the McGinley Dynamic decides direction, the LWPI decides timing.
HOW IT WORKS
1. Trend engine — McGinley Dynamic:
MD = MD + (price - MD ) / max(k * N * (price / MD )^4, 1)
The fourth-power ratio term automatically widens the divisor when price stretches away from the line, reducing overshoot and whipsaw versus EMAs of comparable length. Price above the line = bullish regime (line plots green), below = bearish (red).
2. Momentum engine — LWPI:
LWPI = 50 * SMA(open - close, N) / ATR(N) + 50
Readings below 50 mean closes are dominating opens relative to volatility (buyers in control); above 50, sellers are in control. Optional smoothing (SMA/EMA/WMA/RMA) is available for noisy symbols.
3. Confluence logic:
- Long state: price above McGinley Dynamic AND LWPI below 50
- Short state: price below McGinley Dynamic AND LWPI above 50
A triangle prints on the first bar a state becomes active. The optional candle coloring shows the full extent of each state; the dashboard in the top-right corner summarizes trend, momentum and confluence at a glance.
4. ATR reference bands:
Dotted bands at +/- ATR * multiplier around price provide volatility context, e.g. for evaluating whether a stop distance is realistic for the symbol and timeframe. They are informational and not part of the signal logic.
HOW TO USE IT
Works on any market and timeframe; it was designed with trending instruments in mind (crypto, FX majors, index futures). A simple workflow: read the regime from the line color, wait for the LWPI to hand momentum back to the trend side, and use the confluence triangle as your alert to start analyzing — not as an automatic entry. The three built-in alerts (long confluence, short confluence, trend flip) let you monitor multiple symbols without watching charts.
SETTINGS
All defaults are textbook values, not curve-fitted: McGinley length 14 with the standard 0.6 constant from the original formula, LWPI period 8, ATR 14 with a 2.0 multiplier. Every input is documented with tooltips.
CREDITS
The McGinley Dynamic concept belongs to John R. McGinley, CMT. The Larry Williams Proxy Index concept was popularized on TradingView by loxx, whose open-source work this script's momentum component builds on, with thanks.
DISCLAIMER
This is an educational tool for market analysis. It is not financial advice and no performance is implied or promised. Always do your own research.
Indikator

Velocity Breakout Strategy (VBS)Overview
The Velocity Breakout Strategy (VBS) is a comprehensive, institutional-grade swing trading system designed to identify high-probability momentum shifts. Rather than relying on a single lagging indicator, VBS synthesizes five distinct dimensions of market data: Macro Trend, Market Structure, Smart Money Concepts (SMC) valuation, Volatility (ATR/ADX), and Intrabar Volume Delta.
The goal of VBS is to filter out low-probability "chop" and only trigger entries when structural momentum aligns with aggressive buying volume.
Core Mechanics & Underlying Logic
1. Trend & Gradient Cloud Baseline The foundation of VBS is a multi-timeframe moving average system utilizing a Micro (9), Fast (20), and Slow (50) EMA. The relationship between the Fast and Slow EMAs paints a dynamic Gradient Cloud, instantly visualizing the macro trend.
2. Intrabar Volume Delta Estimation Standard volume tells you how much was traded, but not who was in control. VBS includes a custom Volume Delta Estimation engine. It approximates buying vs. selling pressure within a single candle by analyzing where the candle closes relative to its total high-to-low range.
The Filter: VBS can be configured to strictly block any buy signals if the current candle exhibits negative Delta (where estimated selling pressure outweighs buying pressure), preventing entries into hidden institutional distribution.
3. Smart Money Concepts (SMC) Valuation Zones VBS calculates a rolling 100-bar Dealing Range to map out institutional liquidity. It splits this range to identify "Premium" (overvalued) and "Discount" (undervalued) zones. The strategy actively looks for pullback entries (Reloads) when the asset drops into the Discount zone.
4. Volatility & Dynamic ATR Trailing Stops Risk management is handled by a responsive ATR Trailing Stop that adapts to the Average Directional Index (ADX).
During trending phases, the ATR multiplier is wide to let the trade breathe.
When the ADX detects a volatility "Squeeze" (ADX < 20), VBS dynamically tightens the ATR multiplier, protecting profits before a sudden volatile expansion occurs.
5. Master Candle Consolidation VBS scans for extreme volatility contraction using a "Master Candle" concept. If the price prints 4 consecutive bars entirely within the High/Low bounds of a previous Master Candle, the system arms a Breakout Trigger.
Entry Signals (When to Buy)
VBS generates specific, visual entry signals on the chart:
A+ Buy (Lime Triangle): A Golden Cross (20/50 EMA) occurs simultaneously with a verified Higher Low in market structure, backed by positive volume delta.
Risky Buy (Orange Triangle): A Golden Cross occurs, but the strict Higher Low market structure is not yet confirmed.
Bullish Reload (Blue Arrow): A zero-lag pullback entry. Price dips into the SMC Discount zone, touches the Fast EMA, and sweeps liquidity (long lower wick), closing with positive delta.
Consolidation Breakout (Purple Arrow): Price violently breaks the bounds of a 4-bar Master Candle consolidation in the direction of the macro trend.
Exit Strategy (When to Sell)
ATR Trail Exit (Red Down Triangle): The primary exit. Triggers when price closes below the dynamic ATR Trailing Stop.
Macro Break: A failsafe exit triggered if a Death Cross (20 EMA crossing under 50 EMA) occurs while holding a position.
The Strategy Manual: How to Use the Settings
We have built a professional-grade algorithm, which means it has "levers" designed to adapt to almost any market condition. Think of these settings as the steering wheel, gas pedal, and brakes for your strategy. Here is your complete manual on exactly what each setting does, when to change it, and how to use it.
1. Moving Averages & Trend These define the "macro environment." They tell the algorithm whether it is allowed to look for long setups or if it needs to stay out.
Micro EMA Length (Default: 9): The fast-moving trigger line. Decrease to 5 if you are scalping on a 1-minute chart. Increase to 12 if you want to ignore tiny 1-bar pullbacks.
Fast/Slow EMA Length (Default: 20/50): The core trend cloud. If you are swing trading daily charts and want to catch massive, long-term trends, change these to the traditional 50 and 200.
2. Smart Triggers & Structure This is the "Brain" of the algorithm that filters out bad setups.
Real-Time Lookback (Micro) (Default: 12): How many candles backward the script looks to verify a recent "Higher Low" was made before a crossover. If the script is missing valid entries because the pullback was long and drawn out, increase this to 20.
Pivot Lookback/Forward (Macro) (Default: 5): Purely visual. It dictates how many candles are needed to confirm the HH/LL text labels on the chart.
Require Higher Low for A+ Entry (Default: Checked): The strictest safety filter. Uncheck this if you are trading highly volatile assets (like Crypto) that often V-bottom and explode upward without stopping to form a higher low.
Max Run-up % (Chase Filter) (Default: 10.0): Stops the algorithm from buying if the price has already pumped 10% from the bottom. If you are trading Small Caps that regularly pump 30% in a single candle, you must increase this to 20 or 30.
Block Entries in Gray Chop Zone (Default: Checked): The anti-whipsaw filter. Uncheck only if you are actively trying to buy at the absolute bottom of a sideways consolidation box before the momentum officially kicks in.
3. Master Candle Consolidation Your custom logic for catching coiled breakouts.
Required Follow-up Bars (Default: 4): How many candles must get trapped inside the Master Candle. Reduce to 3 on high-timeframes (Daily/Weekly) where 4 days of resting is rare. Increase to 6 or 8 on 5-minute charts to ensure the consolidation is truly exhausted.
Use Master High/Low Bounds (Default: Checked): If unchecked, it only uses the candle body (Open to Close). Uncheck this on highly volatile, "wicky" charts where a single stray wick keeps ruining your consolidation count.
Require Bull Trend & Green ATR for Breakout (Default: Checked): Uncheck this if you want to trade "Reversal Breakouts" (buying an upward breakout before the macro trend has officially flipped bullish).
4. Smart Money Concepts (SMC) Ensures you are buying at a wholesale price.
Dealing Range Lookback (Default: 100): Decrease to 50 for faster, more aggressive zone shifting during rapid market regimes.
Require SMC Zone for Reloads (Default: Checked): Uncheck this during a raging, parabolic bull market where price never pulls back deep enough to hit the discount zone.
5. Dynamic ATR Exits (ADX Squeeze) Your trailing stop-loss manager.
Base ATR Multiplier (Trend) (Default: 3.0): Change to 2.0 for tighter risk management on large-cap stocks. Increase to 4.0 or 5.0 for highly erratic Crypto assets.
Tight ATR Multiplier (Chop) (Default: 1.5): The "choke" stop. Keep this very tight (1.0 to 1.5) to protect profits when momentum dies.
ADX Squeeze Threshold (Default: 20): Increase to 25 if you want the algorithm to aggressively lock in profits the second a trend shows minor weakness.
6. Volume Analysis & POC (Visuals)
Volume Lookback & StDev Multiplier: These dictate when the Fuchsia (Distribution) and Blue (Accumulation) diamonds appear. If you are getting too many diamond alerts, increase the Multiplier to 4.0 so it only flags true anomaly volume.
POC Profile Rows (Default: 40): Resolution of the Volume Profile calculation that draws the yellow Point of Control line. Increase to 100 for a more precise POC line. Decrease to 20 if your TradingView app is lagging.
The VBS Dashboard
The script features a built-in, non-intrusive HUD (Heads Up Display) utilizing a "Lazy-Draw" architecture to prevent memory buffer crashes. It provides a real-time readout of:
Current Macro Trend & Market Structure (HH/HL/LL/LH)
Intrabar Delta State (Positive/Negative)
Volatility State (Expanding vs. ADX Squeeze)
Current SMC Zone (Premium vs. Discount)
Real-time Stop Risk (%)
Usage & Backtesting Notes
By default, the strategy is optimized for comprehensive backtesting. It utilizes a fixed quantity size (qty=1) and allows pyramiding. This ensures the Strategy Tester captures and records the success rate of every single signal generated by the engine, providing a pure, unclouded view of the strategy's mathematical edge.
Disclaimer: VBS is an educational tool designed for analyzing market structure and volume dynamics. It does not guarantee profits. Always use proper risk management and test extensively on paper before deploying real capital.
Strategi

MARs - Moving Average Ribbon SciroccoInitially, I decided to build this indicator simply to bundle multiple moving averages together under a single script to save chart space. However, I chose to completely overhaul and improve the design to transform it into an institutional-grade, multi-timeframe trend visualization and analysis system.
Optimized for dark-theme chart layouts and named after the high-velocity, dust-carrying desert windstorms, the Moving Average Ribbon Scirocco (MARs) unifies independent multi-timeframe data structures, directional price momentum, and volume-weighted confirmation thresholds into a single, cohesive channel overlay.
Why MARs is Useful
- Eliminates Screen Flipping: Traditional charting ribbons require constant switching between multiple chart intervals to stay aligned with the dominant trend. MARs solves this by anchoring independent timeframe inputs to each of the four moving averages individually. This allows you to track multiple higher-timeframe macro baselines (like 4-hour, Daily, or Weekly trends) directly on a lower execution chart (like a 1-minute or 5-minute chart) without constantly changing screens or splitting your workspace.
- Absolute Momentum Slope Vectoring: MARs circumvents this by ditching screen-based spatial positioning entirely. Instead, it utilizes absolute slope momentum vectors calculated through sequential ta.rising() and ta.falling() states on the underlying series. This mathematical approach guarantees that the directional colors remain locked to their true momentum axes regardless of how high or low your active chart grid is scaled.
- Fixes Color Inversions: Standard multi-timeframe ribbons rely on a simple visual overlay, which causes the colors to flip backwards or invert when you move to a higher chart interval due to historical bar compression. MARs isolates momentum trends at their native calculation source to keep color maps perfectly accurate on all scales.
What Makes It Unique
- Persistent Visual Framework: Standard ribbons break or return an na element the moment a user toggles a single line off in the settings menu. MARs solves this via a dynamic boundary engine built with algorithmic math.max() and math.min() arrays paired with non-zero element converters (nz()).
- Adaptive Anchor Logic: The indicator reads your active user checkbox selections bar-by-bar in real-time; if you hide individual moving averages to clean up your workspace, the background cloud instantly re-anchors itself to the next closest visible line, keeping the channel fill functional.
- Universal Asset Compatibility: Standard indicators with volume-weighted elements crash or turn completely invisible when applied to assets that lack native volume tracking data (such as Forex spot pairs, Crypto CFDs, Commodities, or indices like SPX).
- Volume Safety Net: MARs features an automated volume safety-net mechanism that samples a 10-period smoothing filter. If it detects zero volume, the script instantly bypasses the volume engine and defaults to a stable, visible base opacity, providing a seamless analysis experience across all financial asset classes.
Finding Your Own Way to Use It
- No Rigid Signals: Because MARs was explicitly engineered without rigid, pre-programmed "buy/sell" arrow signals or directional labels, it does not dictate how you must trade.
- Discover Your Own Edge: The true value of the indicator comes from discovering your own systematic edge through a personalized combination of moving average styles (SMA, EMA, SMMA, WMA, or VWMA), customized lengths, and specific timeframe steps.
- Objective Toolkit: By stripping away prescriptive text and leaving interpretation to the trader, MARs functions as an objective diagnostic toolkit that can be customized for short-term intraday momentum scalping, long-term swing trading, or indicator-on-indicator sourcing.
Core Functionality
- Dual-State Volume Confirmation Engine: Evaluates price expansion against a 20-period simple moving average of volume. The background channel instantly brightens into high-visibility thermal colors when structural expansion is backed by institutional volume, and automatically mutes its opacity when volume drops below average to warn you of low-participation breakouts.
- Anti-Repaint Protective Framework: Technical calculation loops are isolated inside encapsulated function blocks via request.security() with barmerge.lookahead_off. This guarantees that your historical chart lines are locked into place exactly as they appeared in real-time, eliminating future-data leaking and data distortion.
- Achromatic Martian Thermal Palette: Designed specifically to reduce eye strain and eliminate visual fatigue during long trading sessions on dark background layouts. The moving average lines form a clean, static gradient, while the background fill shifts between Vibrant Solar Gold, Martian Core Orange, and Molten Crimson Red, fading completely into a dark Obsidian Gray mask to tell you exactly when the market has flattened out into a tight consolidation squeeze.
Fully Customizable Theme: If you are not satisfied with these default theme selections, the color scheme remains fully customizable, allowing you to re-map both the individual lines and the background cloud states via the TradingView interface to match your exact visual preference.
Conclusion
The Moving Average Ribbon Scirocco (MARs) marks a complete overhaul of traditional charting ribbons, transforming a standard space-saving bundle into a robust, multi-timeframe trend analysis system. By filtering noise through volume validation, securing lines against historical repainting, and utilizing absolute slope vectors to permanently prevent color inversions, the indicator delivers an objective, mathematically precise overview of the market.
Ultimately, MARs serves as a versatile, high-contrast diagnostic toolkit designed to integrate cleanly into your workspace, giving you the freedom to build, refine, and execute your own systematic trading edge. Indikator

Indikator

Arc Trail Regime [JOAT]Arc Trail Regime is an open-source Pine Script v6 overlay that builds an accelerating trail around an adaptive EMA arc and gates directional flips with VWAP location. It is designed to show when price has crossed a dynamic trailing level while the broader value anchor agrees with the new side.
The script focuses on a smooth regime trail rather than many signal markers. It displays the active arc, a soft cloud, optional gradient candles, and right-edge shelf levels created after confirmed flips.
Core Concepts
1. Adaptive Arc Core
The core blends fast and slow EMA curves. The blend weight increases when recent speed and volatility expansion increase, which makes the arc respond faster during active movement.
speedRaw = math.abs(ta.ema(ta.change(sourceInput), 4)) / atrValue
volRatio = nz(ta.ema(atrValue, 5) / ta.ema(atrValue, 55), 1.0)
curveWeight = f_clamp(0.38 + speedNorm * 0.18 + volSpeed * 0.22, 0.25, 0.82)
arcCore = ta.ema(slowArc + (fastArc - slowArc) * curveWeight, 3)
2. VWAP Gate
Bull flips require price to be above VWAP. Bear flips require price to be below VWAP. This keeps the trail aligned with a basic value-location filter.
3. Accelerating Trail Width
The trail distance uses ATR and a volatility speed boost. During active movement, the trail can tighten within bounds so it reacts faster to regime changes.
4. Confirmed Flip Shelves
When a confirmed regime flip occurs, the script draws a shelf line near the flip bar. The shelf remains active until price invalidates it.
5. Distance Candles
Candles can be colored from bearish to bullish based on their normalized distance from the active trail.
Features
Adaptive arc core: Blends fast and slow curves by speed and volatility
VWAP-gated flips: Direction changes require price location agreement
ATR trail: Trail distance scales with chart volatility
Arc cloud: Soft band around the active trail
Active shelves: Right-edge support/resistance references after confirmed flips
Confirmed buy/sell flip markers: Compact BUY and SELL dots are offset away from candles and only print after confirmed regime flips
Gradient candles: Optional candle coloring by trail distance
Dashboard: Shows regime, VWAP side, distance, speed, and shelf status
Alerts: Confirmed bull flip and confirmed bear flip
Input Parameters
Visuals:
Palette Preset: Selects bull and bear colors
Arc Cloud: Shows the trail cloud
Gradient Candles: Enables candle coloring
Confirmed Flip Signals: Shows compact BUY and SELL flip markers
Active Shelves: Shows flip shelf lines and labels
Engine:
Source: Price source
Inner Curve Length: Fast EMA length
Outer Curve Length: Slow EMA length
ATR Length: Volatility length
Base Trail Width: Starting ATR trail multiplier
Volatility Speed Boost: Controls how much expansion affects the trail
How to Use This Indicator
Step 1: Read the Active Regime
The dashboard shows Bull or Bear based on the active trail side.
Step 2: Confirm VWAP Location
The VWAP row shows whether price is above or below the value gate used by the script.
Step 3: Monitor Shelves
Shelf lines are created after flips and can act as visual invalidation references.
Indicator Limitations
Trail systems can whipsaw during sideways markets
VWAP behavior varies across sessions and symbols
A shelf is a visual reference, not a complete stop model
Fast volatility shifts can temporarily widen or tighten the trail abruptly
Originality Statement
Arc Trail Regime is original in its adaptive arc weighting, VWAP-gated regime flips, speed-sensitive trail width, and active shelf visualization. It is built with original Pine v6 code and public chart data.
Disclaimer
This script is provided for educational and informational use only. It is not financial advice or a recommendation to buy or sell any financial instrument. Trading involves substantial risk of loss. Trail flips can fail in range conditions or during abrupt volatility changes. Always use independent analysis and proper risk management.
-Made with passion by jackofalltrades
Indikator

Adaptive Divergence Core [JOAT]Adaptive Divergence Core is an open-source Pine Script v6 oscillator that combines HMA-smoothed RSI behavior, adaptive percentile bands, confirmed divergence lines, and regime fills. It is designed to make oscillator extremes relative to the current chart sample instead of relying only on fixed overbought and oversold levels.
The script is useful when standard oscillator thresholds are too rigid. A market can stay strong or weak for long periods. Adaptive Divergence Core recalculates upper and lower fields from recent oscillator distribution, then plots confirmed divergence only after both price and oscillator pivots are confirmed.
Core Concepts
1. HMA-RSI Core
The oscillator blends RSI on raw price, RSI on HMA-smoothed price, and an HMA-smoothed RSI value. It is centered around zero for easier bullish and bearish reading.
hmaSource = ta.hma(src, hmaLen)
rawRsi = ta.rsi(src, rsiLen)
rsiOnHma = ta.rsi(hmaSource, rsiLen)
smoothedRsi = ta.hma(rawRsi, smoothLen)
core = (rsiOnHma * 0.58 + smoothedRsi * 0.42) - 50.0
2. Adaptive Percentile Bands
The upper and lower bands are calculated from rolling percentiles of the oscillator. This lets the bands adapt to the recent distribution of momentum.
upperRaw = ta.percentile_nearest_rank(core, percentileLength, upperPercentile)
lowerRaw = ta.percentile_nearest_rank(core, percentileLength, lowerPercentile)
3. Extreme Fields
Additional 95th and 5th percentile fields help show deeper oscillator stretch zones beyond the primary adaptive bands.
4. Confirmed Divergence Detection
Bearish divergence requires price to form a higher confirmed pivot high while the oscillator forms a lower confirmed pivot high. Bullish divergence requires price to form a lower confirmed pivot low while the oscillator forms a higher confirmed pivot low.
5. Regime Fill
The script fills the oscillator against zero and against its guide line, making positive and negative regimes easy to read without large markers.
Features
HMA-RSI oscillator: Blends raw RSI, RSI on HMA, and smoothed RSI
Adaptive percentile bands: Upper and lower thresholds adjust to recent oscillator behavior
Extreme bands: Additional outer fields for deeper stretch readings
Confirmed divergence lines: Divergences plot only after price and oscillator pivots confirm
Divergence labels: Small S Div and B Div labels are placed near confirmed divergence lines
Divergence line cap: Old lines are deleted to respect object limits
Optional candle tint: Can color chart candles from the oscillator pane setting
Dashboard: Shows core value, bands, divergence counts, and current field
Alerts: Divergence, band entry, and band release conditions
Input Parameters
Core:
Source: Price source
RSI Length: Base RSI period
HMA Price Length: HMA source smoothing
HMA RSI Smooth: Smoothing for the raw RSI component
Adaptive Bands:
Percentile Length: Lookback used for adaptive thresholds
Upper Percentile: Upper adaptive threshold percentile
Lower Percentile: Lower adaptive threshold percentile
Divergence:
Divergence Left Bars / Right Bars: Pivot confirmation settings
Maximum Divergence Lines: Object cap for plotted divergence lines
Divergence Labels: Shows or hides compact divergence labels
Visuals:
Tint Candles: Optional candle tint from the oscillator state
Show Dashboard: Shows or hides the compact top-right pane dashboard
Palette: Selects the local JOAT color preset
How to Use This Indicator
Step 1: Read the Core Relative to Zero
Values above zero show positive oscillator regime. Values below zero show negative oscillator regime.
Step 2: Use Adaptive Bands
When core enters the upper or lower adaptive band, momentum is stretched relative to its recent sample.
Step 3: Evaluate Divergence After Confirmation
Divergence lines are delayed by pivot confirmation. This is intentional and avoids projecting unconfirmed pivots into the past.
Indicator Limitations
Divergences confirm late because pivots need right-side bars
Adaptive bands depend on the selected lookback and can shift over time
Divergence is context, not a complete trade plan
During strong trends, oscillator stretch can persist for many bars
Originality Statement
Adaptive Divergence Core is original in its HMA-RSI blend, rolling percentile threshold system, confirmed pivot divergence logic, and compact dashboard. It uses public Pine v6 functions to build a distinct oscillator workflow.
Disclaimer
This script is provided for educational and informational use only. It is not financial advice or a recommendation to buy or sell any financial instrument. Trading involves substantial risk of loss. Oscillator divergences can fail or remain early for extended periods. Always use independent analysis and proper risk management.
-Made with passion by jackofalltrades
Indikator

9 / 21 EMA Pullback Scalper | 5mEasy scalping method off the 9/21 EMA. Uses the 5 min TF. Best if only done from 9:45-15:00 time zone.
Use 9 EMA + 21 EMA on the 5m chart
Enter when price pulls back to the 9 EMA in a trending move
Only trade when 9 EMA is above 21 EMA (long) or below (short)
Simple, visual, easy to execute fast with alerts.
Element: Description
9 EMA line: Bold, colored green in bull trend / red in bear trend
21 EMA line: Same color, slightly faded
Shaded fill: Between the two EMAs — instantly shows trend strength and direction
BUY / SELL: Arrow labels at signal bars. Hover for RSI, EMA values, gap %
Stop-Loss dashed line: Drawn at the lowest low (long) or highest high (short) of the last 3 bars
Info table: Bottom-right corner — live trend, 9 EMA, 21 EMA, RSI, gap %
RSI Filter Blocks longs above 70, shorts below 30
EMA Gap Filter Requires minimum 0.05% spread between EMAs — kills signals in sideways chop
Cooldown Minimum 5 bars between same-direction signals — stops cluster spam Indikator

Indikator

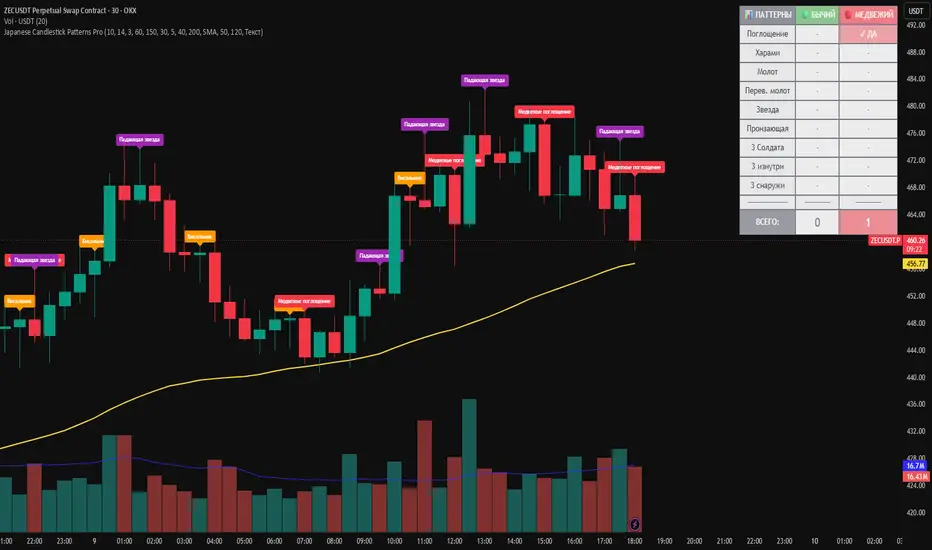
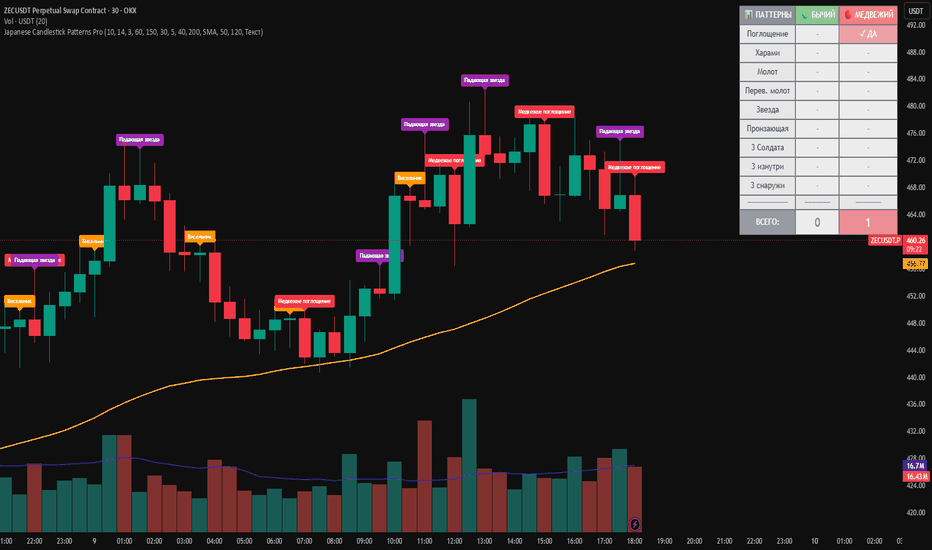
Japanese Candlestick Patterns ProJapanese Candlestick Patterns Pro
Candlesticks are the language of the market. Every candle tells a story — pressure, hesitation, rejection, strength, weakness, fear, and momentum. Japanese Candlestick Patterns Pro is designed to help traders read that story faster and more clearly.
This indicator automatically detects key Japanese candlestick patterns directly on the chart, helping you identify potential reversal, continuation, and market reaction zones without manually scanning every candle.
It highlights both bullish and bearish formations, including engulfing patterns, harami, hammer, hanging man, inverted hammer, shooting star, morning star, evening star, piercing line, dark cloud cover, three white soldiers, three black crows, inside days, and outside days.
The goal of this tool is not to predict the market blindly. The goal is to bring structure to price action and help you notice moments where the balance between buyers and sellers may be changing.
Main features:
• Automatic detection of classic Japanese candlestick patterns
• Bullish and bearish pattern recognition
• Trend filter using SMA or EMA
• Optional volume filter
• Text labels, symbols, or both
• Visual table with active bullish and bearish patterns
• Alerts for key candlestick setups
• Flexible settings for body size, shadows, trend conditions, and pattern filtering
This indicator is useful for traders who want to combine traditional candlestick analysis with a more systematic approach. It can help you quickly spot important price action signals, confirm your own analysis, and avoid missing key candle formations during fast market movement.
Recommended use:
Start with higher timeframes to understand the main market direction.
Use candlestick patterns near support, resistance, liquidity zones, or trend areas.
Do not trade every signal blindly. Look for confirmation from structure, volume, and market context.
Use alerts to monitor important setups without watching the chart constantly.
Japanese Candlestick Patterns Pro is built for traders who respect price action and want to see the market with more discipline, clarity, and control.
This is not financial advice. Always use proper risk management and test the indicator on your own market, timeframe, and trading strategy.
Follow Golden_WolfAI.
Indikator
EMA Ribbon 50/100/200/300/350A clean five-line EMA ribbon — 50 · 100 · 200 · 300 · 350 — built around one
idea: the COLOR alone tells you which average you're looking at.
The lines follow a warm→cool ramp (amber → orange → magenta → blue → indigo), so
warmth and brightness fall as the EMA slows: a warm, bright line is always a fast
average, a cool, deep one always slow. Pure red and green are avoided so a line
is never mistaken for a bull/bear candle. The 200 is drawn a touch thicker to
keep the most-watched average prominent.
Every line has its own on/off toggle, length, and color. The averages are
standard ta.ema on price — fully causal, so nothing repaints.
A visual reference for moving-average structure, not a signal generator: no
arrows, no alerts.
Settings: a shared price source, plus a show toggle, length, and color for each
of the five EMAs.
Open-source. Not financial advice. Indikator

Indikator

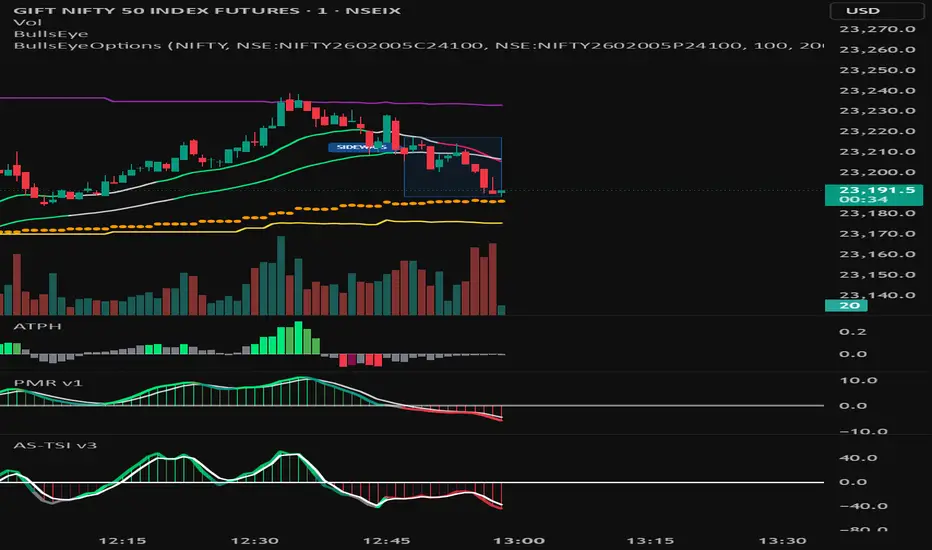
Trend Navigator - Bulls Eye - Options Trade# GN-CE-PE State Engine
## Overview
GN-CE-PE State Engine is a market participation and synchronization tool designed to help traders assess directional conviction across multiple related instruments.
The indicator monitors the relationship between:
* Gift Nifty
* At-The-Money Call Options
* At-The-Money Put Options
and transforms their combined behavior into a set of actionable market states.
Rather than analyzing a single chart in isolation, the engine focuses on whether bullish or bearish participation is developing in a coordinated manner across the underlying market and its options.
---
## Market States
### Bull Trend
Indicates broad bullish participation and directional alignment across the monitored instruments.
---
### Bear Trend
Indicates broad bearish participation and directional alignment across the monitored instruments.
---
### Reset
Represents a pause, pullback, or temporary loss of momentum within an existing directional move.
This state can help traders identify periods where the market is rebalancing before a potential continuation.
---
### CE Ready
Highlights conditions where bullish participation is strengthening and directional alignment is improving.
---
### PE Ready
Highlights conditions where bearish participation is strengthening and directional alignment is improving.
---
## Dashboard
The built-in dashboard provides a real-time summary of:
* Market bias
* Participation strength
* Momentum state
* Directional alignment
* Confidence score
* Current market condition
This allows traders to quickly assess market structure without switching between multiple charts.
---
## Confidence Score
The confidence score reflects the degree of alignment between the monitored instruments.
Higher scores suggest stronger participation and greater directional agreement, while lower scores often indicate mixed conditions or transitional phases.
The score is intended as a contextual aid and should not be used as a standalone trading signal.
---
## Alerts
The indicator includes alert conditions for:
* CE Ready
* PE Ready
allowing traders to monitor potential opportunities without continuously watching the chart.
---
## Recommended Usage
GN-CE-PE State Engine is designed to complement the **Trend Navigator - BullsEye** indicator.
Suggested workflow:
### Step 1
Use **Trend Navigator - BullsEye** to determine the prevailing market structure and directional bias.
### Step 2
Use **GN-CE-PE State Engine** to evaluate whether participation across the underlying market and options is supporting that directional view.
### Step 3
Focus on opportunities where both indicators are aligned.
This combination helps traders distinguish between isolated price movements and moves that are supported by broader market participation.
---
## Notes
* Designed primarily for intraday market analysis.
* Option symbols should be updated to match the active trading series.
* Intended as an analytical and decision-support tool.
* Not financial advice.
## Disclaimer
This indicator is intended for educational and analytical purposes only. It is designed to assist traders in evaluating market participation, directional alignment, and market structure across the monitored instruments.
The indicator does not predict future price movements and should not be considered a recommendation to buy, sell, or hold any financial instrument. All trading decisions should be made using independent analysis, proper risk management, and personal judgment.
Past market behavior does not guarantee future results. Users are solely responsible for their trading decisions and any resulting gains or losses. Indikator

Indikator