
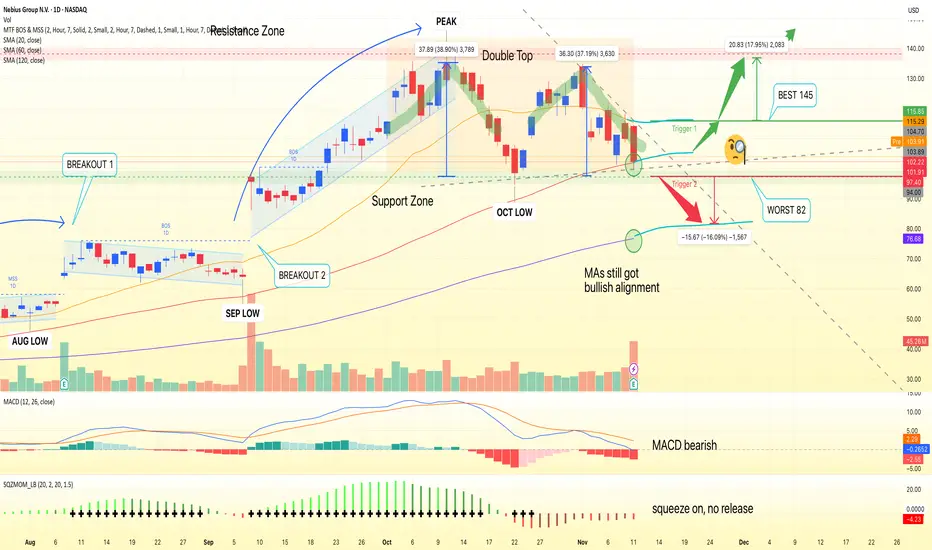
NBIS spent most of 2025 trending higher, but the tone flipped after late-October’s peak. Price sliced below the 20- and 60-day MAs and is now pressing a critical demand zone at 101.91–99.80 (neckline/MA60 vicinity). A clear Double Top at 135.00 caps the structure, while MACD momentum is decisively negative and Bollinger Bands are opening—classic fuel for continuation if support gives way.
Primary path: a daily close beneath 99.80—and especially <97.00—confirms the breakdown and activates the double-top objective. That opens 95.00 first, then the 90.00–88.00 support zone, with an extension risk toward 82.00 on a measured move. Any weak bounce that stalls under 110.00 keeps sellers in control. For risk control on shorts, an invalidation is a daily close back above 115.50 (reclaiming the 20-day and negating the breakdown).
Alternative: if buyers defend 99.80–102.22 and price reclaims 115.50, that would suggest a failed breakdown. In that case, squeeze pressure can unwind higher toward 112.00–120.00, with 135.00 the larger supply to watch. Bulls are only back in charge on a sustained hold above 115.50; lose 99.80 on a closing basis and the bearish thesis remains the higher-probability track.
Thought of the Day 💡
At turning points, clarity comes from behavior at the line in the sand. Trade the confirmation, not the hope.
This is a study, not financial advice. Manage risk and invalidations
הערה
🎁 Please hit the like button and🎁 Leave a comment to support my work!

follow my X 👉 x.com/bbqgio
🔥 level up your Stock, FX, & Crypto: VIP access to AI technical analysis and pro market insights at TradeOS + 50%-off promo code ONBOARD 👉
ai.tradeos.xyz/?utm_source=tvbg
🔥 level up your Stock, FX, & Crypto: VIP access to AI technical analysis and pro market insights at TradeOS + 50%-off promo code ONBOARD 👉
ai.tradeos.xyz/?utm_source=tvbg
כתב ויתור
המידע והפרסומים אינם מיועדים להיות, ואינם מהווים, ייעוץ או המלצה פיננסית, השקעתית, מסחרית או מכל סוג אחר המסופקת או מאושרת על ידי TradingView. קרא עוד ב־תנאי השימוש.