
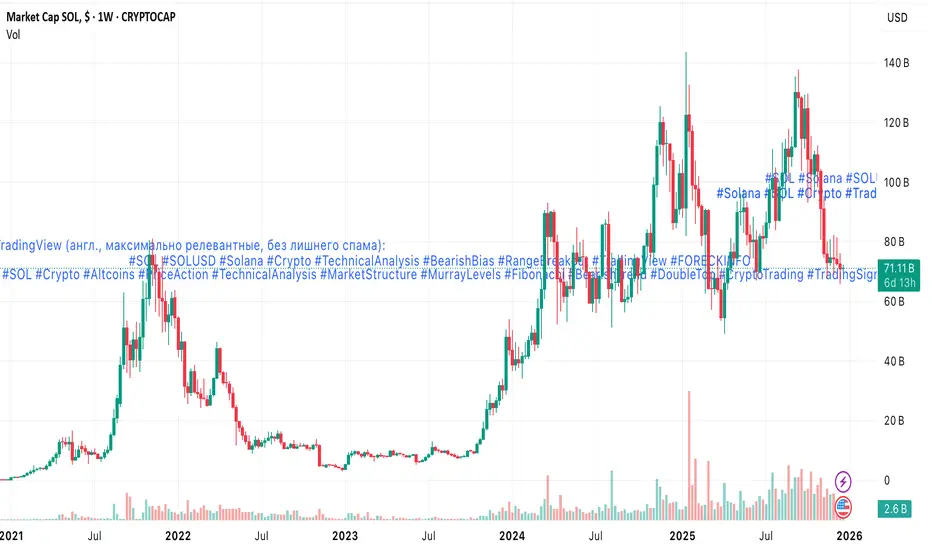
SOL/USD remains inside a medium-term descending channel, while price action since mid-last month has compressed into a sideways range between 125.00 and 150.00 (Murray [2/8]–[4/8]).
Price is currently pressing below the lower boundary of the range, increasing the probability of a downside continuation.
Failure to reclaim 125.00 would confirm a range breakdown and open the way toward 100.00 and 75.00.
A bullish reversal requires a confirmed breakout above 150.00, supported by volatility expansion.
⸻
Higher-Timeframe Context
On the weekly chart, SOL continues to show characteristics of a potential double-top formation, reinforcing downside risk toward at least 93.75 (Murray [3/8], W1) if support fails.
⸻
Indicator Snapshot
• Bollinger Bands: Flat → consolidation phase
• Stochastic: Sideways → lack of momentum
• MACD: Stable below zero → bearish bias intact
Momentum remains weak; range resolution is likely.
⸻
Key Levels
Resistance:
• 150.00
• 187.50
• 200.00
Support:
• 125.00
• 100.00
• 75.00
⸻
Trading Scenarios
Primary scenario — bearish continuation:
• SELL STOP: 121.00
• Targets: 100.00 → 75.00
• Stop-loss: 139.00
• Horizon: 5–7 days
Alternative scenario — bullish breakout:
• BUY STOP: 151.00
• Targets: 187.50 → 200.00
• Stop-loss: 130.00
⸻
Conclusion
As long as SOL/USD trades below 125.00–150.00, the structure favors sellers.
A confirmed breakdown below 125.00 would likely accelerate losses toward 100.00 and 75.00, while only a clean breakout above 150.00 would signal a trend reversal.
Price is currently pressing below the lower boundary of the range, increasing the probability of a downside continuation.
Failure to reclaim 125.00 would confirm a range breakdown and open the way toward 100.00 and 75.00.
A bullish reversal requires a confirmed breakout above 150.00, supported by volatility expansion.
⸻
Higher-Timeframe Context
On the weekly chart, SOL continues to show characteristics of a potential double-top formation, reinforcing downside risk toward at least 93.75 (Murray [3/8], W1) if support fails.
⸻
Indicator Snapshot
• Bollinger Bands: Flat → consolidation phase
• Stochastic: Sideways → lack of momentum
• MACD: Stable below zero → bearish bias intact
Momentum remains weak; range resolution is likely.
⸻
Key Levels
Resistance:
• 150.00
• 187.50
• 200.00
Support:
• 125.00
• 100.00
• 75.00
⸻
Trading Scenarios
Primary scenario — bearish continuation:
• SELL STOP: 121.00
• Targets: 100.00 → 75.00
• Stop-loss: 139.00
• Horizon: 5–7 days
Alternative scenario — bullish breakout:
• BUY STOP: 151.00
• Targets: 187.50 → 200.00
• Stop-loss: 130.00
⸻
Conclusion
As long as SOL/USD trades below 125.00–150.00, the structure favors sellers.
A confirmed breakdown below 125.00 would likely accelerate losses toward 100.00 and 75.00, while only a clean breakout above 150.00 would signal a trend reversal.

כתב ויתור
המידע והפרסומים אינם מיועדים להיות, ואינם מהווים, ייעוץ או המלצה פיננסית, השקעתית, מסחרית או מכל סוג אחר המסופקת או מאושרת על ידי TradingView. קרא עוד ב־תנאי השימוש.
כתב ויתור
המידע והפרסומים אינם מיועדים להיות, ואינם מהווים, ייעוץ או המלצה פיננסית, השקעתית, מסחרית או מכל סוג אחר המסופקת או מאושרת על ידי TradingView. קרא עוד ב־תנאי השימוש.