Crypto Volume Shift: Solana Reports 12.6x More ActivitySolana recently reported that its on-chain trading volume is 12.6 times greater than that of traditional stock exchanges, a significant metric in the evolving landscape of digital assets. This tweet, shared by the Solana account, showcases the growing interest in blockchain technology as a primary t
Market Cap SOL, $
No trades
No trades
Key data points
Previous close
—
Open
—
Day's range
–
Crypto info
Coin
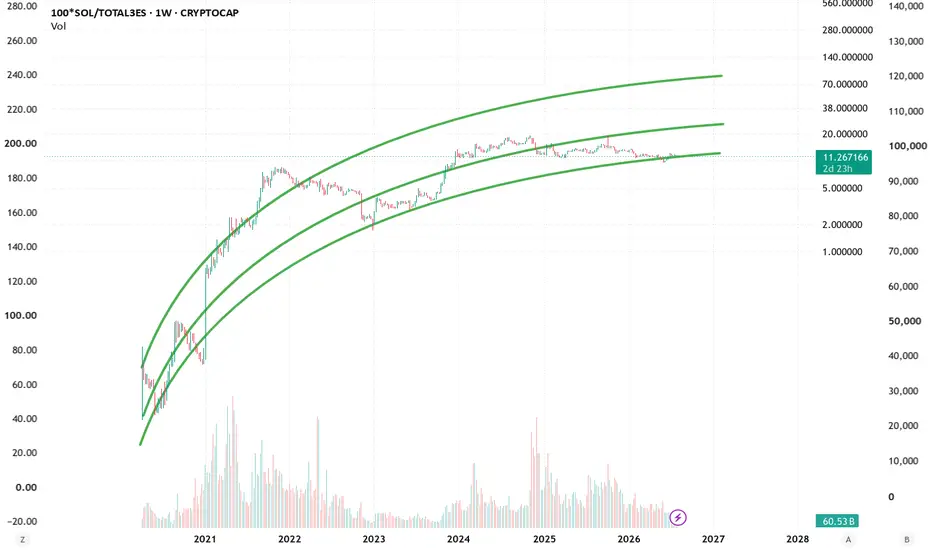
Solana is a protocol praised a lot for its performance and speed — all for the sake of facilitating decentralized apps. The protocol is even doted on for its Proof-of-history consensus that improves scalability and, consequently, usability. Some bold fans even say Solana is a future rival of Ethereum. How true this is, we can't know, but we can try to evaluate how well the network is doing at the moment by watching market cap of its native token, SOL — we've calculated it and displayed on the chart so that you can stay informed and prepared in any market scenario.
SOL (Solana Market Cap): Rejection From High & Bearish Pullback SOL (Solana Market Cap): Rejection From High & Bearish Pullback 📉
Solana Market Cap (SOL) is rejecting near the recent local high around 64.5B on the 1H chart, setting up for a potential pullback down towards key support zones.
Trade Plan:
• Entry: Market Price / Below 62.82B
• Stop Loss: 66.00B
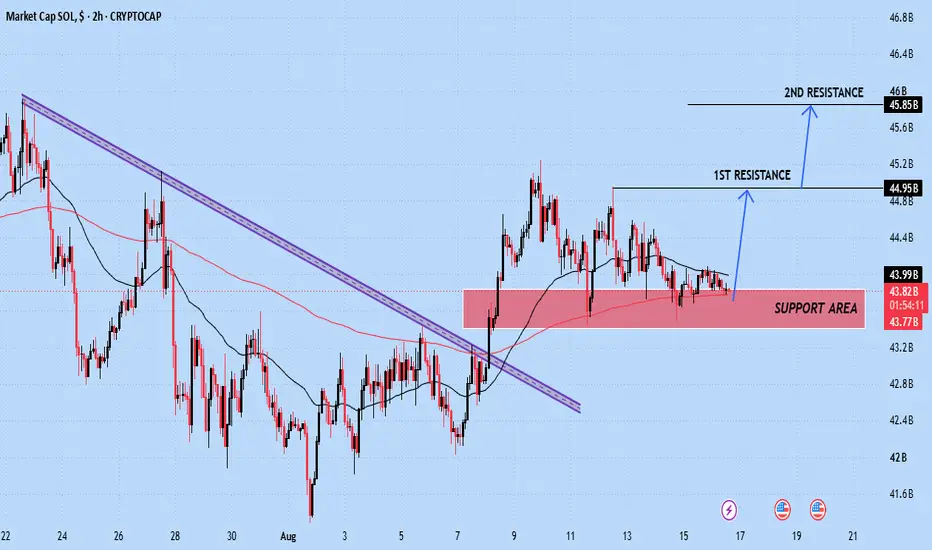
SOL Market Cap Bullish Support Hold & Upside ContinuationSOL Market Cap (CRYPTOCAP:SOL): Bullish Support Hold & Upside Continuation 🚀
Solana market cap is holding firmly above the key Support Area (43.0B - 43.6B) on the 2H chart following a successful break above the descending resistance channel, indicating upside momentum towards resistance targets.
T
Solana Eyes $93 Rally: Why Current Consolidation Next Signals Solana (SOL) is at a critical point that could signal a buying opportunity, with a potential rise to $93.
As seen in the 4-hour chart below, SOL continues to consolidate in a rising channel, with the lower boundary set at $76. Maintaining prices above this level would signal a buying opportunity, w
Solana Price Prediction Amid Crypto Bullish OutlookSolana (SOL) is poised to reclaim its $250 all-time high, according to one long-term analysis of the 3-day SOL/USDT higher-timeframe chart.
Solana chart forecasts strong upside momentum to $250
As seen in the chart below, Solana appears to be carving out a robust, long-term accumulation pattern tha
Solana Dominates Tokenized Equities — $116 Million in Volume RecRecent data reveals that Solana recorded an impressive $116 million in tokenized equities volume yesterday. This volume represents an astounding 94% of the total across all blockchains, as reported by Cointelegraph. The surge in trading activity underlines Solana’s growing position in the market.
T
Why Solana Could Be Heading Toward A Major Breakdown?Solana is facing one of its most important technical moments in recent months. The cryptocurrency recently broke below a major weekly support level, raising concerns across the market. Traders and analysts now believe the asset could be entering a phase of accelerated downside risk. As bearish momen
Why Is SpaceX PreStocks Trading Exploding On Solana?Interest around SpaceX continues to dominate both traditional finance and crypto markets. Traders now rush toward blockchain-based exposure as rumors around a potential public listing gain momentum. The latest numbers show massive activity on Solana-powered PreStocks markets, where investors specula
Solana’s Insane Week: SoFi, AI Agents, 10B Transactions Explode!The Solana ecosystem is gaining strong traction ahead of the Accelerate USA event. Instead of gradual progress, the network has moved rapidly with major developments, signaling rising adoption and momentum. This shift highlights how Solana is positioning itself as a leading high-performance blockcha
See all ideas
Summarizing what the indicators are suggesting.
Oscillators
Neutral
SellBuy
Strong sellStrong buy
Strong sellSellNeutralBuyStrong buy
Oscillators
Neutral
SellBuy
Strong sellStrong buy
Strong sellSellNeutralBuyStrong buy
Summary
Neutral
SellBuy
Strong sellStrong buy
Strong sellSellNeutralBuyStrong buy
Summary
Neutral
SellBuy
Strong sellStrong buy
Strong sellSellNeutralBuyStrong buy
Summary
Neutral
SellBuy
Strong sellStrong buy
Strong sellSellNeutralBuyStrong buy
Moving Averages
Neutral
SellBuy
Strong sellStrong buy
Strong sellSellNeutralBuyStrong buy
Moving Averages
Neutral
SellBuy
Strong sellStrong buy
Strong sellSellNeutralBuyStrong buy
Displays a symbol's value movements over previous years to identify recurring trends.
Frequently asked questions
Today, SOL market cap is 63.90 B USD.
Track all crypto prices and get even more market insights with our crypto market cap charts.
Market cap helps you understand Solana's scale relative to other cryptocurrencies, assess its market dominance, and gauge overall sentiment. A rising market cap can signal increasing adoption and investor confidence.
Market cap can also support investment decisions:
- Risk-averse investors often favor large-cap assets like Bitcoin and Ether for long-term holdings or lower-volatility trading
- Investors seeking higher potential returns may explore smaller-cap altcoins, while accepting the higher associated risk
Market cap can also support investment decisions:
- Risk-averse investors often favor large-cap assets like Bitcoin and Ether for long-term holdings or lower-volatility trading
- Investors seeking higher potential returns may explore smaller-cap altcoins, while accepting the higher associated risk
SOL market cap is updated in real time on our Supercharts.
To see the broader market picture, explore our crypto market cap charts.
SOL market cap is a helpful indicator, but it's not enough to build a reliable strategy on crypto markets.
Here are some other factors that should constitute your trading decision:
- Price trends: Explore how the price moves on Supercharts, and watch seasonal trends right on TradingView
- On-chain metrics: You can find them on individual symbol pages or in the Crypto Coins Screener
- Macroeconomic context: Watch global news and Macro Maps to stay on top of what's moving the world's finances
Here are some other factors that should constitute your trading decision:
- Price trends: Explore how the price moves on Supercharts, and watch seasonal trends right on TradingView
- On-chain metrics: You can find them on individual symbol pages or in the Crypto Coins Screener
- Macroeconomic context: Watch global news and Macro Maps to stay on top of what's moving the world's finances
Solana dominance is 2.35%, meaning SOL market cap takes up 2.35% of the total crypto market cap.
Compare cryptocurrencies by their dominance on the crypto dominance chart. For a broader view, explore the Crypto Heatmap.
Solana market cap is the total value of all coins currently in circulation. It doesn't include burned, locked, or not-yet-mined coins or tokens.
Market cap = current SOL price × circulating supply
In the Crypto Heatmap, you can view the performance of the crypto market, grouped by market cap.
Market cap = current SOL price × circulating supply
In the Crypto Heatmap, you can view the performance of the crypto market, grouped by market cap.
Since only the circulating supply is used to calculate Solana market cap, changes in price have the greatest impact on its value.
As a result, anything that influences price — including news, macroeconomic trends, regulatory updates, ETF flows, institutional adoption, and investor sentiment — can also affect the SOL market cap.
Market cap is calculated using the current circulating supply. Fully diluted market cap uses the maximum possible supply (for example, 21 million for BTC), including coins or tokens that are locked or not yet released.
Fully diluted market cap = total supply × current price per SOL
Market cap reflects Solana's current value, while fully diluted market cap shows what it could be worth if all coins were already mined — offering a view of its potential future valuation.
To find coins that align with your strategy, you can apply these and other crypto metrics in the Crypto Coins Screener.
Fully diluted market cap = total supply × current price per SOL
Market cap reflects Solana's current value, while fully diluted market cap shows what it could be worth if all coins were already mined — offering a view of its potential future valuation.
To find coins that align with your strategy, you can apply these and other crypto metrics in the Crypto Coins Screener.
Circulating supply is the number of coins or tokens that are currently available to the public and can be freely traded on the market. It excludes coins that are locked, burned, or not yet mined. This value can change over time as more tokens enter or leave circulation.
Circulating supply is used to calculate a coin's market cap. It differs from total supply, which reflects the total number of coins or tokens associated with an asset, including those that are locked or burned.
Compare cryptocurrencies in our Crypto Coins Screener and find more insights on the crypto market cap charts.
Circulating supply is used to calculate a coin's market cap. It differs from total supply, which reflects the total number of coins or tokens associated with an asset, including those that are locked or burned.
Compare cryptocurrencies in our Crypto Coins Screener and find more insights on the crypto market cap charts.
Today, the total market cap of the crypto market is 2.72 T USD. Explore it in detail to get more insights.