Macro Maps: explore global economy
Understanding global trends and the current market state is the foundation of financial analysis. Whatever asset you trade, knowledge of key economic indicators can help you enhance your trading strategy. With TradingView Macro Maps, you can easily visualize global trends and navigate the complex, ever-changing financial landscape more effectively.
CONTENTS:
What are Macro Maps
Macro Maps visualize global economic indicators by color-coding countries on an interactive world map according to their economic performance. With this tool, you can evaluate and compare national economies using a wide variety of key indicators, including:
- GDP: Track output and overall economic growth.
- Labor statistics: Monitor unemployment rates, employment changes, and labor metrics.
- Price levels and inflation: Analyze Consumer Price Index (CPI), inflation rates, and purchasing power.
- Other macroeconomic data: Compare central bank rates, government debt, trade balances, and more.
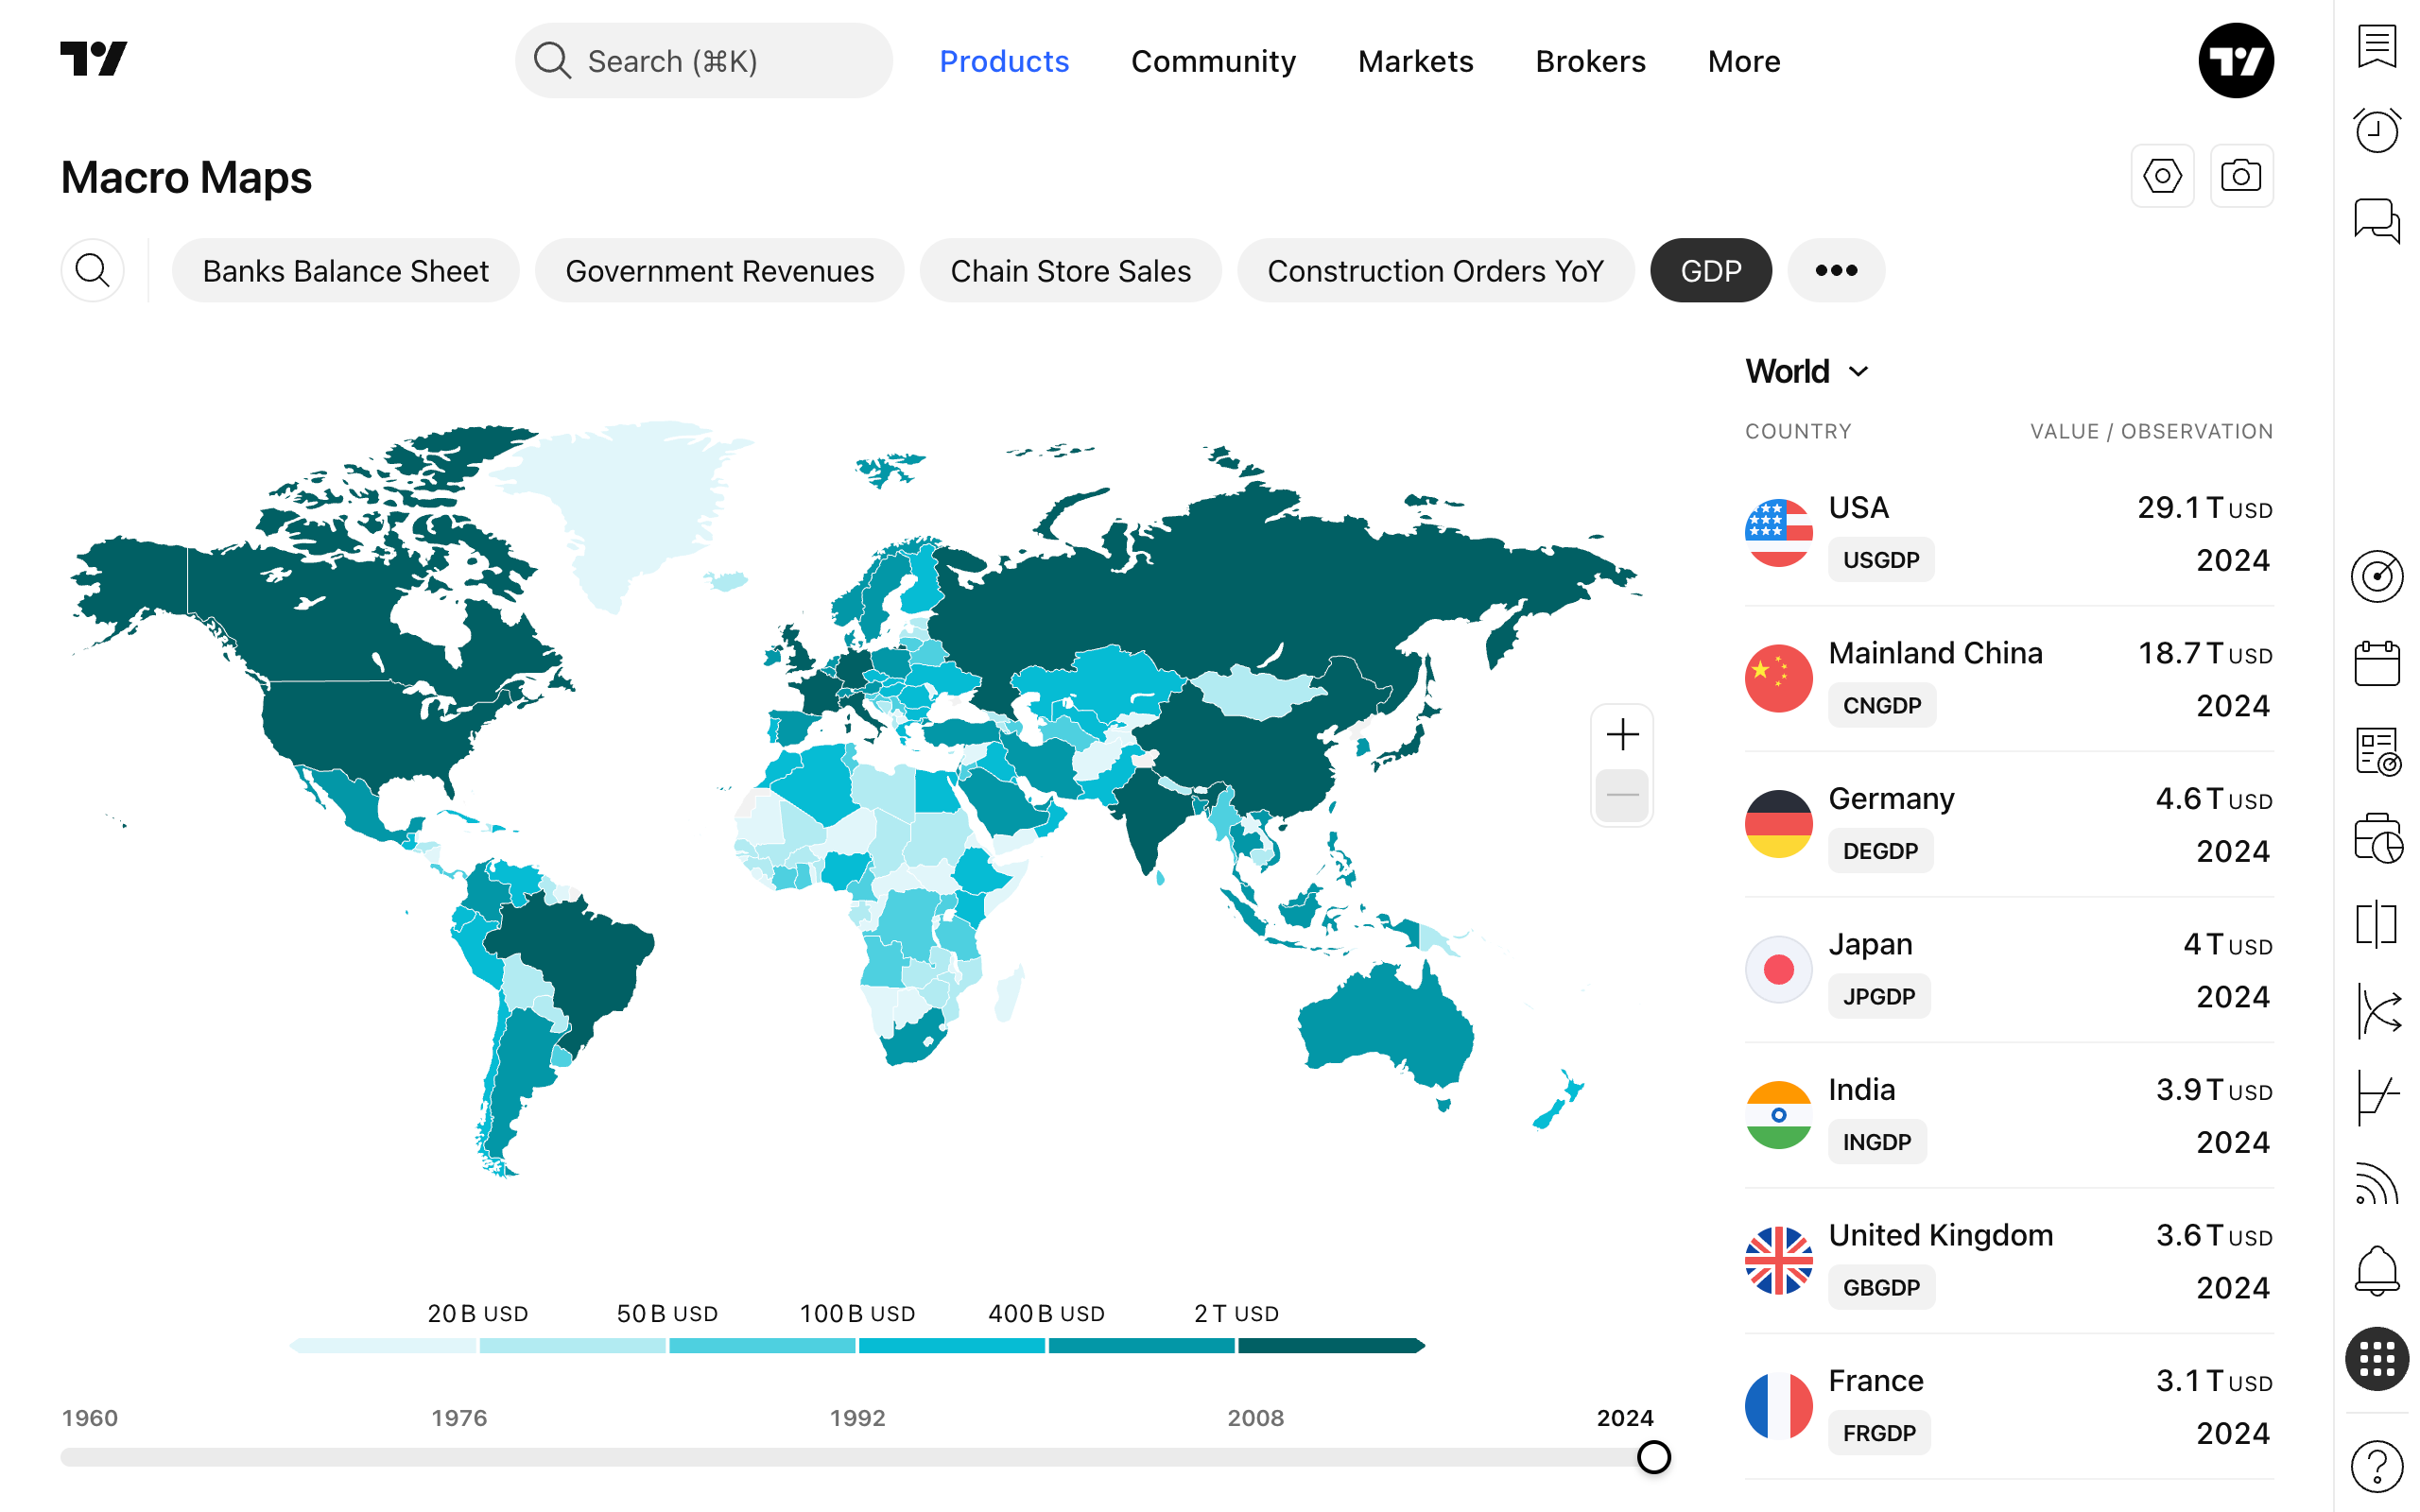
Additionally, Macro Maps allow you to adjust the historical timeframe with precision down to a single month, making it simple to conduct detailed historical analyses and identify long-term macroeconomic trends.
How to access Macro Maps
You can open Macro Maps in two quick ways:
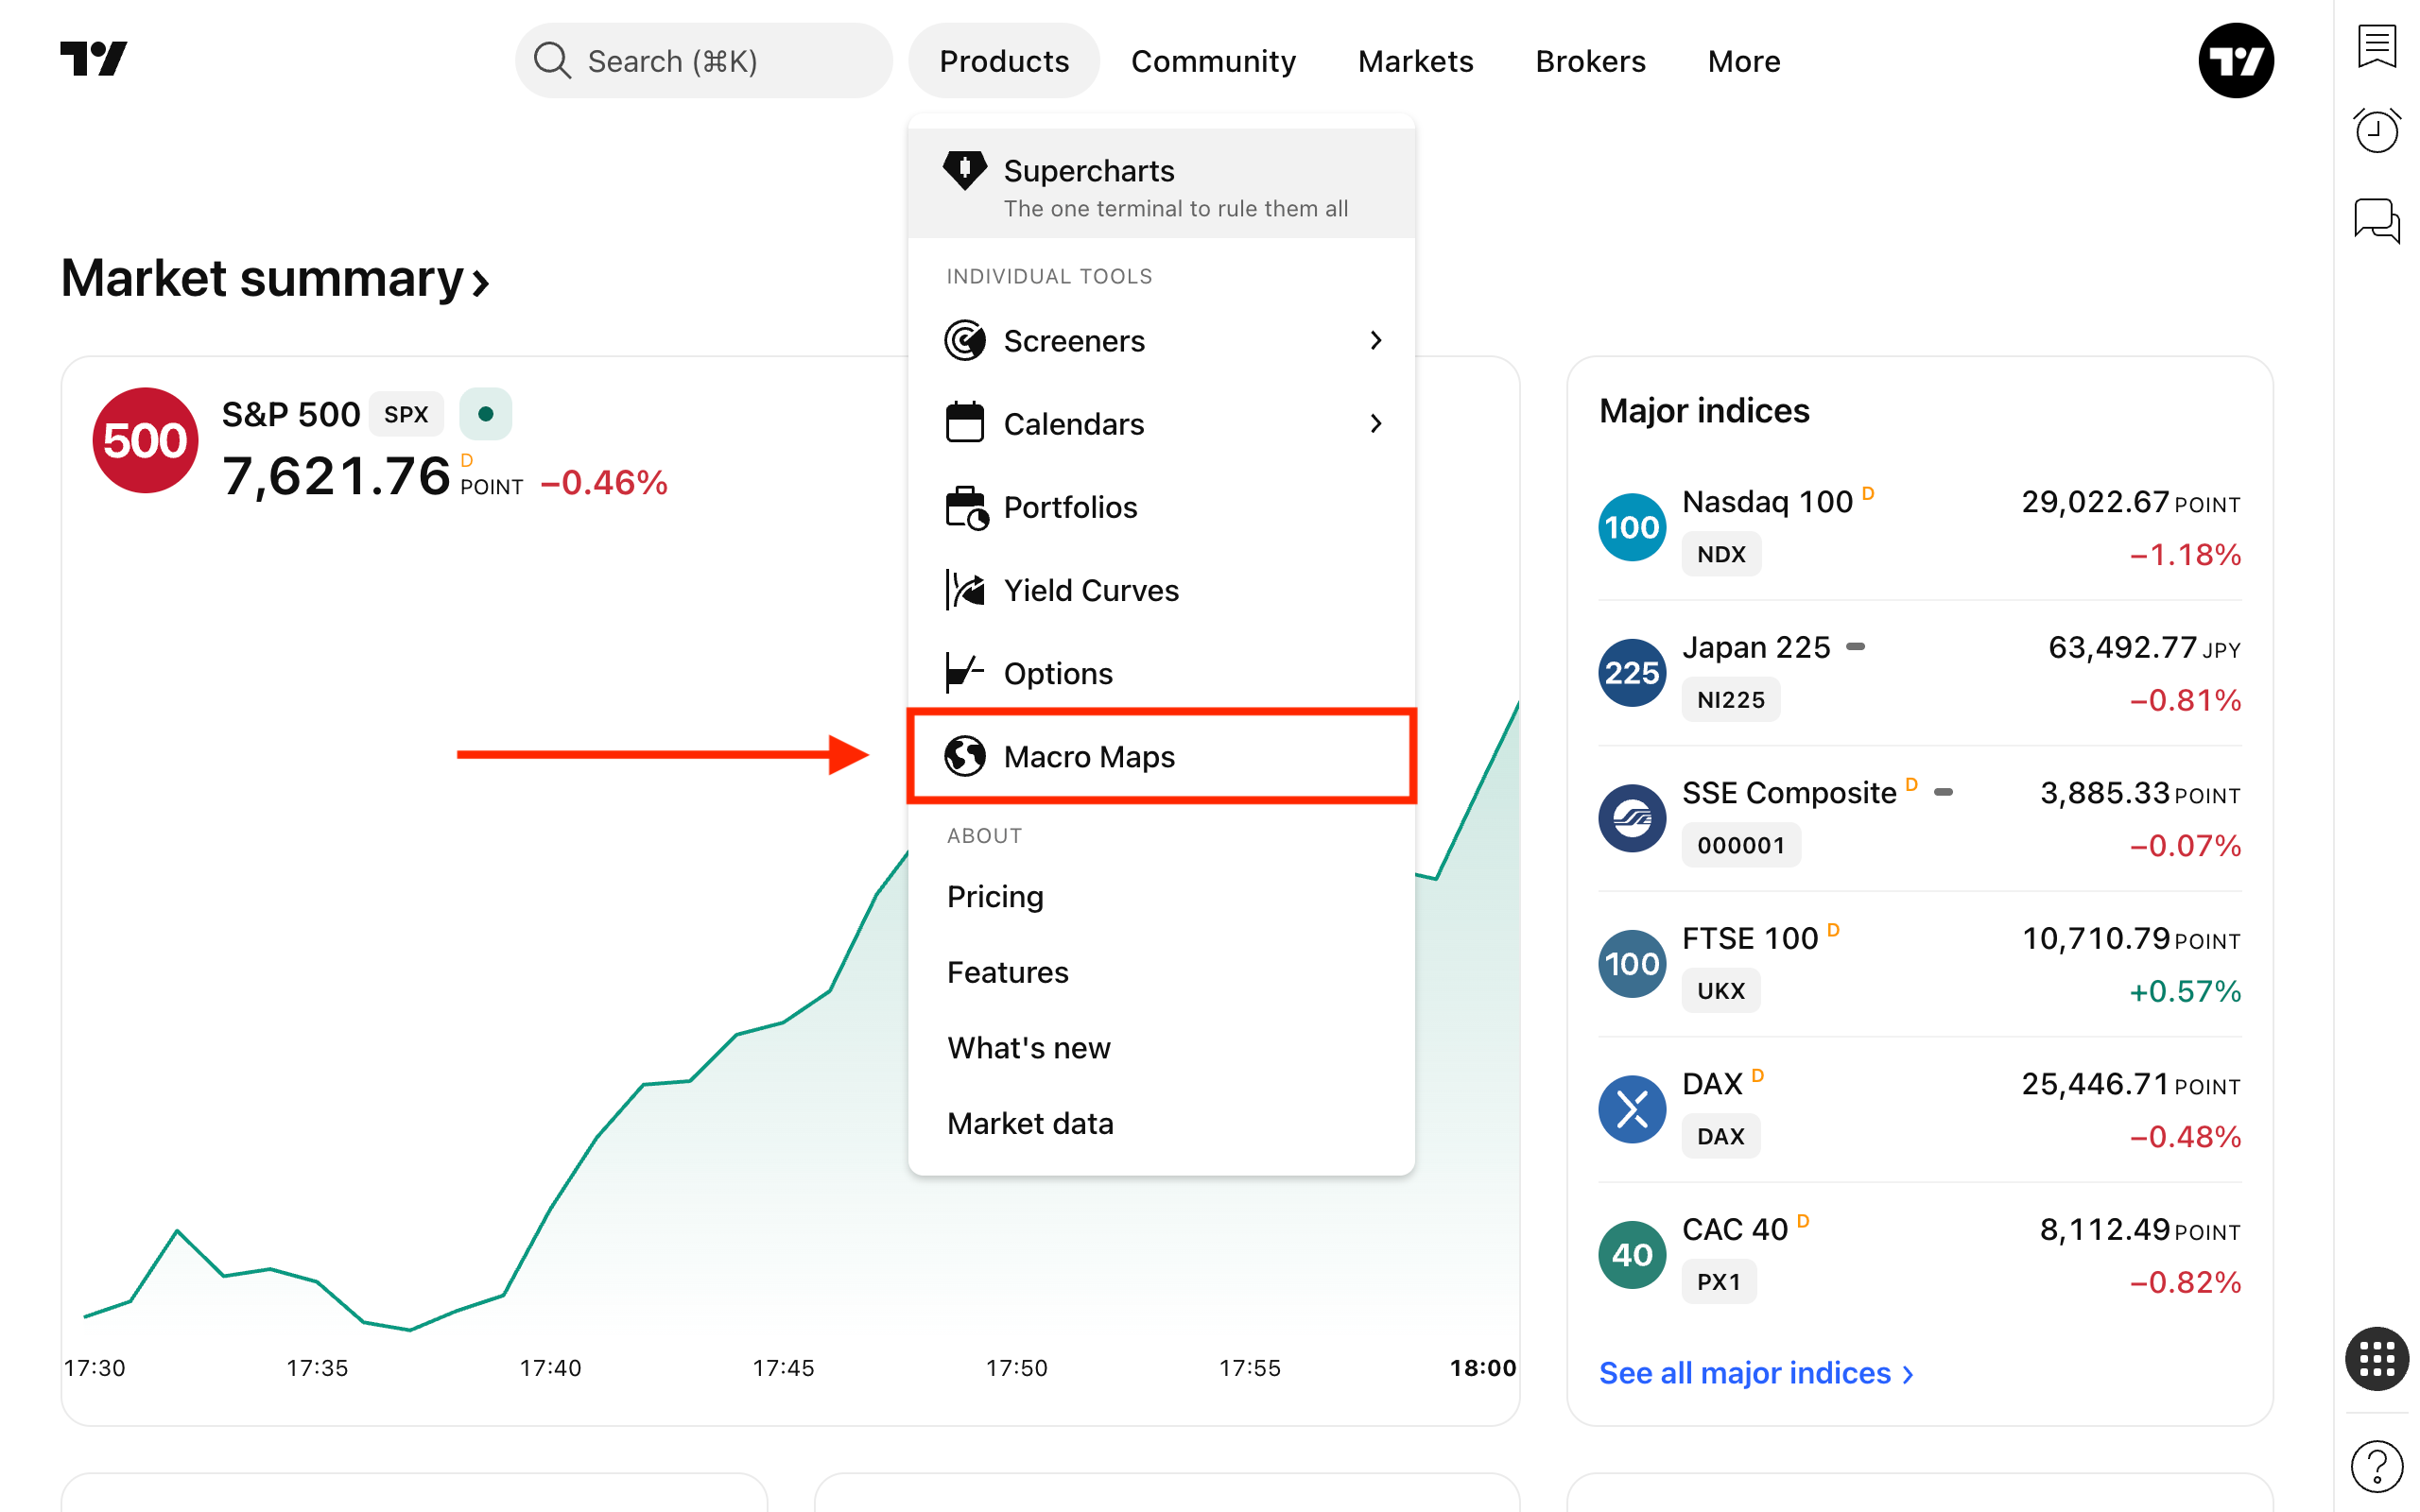
From the main page: Open the Products dropdown menu and select Macro Maps.
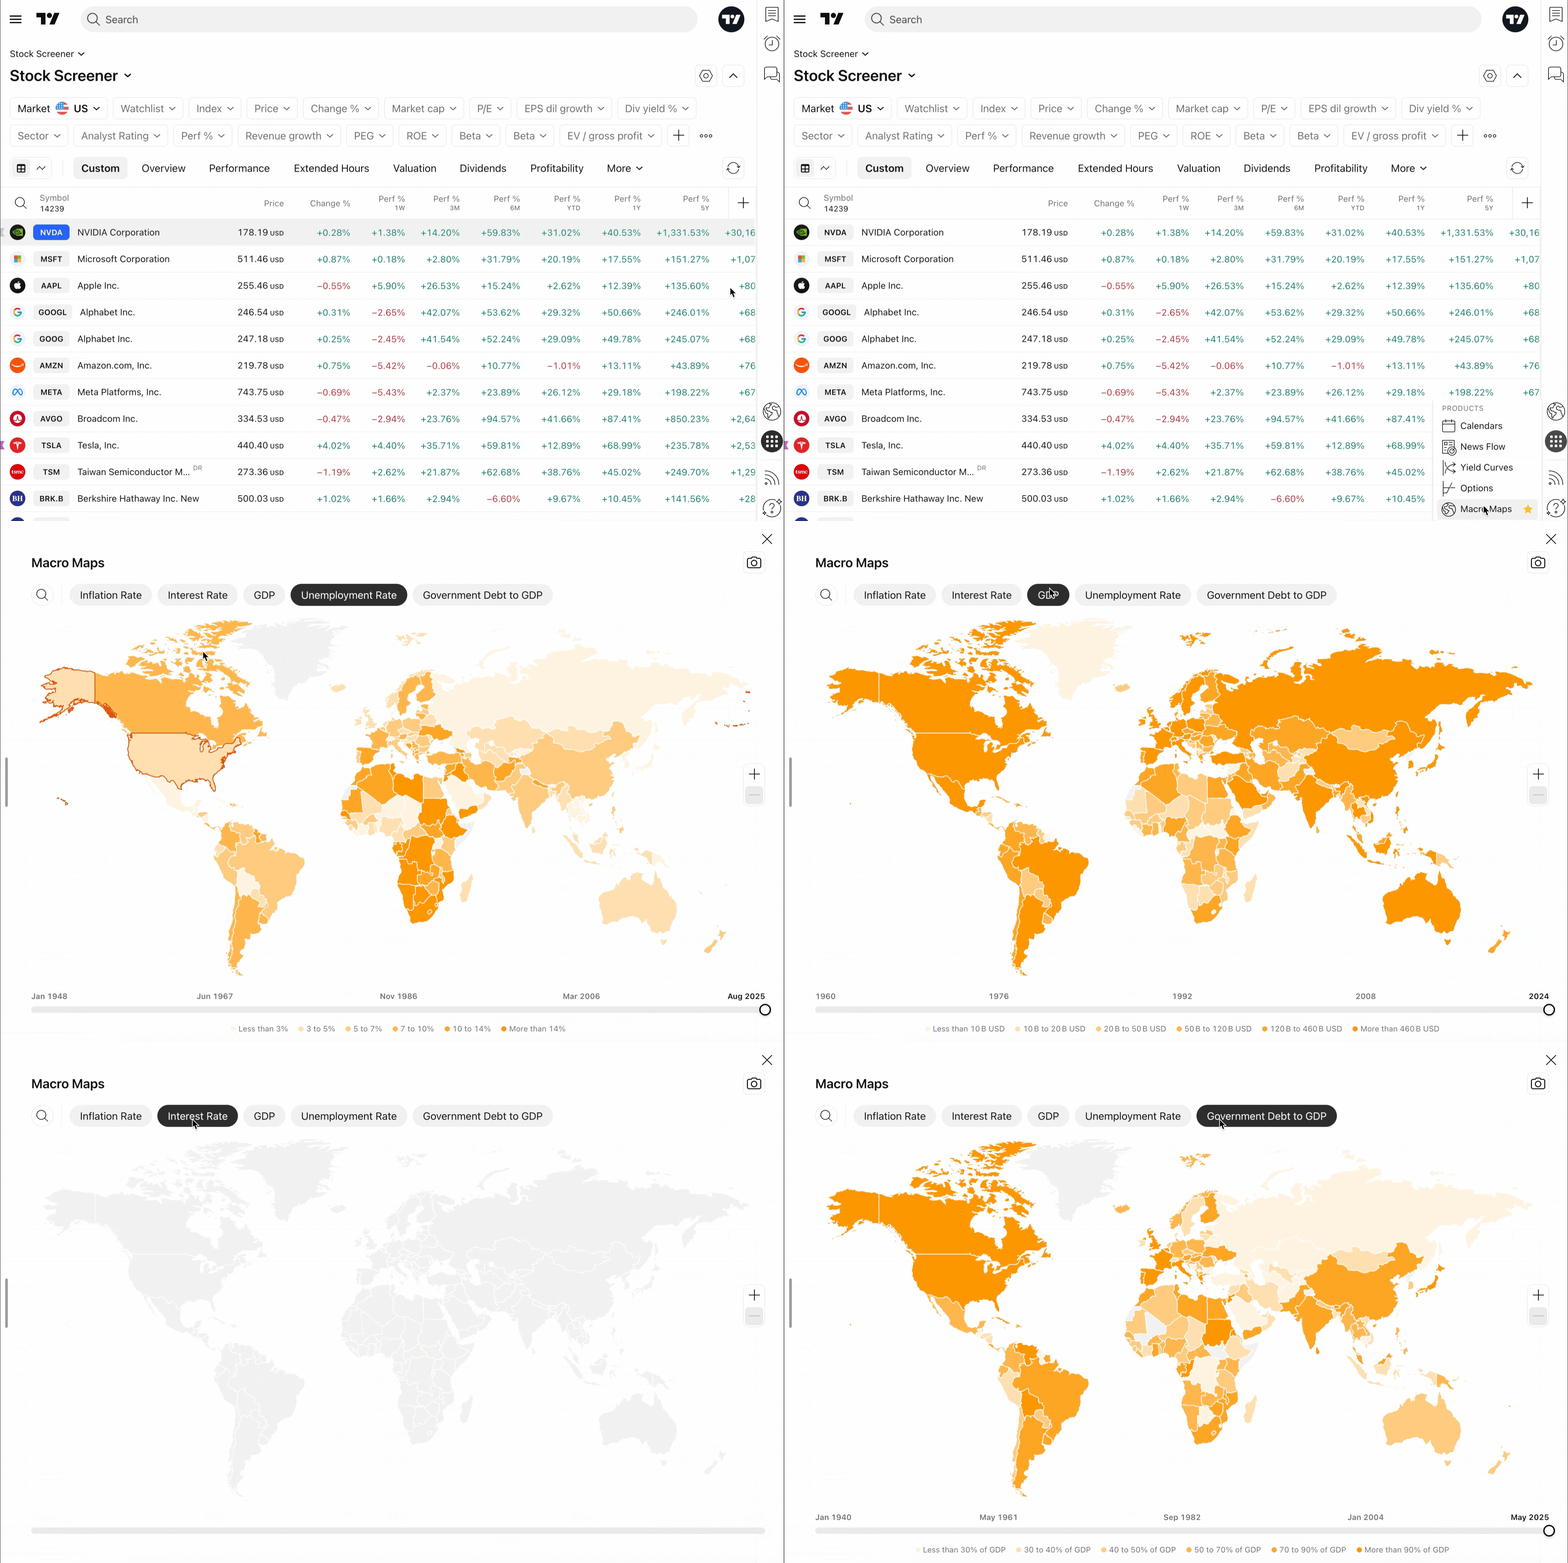
From Supercharts: Click the Products button on the right-hand toolbar to open Macro Maps inside the overlay sheet.
How to use Macro Maps
Broad economic conditions affect individual economies, and no country exists in isolation — understanding these global interconnections is crucial for successful trading.
Steps to analyze data with Macro Maps:
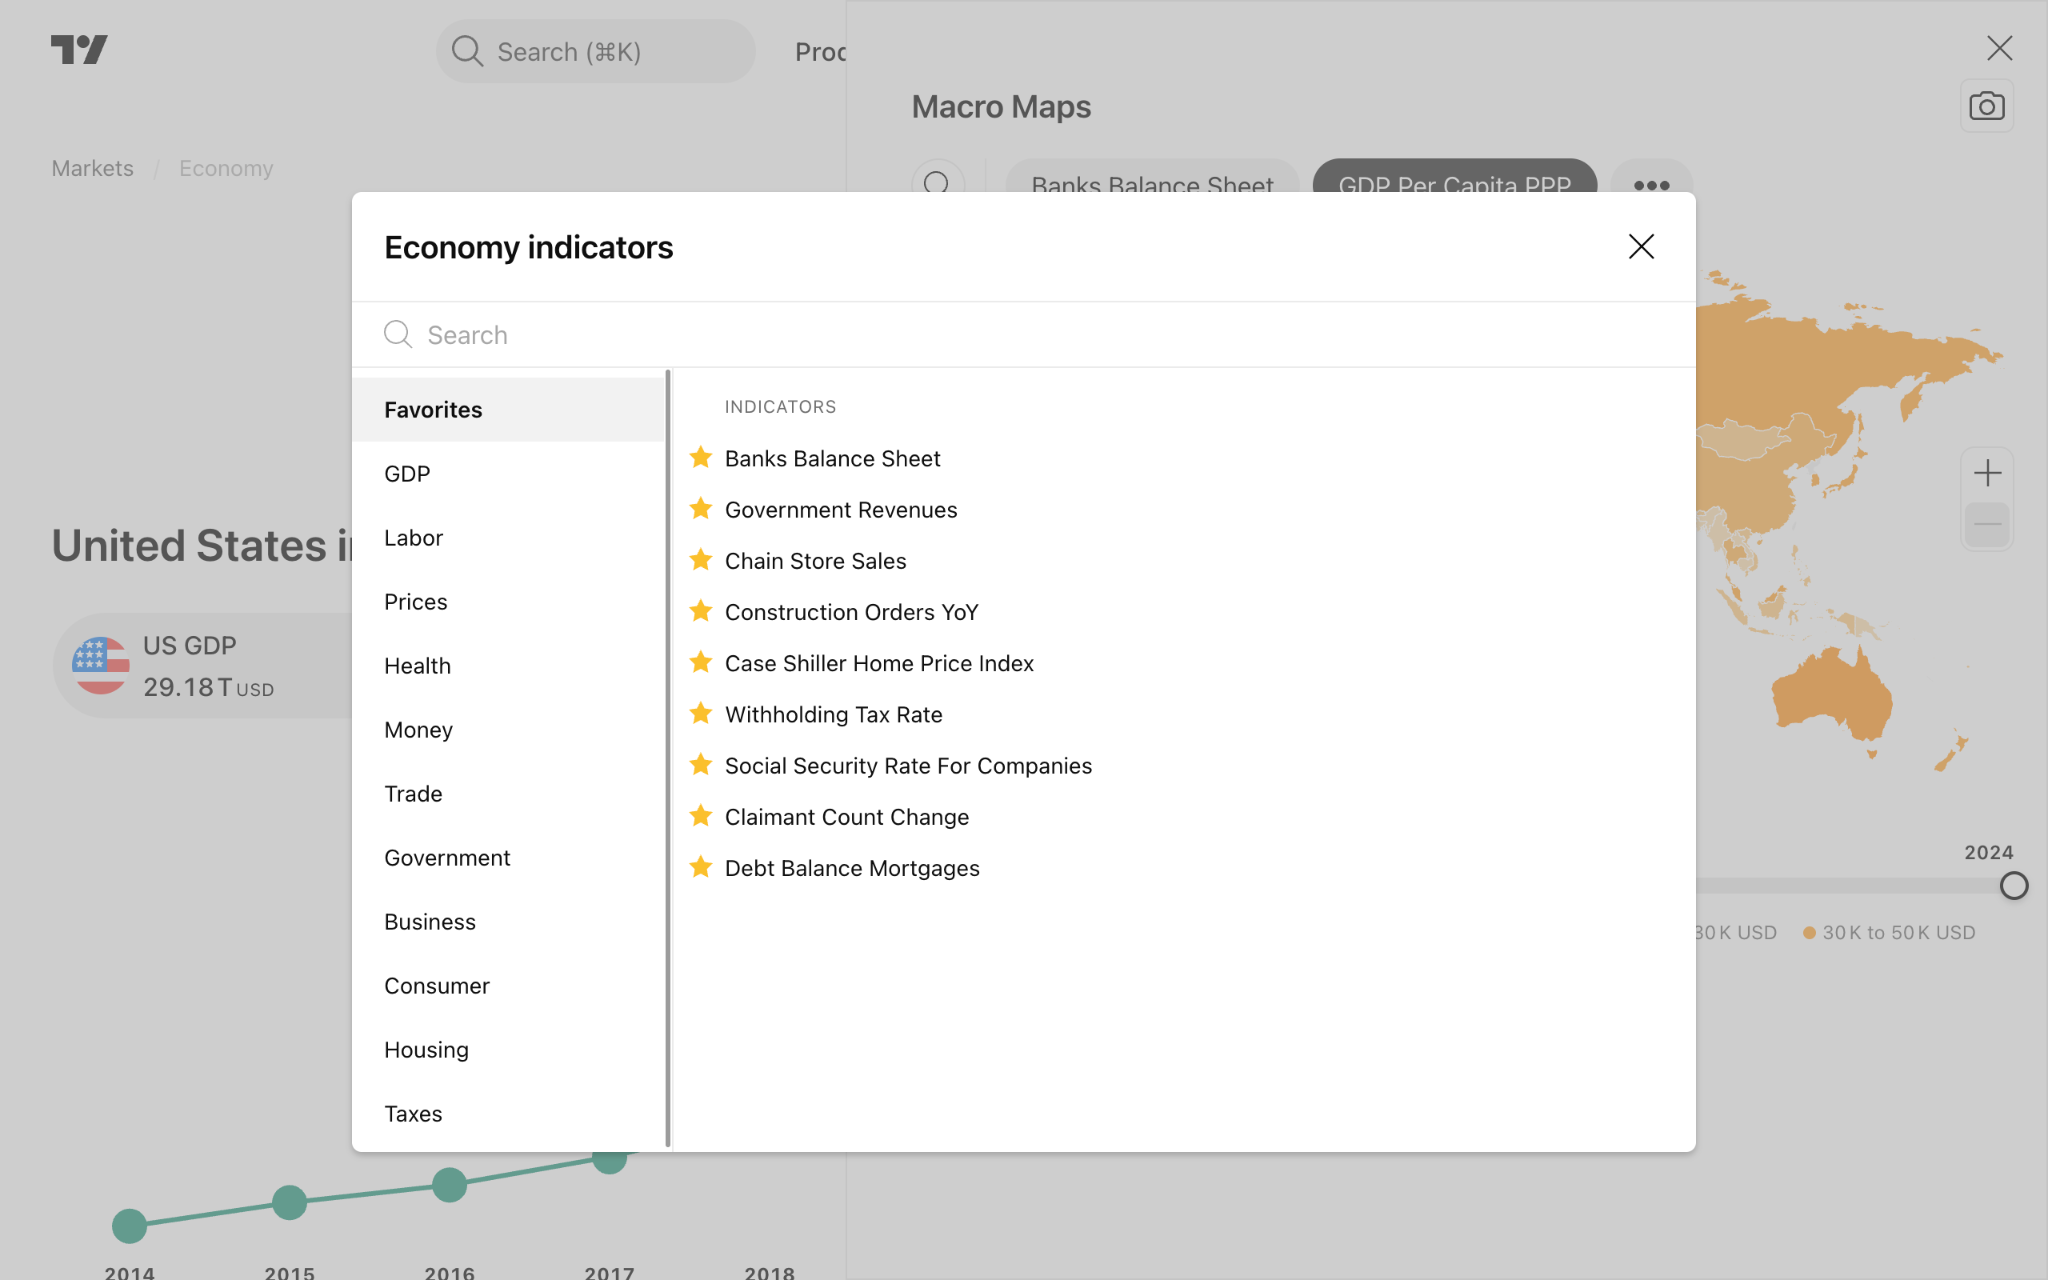
- Select indicators: Click the magnifying glass icon in the top-left corner to search and access all available indicators, or choose directly from those displayed at the top of the map interface.
- Mark favorites: Star your most frequently used indicators as favorites to quickly switch between them and tailor the maps to your specific strategy.
- Adjust the timeline: Drag the time scrubber at the bottom of the screen to change the data period. The color-coding criteria legend below the scrubber will automatically adjust to reflect the numerical values of your chosen timeframe.
Oh, and one more global economy thing…
If you need even more diverse data on the global economy, TradingView market pages provide access to economic indicator heatmaps, top community stories, breaking market news, and detailed economic profiles. Utilizing these tools gives you a multi-perspective view of global markets to support well-informed trading decisions.
Also read: