TradingView indicators: simple steps to get started
An indicator is a visual representation of trading and financial statistics — such as price levels, trading volume, and financial ratios. Analyzing changes in these values and their relationships allows you to assess the probability of future price movements and build a robust trading strategy based on historical data. Trend direction, strength, continuation, and potential reversals can all be predicted to some extent with a solid, thoroughly tested setup of different indicators.
CONTENTS:
Types of indicators
Different indicators serve different analytical goals. Based on your overarching approach to the markets, indicators generally fall into two primary categories: technical and fundamental.
Technical indicators
Technical analysis relies purely on market data originating from exchanges — specifically, price and volume. Technical indicators process this raw data using various mathematical formulas and plot the results on your chart as lines, histograms, points, geometric figures, and other visual elements. Additionally, there are indicators calculated based on the output of other indicators, allowing you to see complex relationships in momentum and trend.
There are no universal indicators that work perfectly for all cases and all traders. Finding the right tools takes time. You should explore several, configure their settings, and find the ones that best match your unique trading style.
Trading cautiously and being ready to reconfigure your setup is crucial. We highly recommend exploring Paper Trading to test out different indicators and find your optimal setup in a completely risk-free environment.
Fundamental indicators
Fundamental analysis looks at the real financial health of a company. Instead of focusing on price action, it uses balance sheets, income statements, cash flow data, economic reports, and overall macroeconomic conditions. This approach turns raw corporate data into useful metrics, such as profitability ratios, valuation measures, and growth indicators.
Its strength comes from focusing on actual business performance — helping you assess whether a company is profitable, manages its debt well, or operates in a rapidly growing industry.
Some metrics make the most sense when viewed together. For example, revenue growth is much more meaningful when evaluated alongside profit margins. Different investors prioritize different indicators based on their goals:
- For valuation analysis: You may want to look at Price to book (P/B) or Price to earnings (P/E) ratios.
- For growth investing: You might prioritize earnings momentum and revenue increases.
Learning this takes time, but understanding what drives each metric builds an approach that works in any market. Start with a few key indicators instead of trying to learn everything at once. Understand what they do well, where they fall short, and when they are most useful.
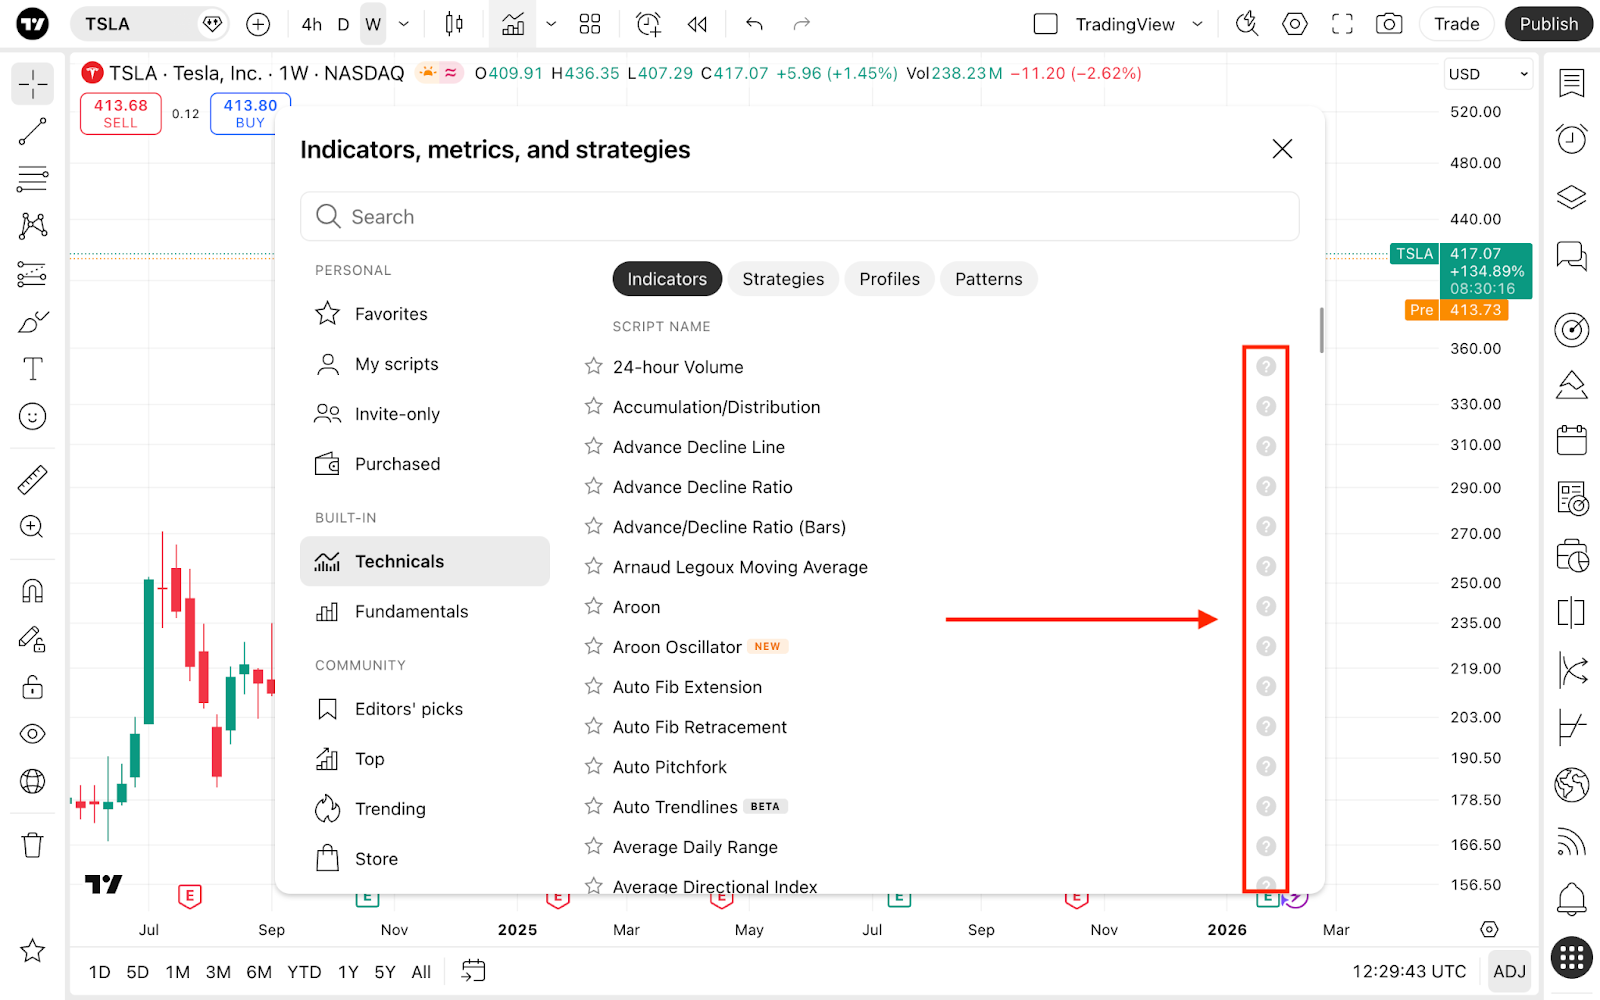
We always suggest using indicators you are highly familiar with. Before applying a new indicator, study it thoroughly. Understanding the underlying calculation principles strengthens your confidence and accelerates your learning. To start your learning path, navigate to the built-in indicators section in the knowledge base, or simply click the ? icon next to the indicator's name on your chart.
Pine Script indicators
The TradingView community has created over 100,000 custom indicators using the power of our Pine Script® programming language, which allows for the integration of both technical and fundamental data.
We provide two primary types of documentation to help you start exploring and integrating Pine into your trading:
- User manual: Detailed documentation describing the language's main features, syntax, and structure, as well as how it interacts with Community Scripts.
- Pine Script reference: A quick-reference guide for all functions, variables, and keywords available in Pine, complete with examples of how to use each.
You can also access open-source indicators written by other TradingViewers and incorporate them into your strategy. These usually come with detailed explanations of calculation mechanics, syntax, and specific use cases.
How to access indicators
On TradingView, you can access indicators across several different products:
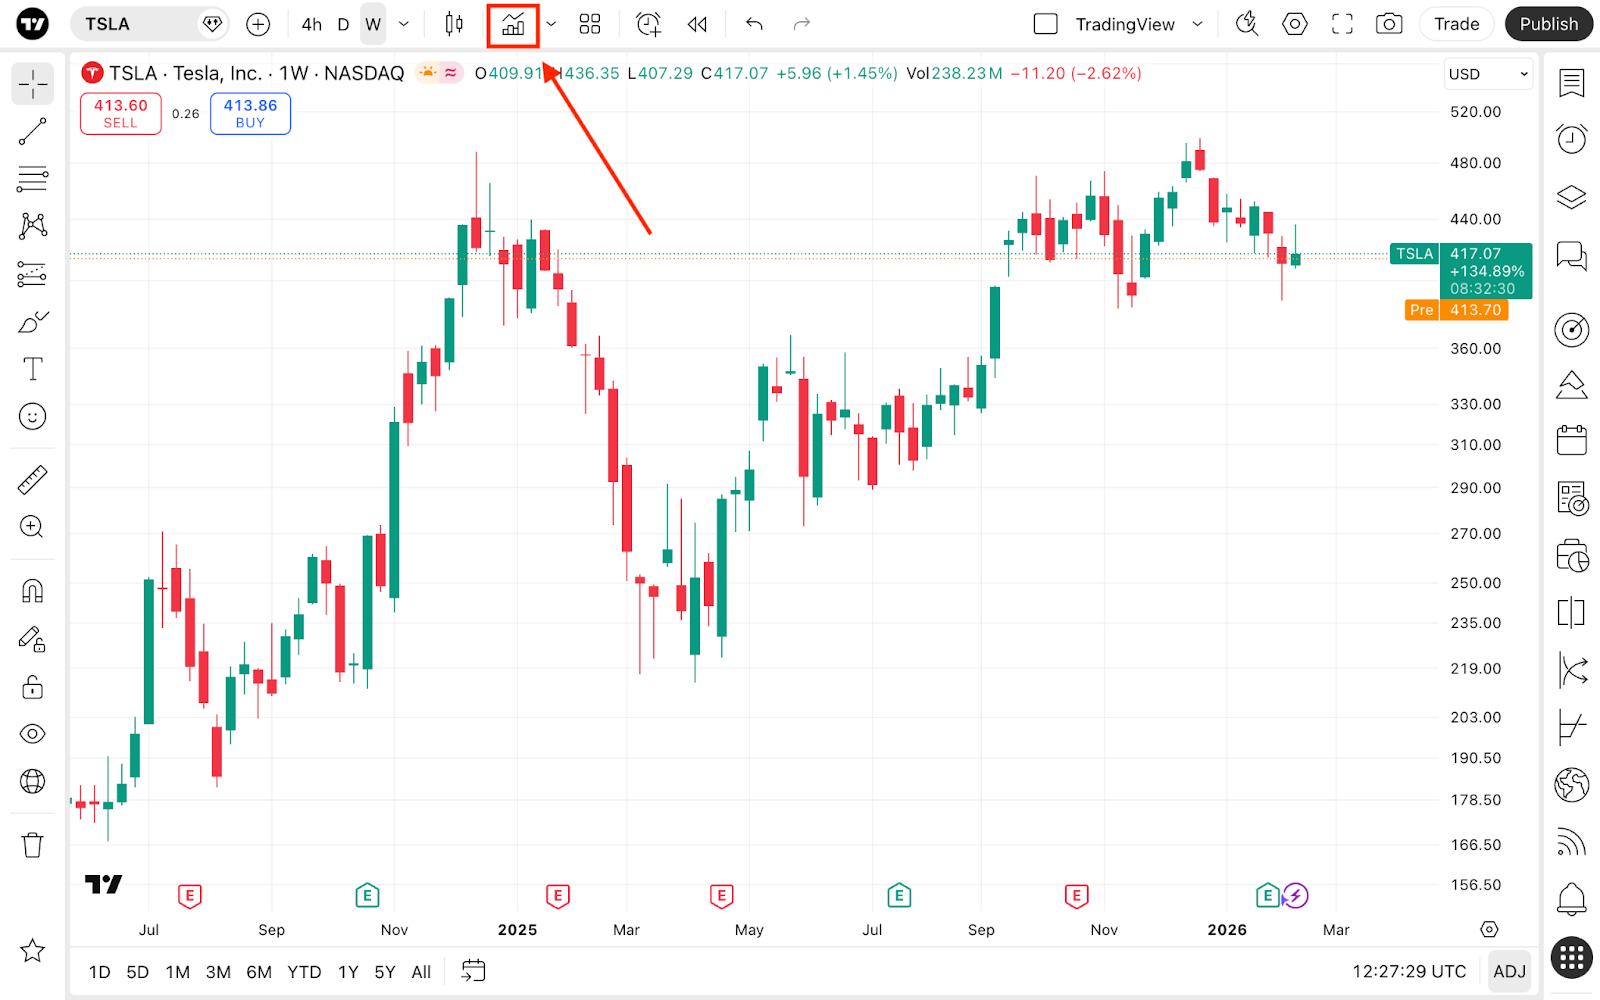
On Supercharts — click the Indicators button on the upper toolbar. From the dialog box, you can navigate through the Technicals, Fundamentals, or Community Scripts tabs.
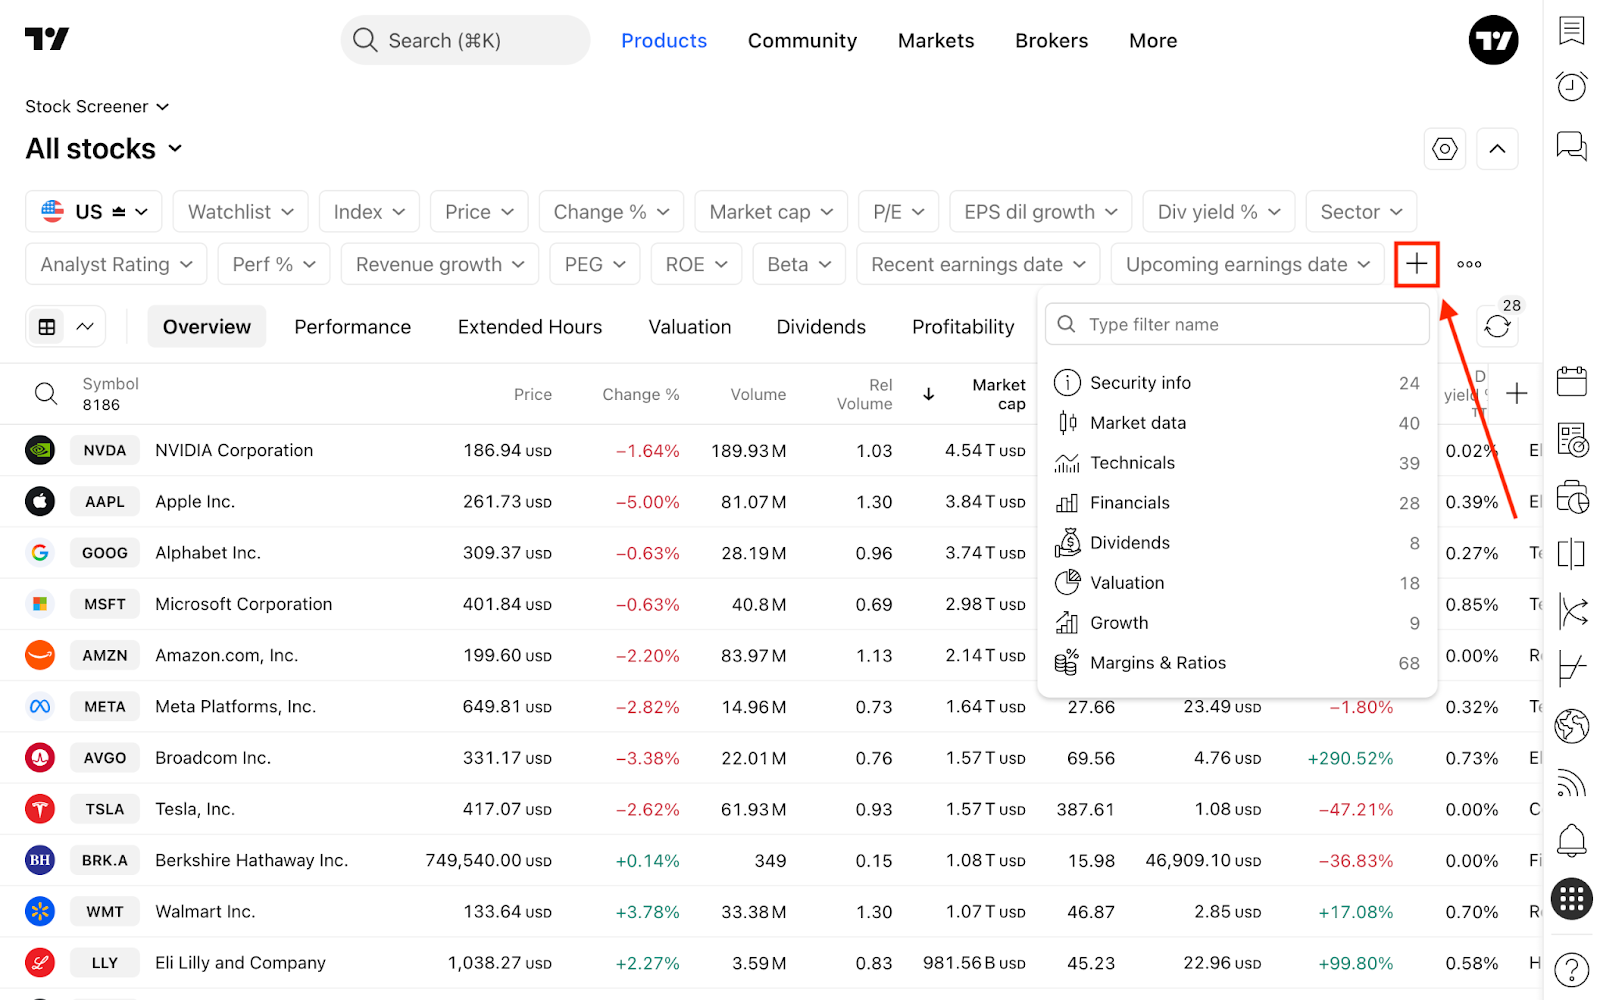
In Screeners — сlick the + icon in the table header and select specific indicators and metrics to filter your assets.
Indicators in a nutshell
On TradingView, you can find various indicators tailored to any goal you are set to achieve. Whether you want to analyze a company's financial performance for a long-term value investment or you are an active day trader looking for sophisticated momentum instruments, the platform has you covered. Furthermore, by leveraging the Pine Script® language, you can create entirely custom indicators based on both technical and fundamental data.
Each indicator can be meticulously configured to align with your trading style and visually customized so you can easily track the data that matters most. Once you study them individually, you can seamlessly combine them with other platform tools to execute a highly effective, data-driven trading strategy.
Also read: