Drawing tools available on TradingView
One of the core features of Supercharts is drawing tools, which allow you to mark trends and patterns, add geometric shapes to highlight important areas, perform measurements and forecasts, calculate price levels, add comments and tables, and even use emojis.
CONTENTS:
What are drawing tools?
Drawing tools are crucial instruments for undertaking complex technical analyses. They can help you thoroughly examine an asset's performance by adding graphical elements and forecasting assets' price moves.
Drawing tools follow a standardized visual style by default. Their appearance can be customized, and they can be positioned alongside the price chart. Together with indicators, they help you personalize your analysis with slightly different approaches.
Drawings are extremely versatile — you can apply them directly over the price action or even within separate indicator panels. For example, you can draw a trendline for both price and RSI to spot divergences.
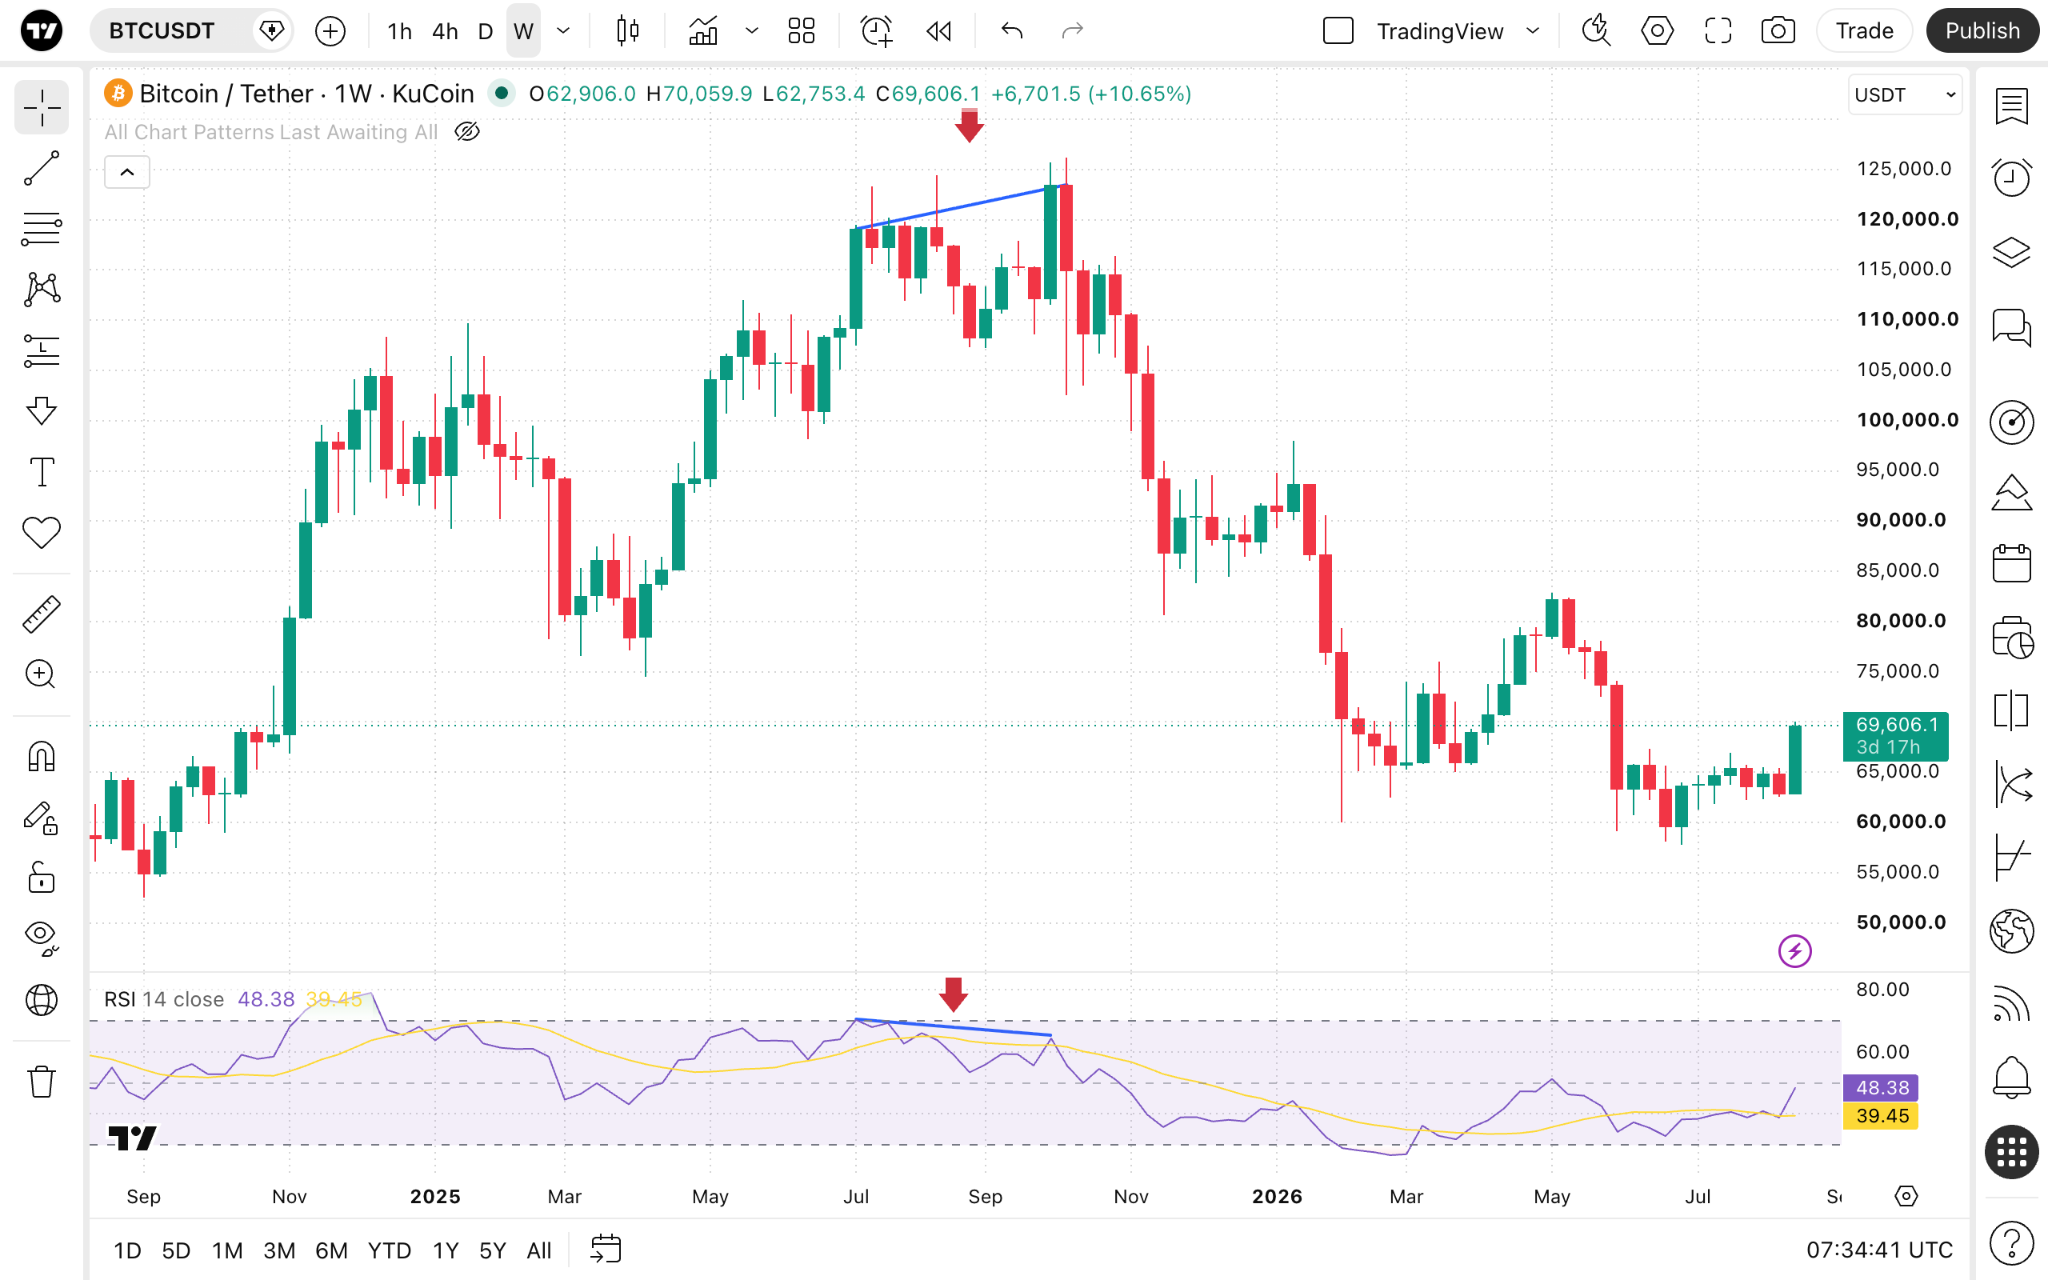
TradingView drawing tools types
Cursors
It all starts with pointing. It's not actually a drawing tool, but it can greatly help you in examining your Supercharts. To better navigate them, choose the cursor type you like:
- Cross: The default cursor.
- Dot: Similar to the cross — choose whichever you like most.
- Arrow: The classic arrow without a crosshair.
- Demonstration: For enhancing your video ideas and live sessions.
- Magic: For adding some wizardly glamour to your analysis.
- Eraser: For fixing anything that isn't just how you want it to be.
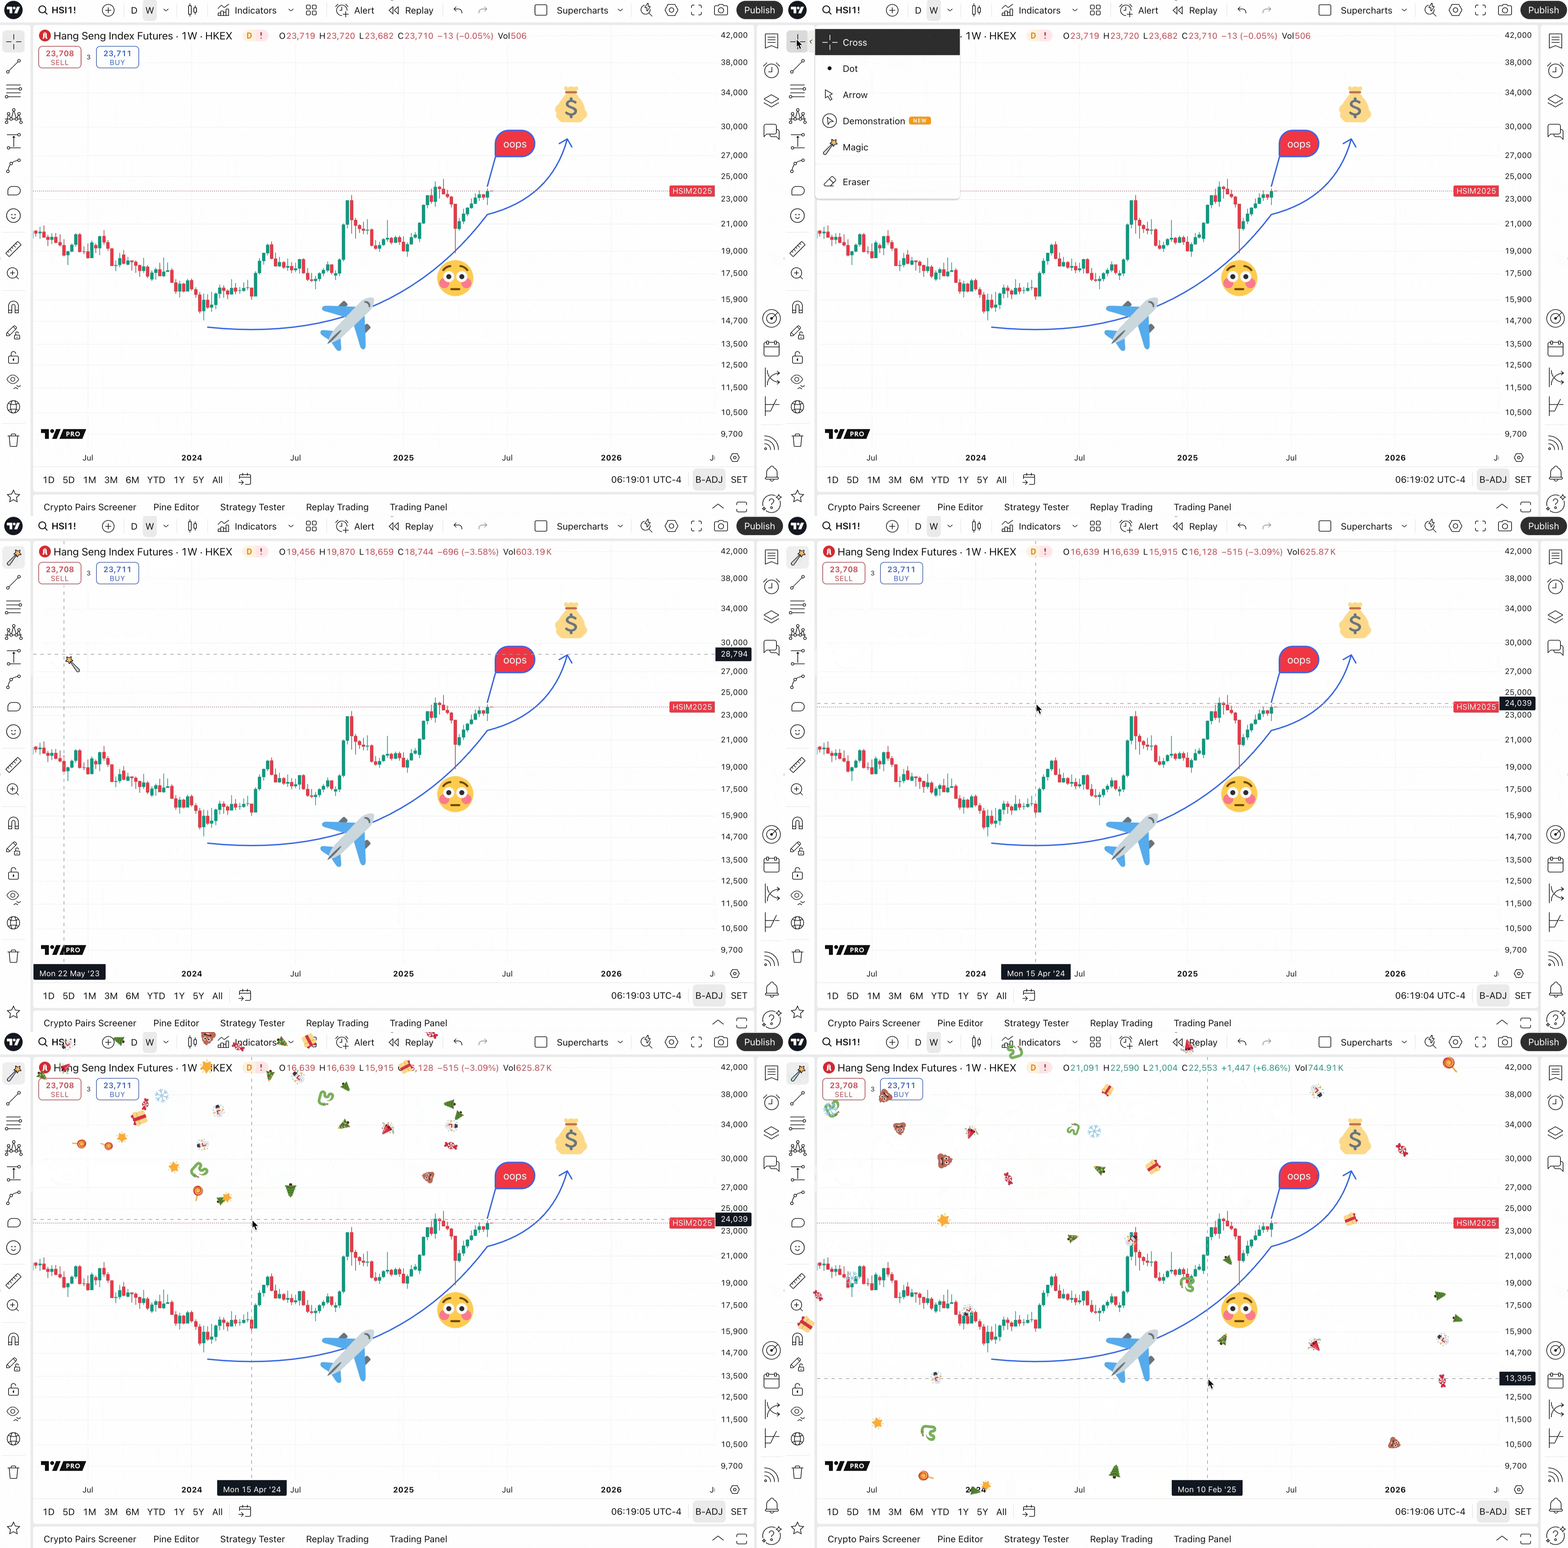
Trend tools
These drawing tools help you mark price movement directions and spot crucial price levels like support and resistance. You can use trendlines as you wish — not only to spot trends. It doesn't matter the purpose — sometimes a line is just a line.
On the Supercharts, you have access to:
Channels are great for mapping out trading zones — both current and potential. They consist of two trendlines, creating — just like their name suggests — a channel. Some of the available channels are:
You can use them to make the current high and low prices more noticeable. Another option is to use them to identify potential price levels where the price might go. In essence, they are standard trendlines with some tweaks.
The Pitchfork drawing tool plots three trendlines, creating more advanced ranges with a median trendline, an upper resistance line, and a lower support line. This drawing tool may provide you with a better understanding of potential price movement, as the price may falsely break out and then return to the previous trading channel.
Pitchforks come in different variations:
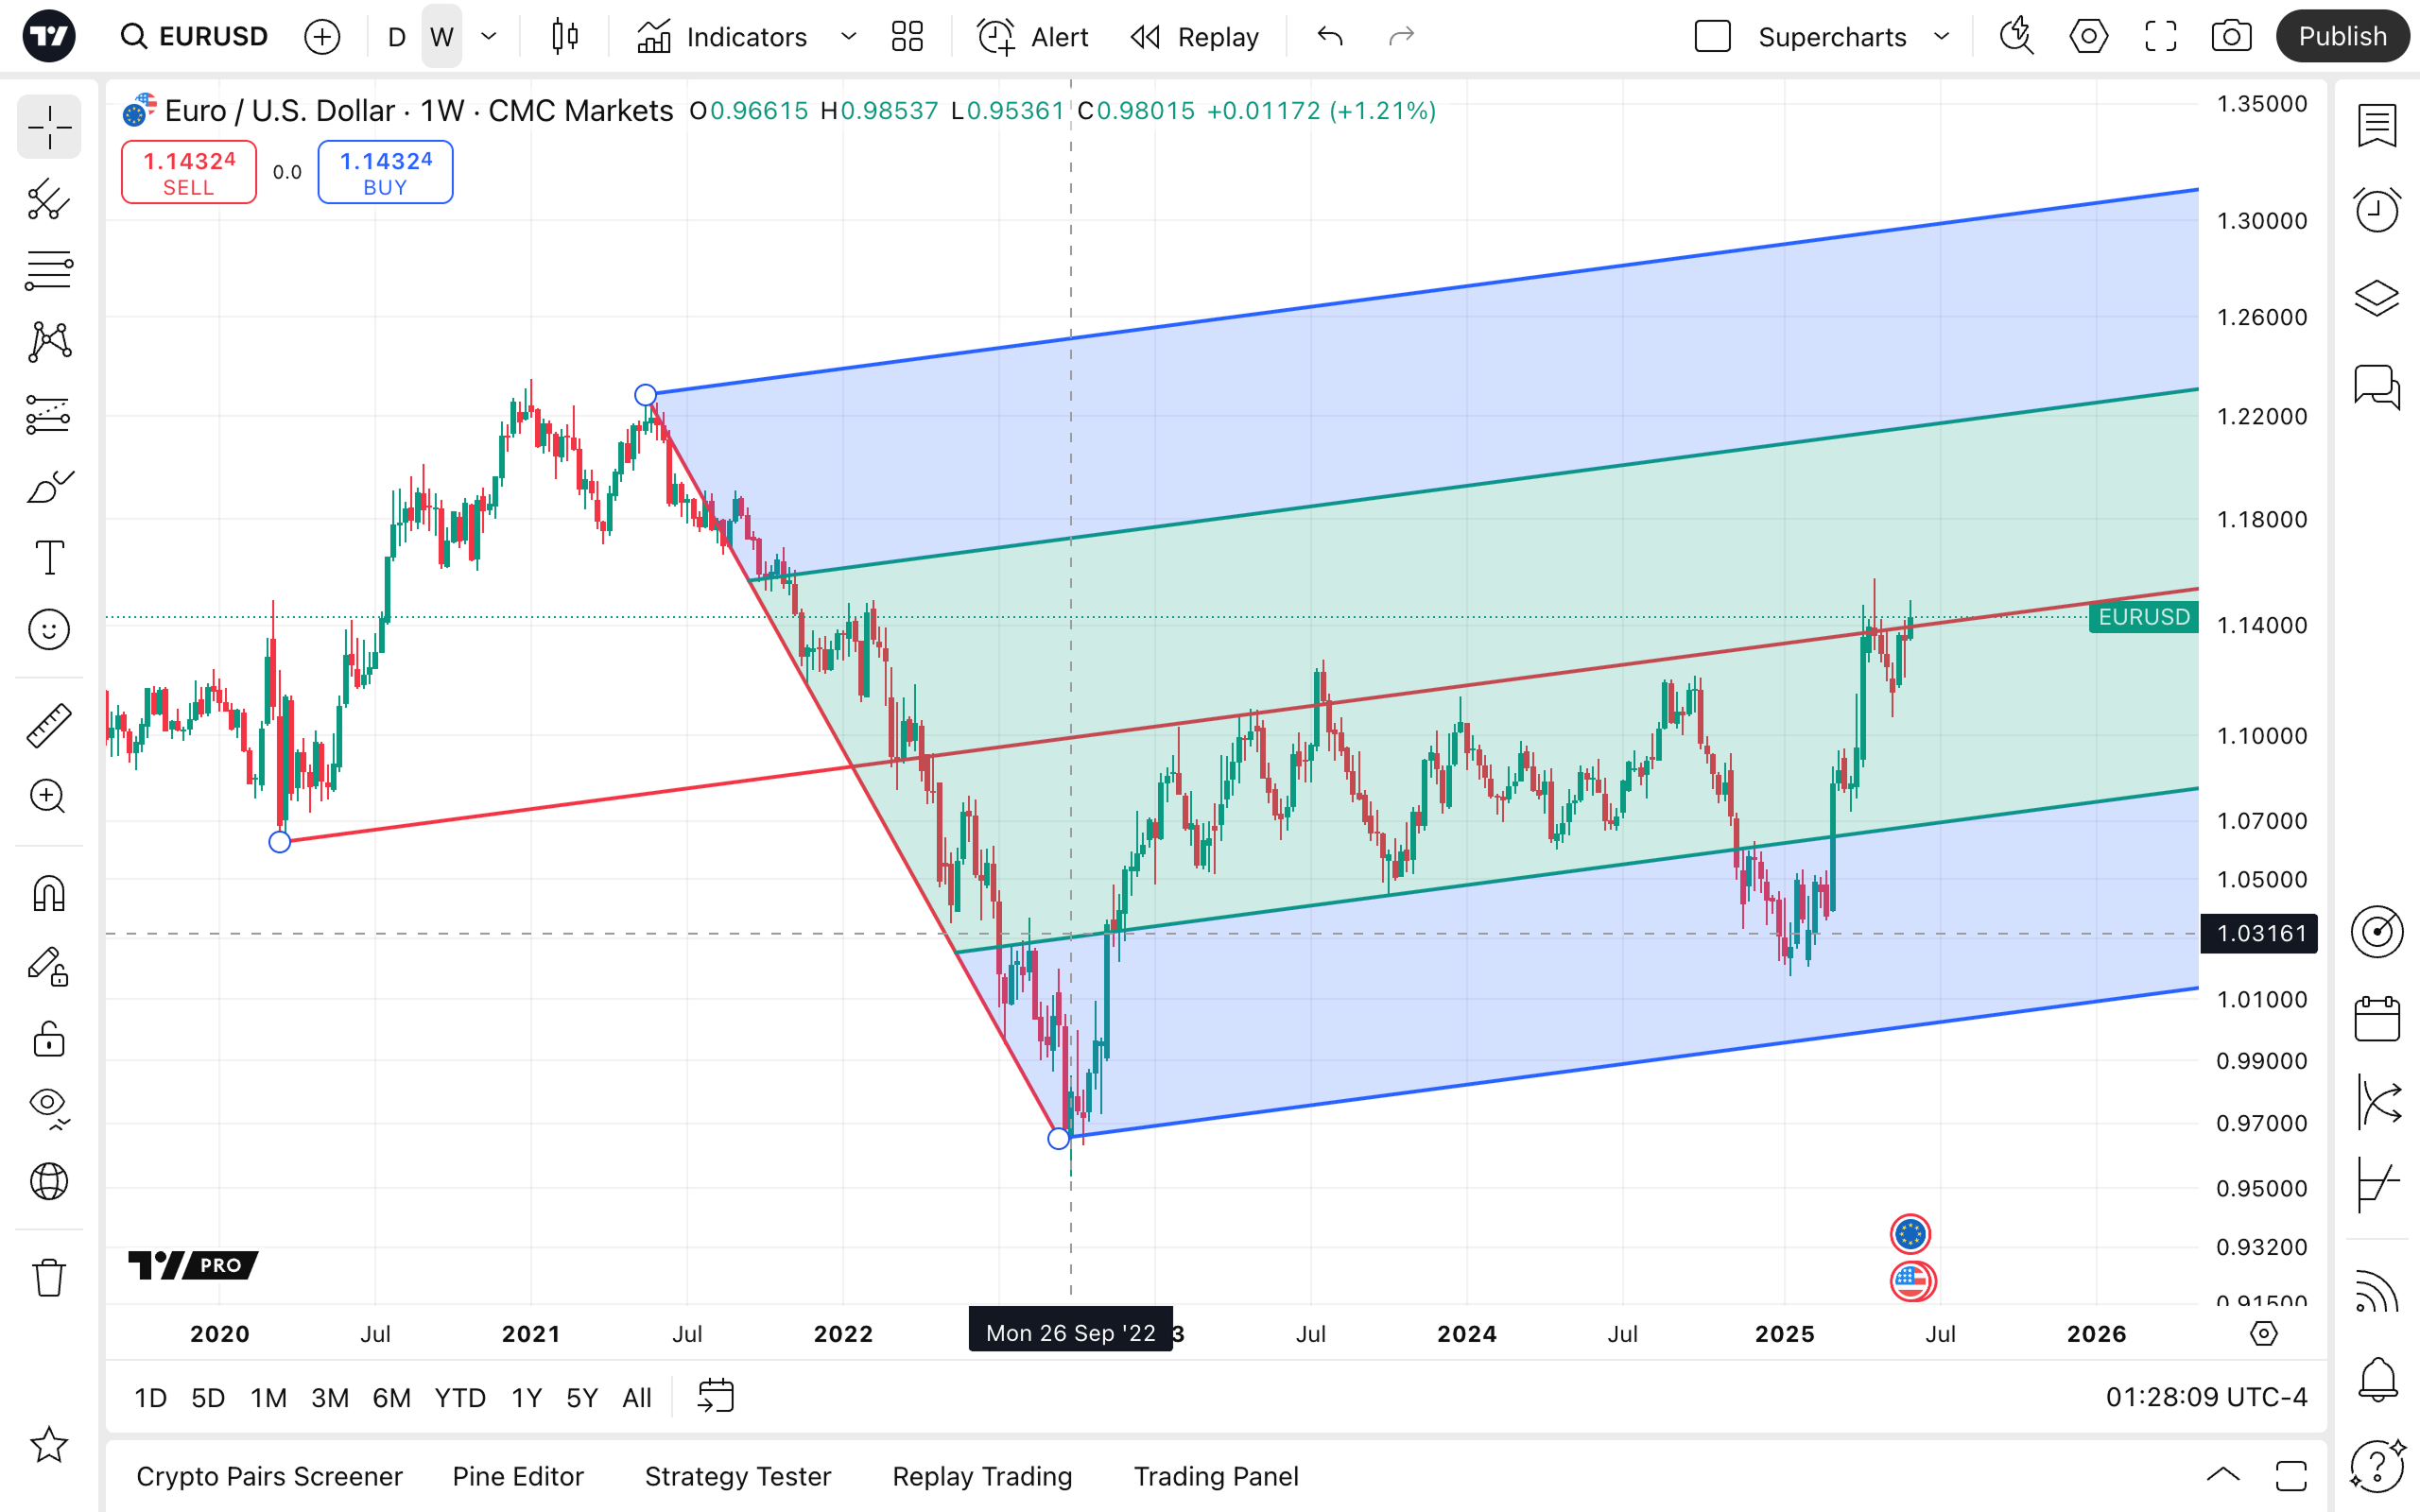
Fibonacci and Gann tools
Fibonacci tools use levels that are based on the relationships between Fibonacci numbers. They are used in the direction of the trend to identify support and resistance levels — potential buy and sell zones. Fibonacci tools come in many variations, such as:
- Fibonacci retracement
- Trend-based fib extension
- Fib channel
- Fib time zone
- Fib speed resistance fan
- Trend-based fib time
- Fib circles
- Fib spiral
- Fib speed resistance arcs
- Fib wedge
- Pitchfan
William D. Gann developed a theory that the market moves in angles. He believed that we could predict price changes by combining knowledge of geometric shapes, astrology, and mathematics. If such an idea correlates with your view on the tradingverse, we offer you the following drawing tools:
Patterns
If you spot a chart pattern, you may want to highlight it and ensure it fits perfectly with the pattern you have identified. Designed specifically for different patterns, these drawing tools help you make them look unique and informative:
- XABCD pattern
- Cypher pattern
- Head and shoulders pattern
- ABCD pattern
- Triangle pattern
- Three drives pattern
- Elliott waves patterns
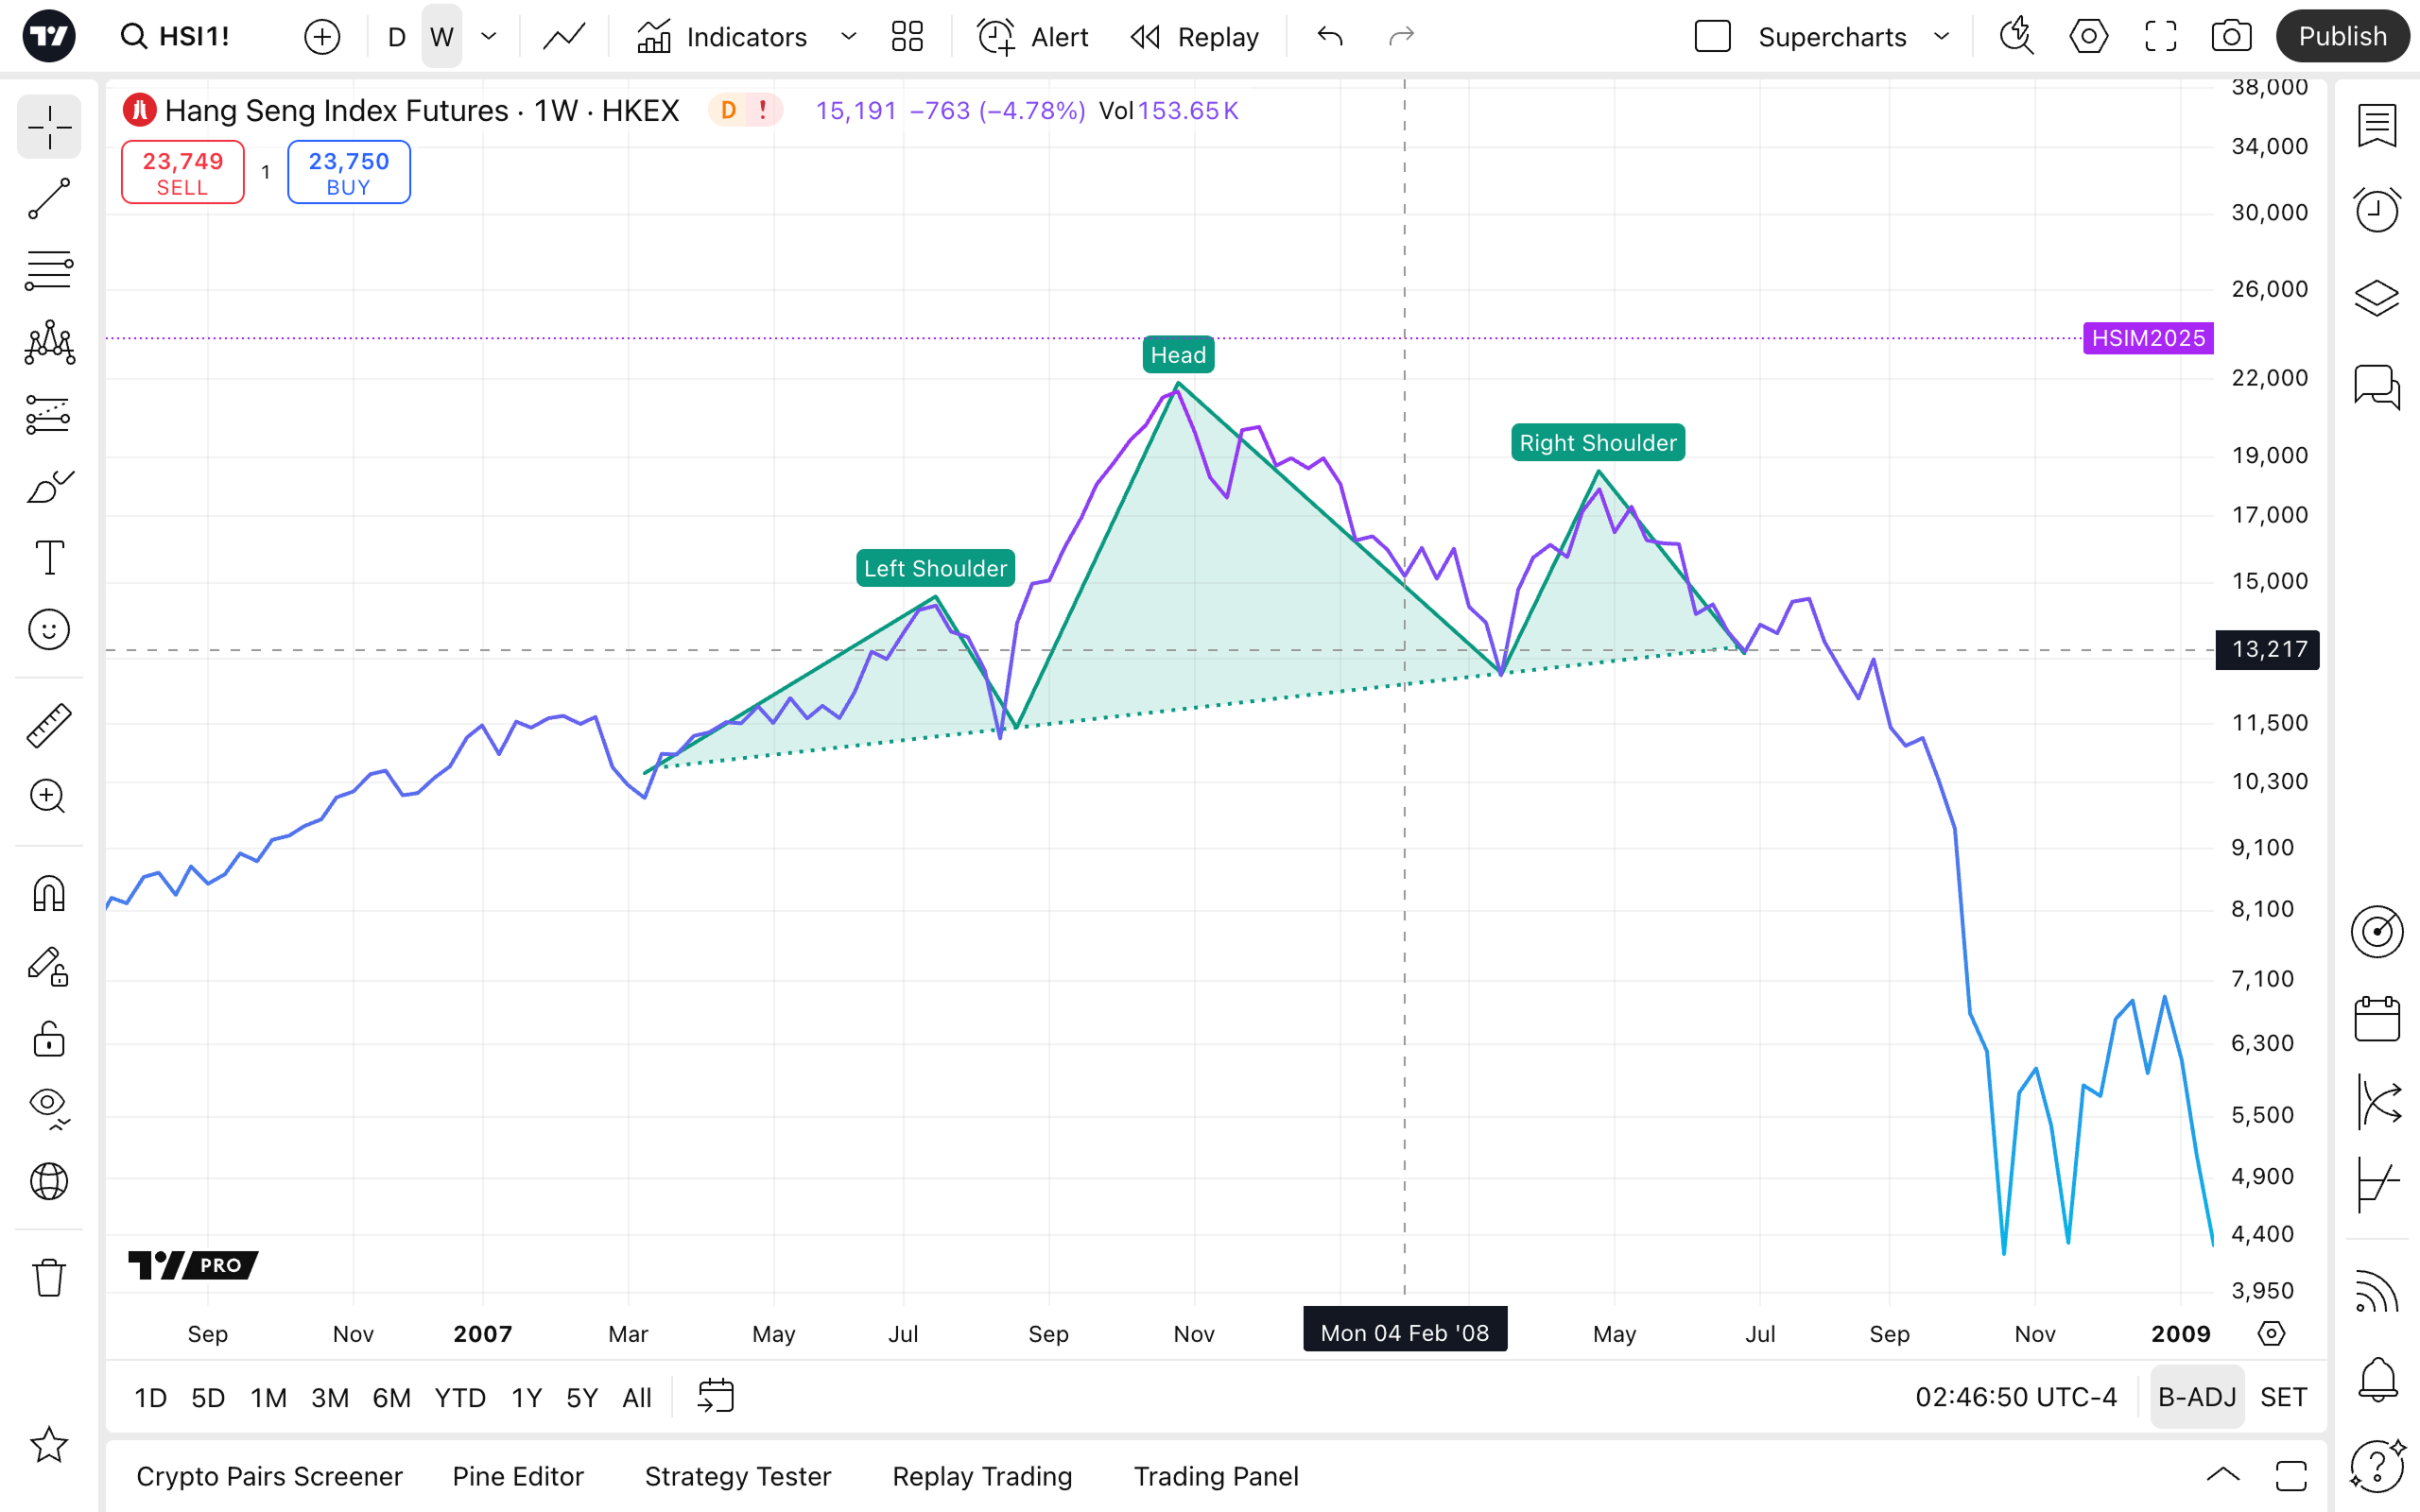
If you're a cycle trader or just occasionally refer to this hypothesis, you can access the following drawings and apply them as you see fit:
Forecasting and measurement tools
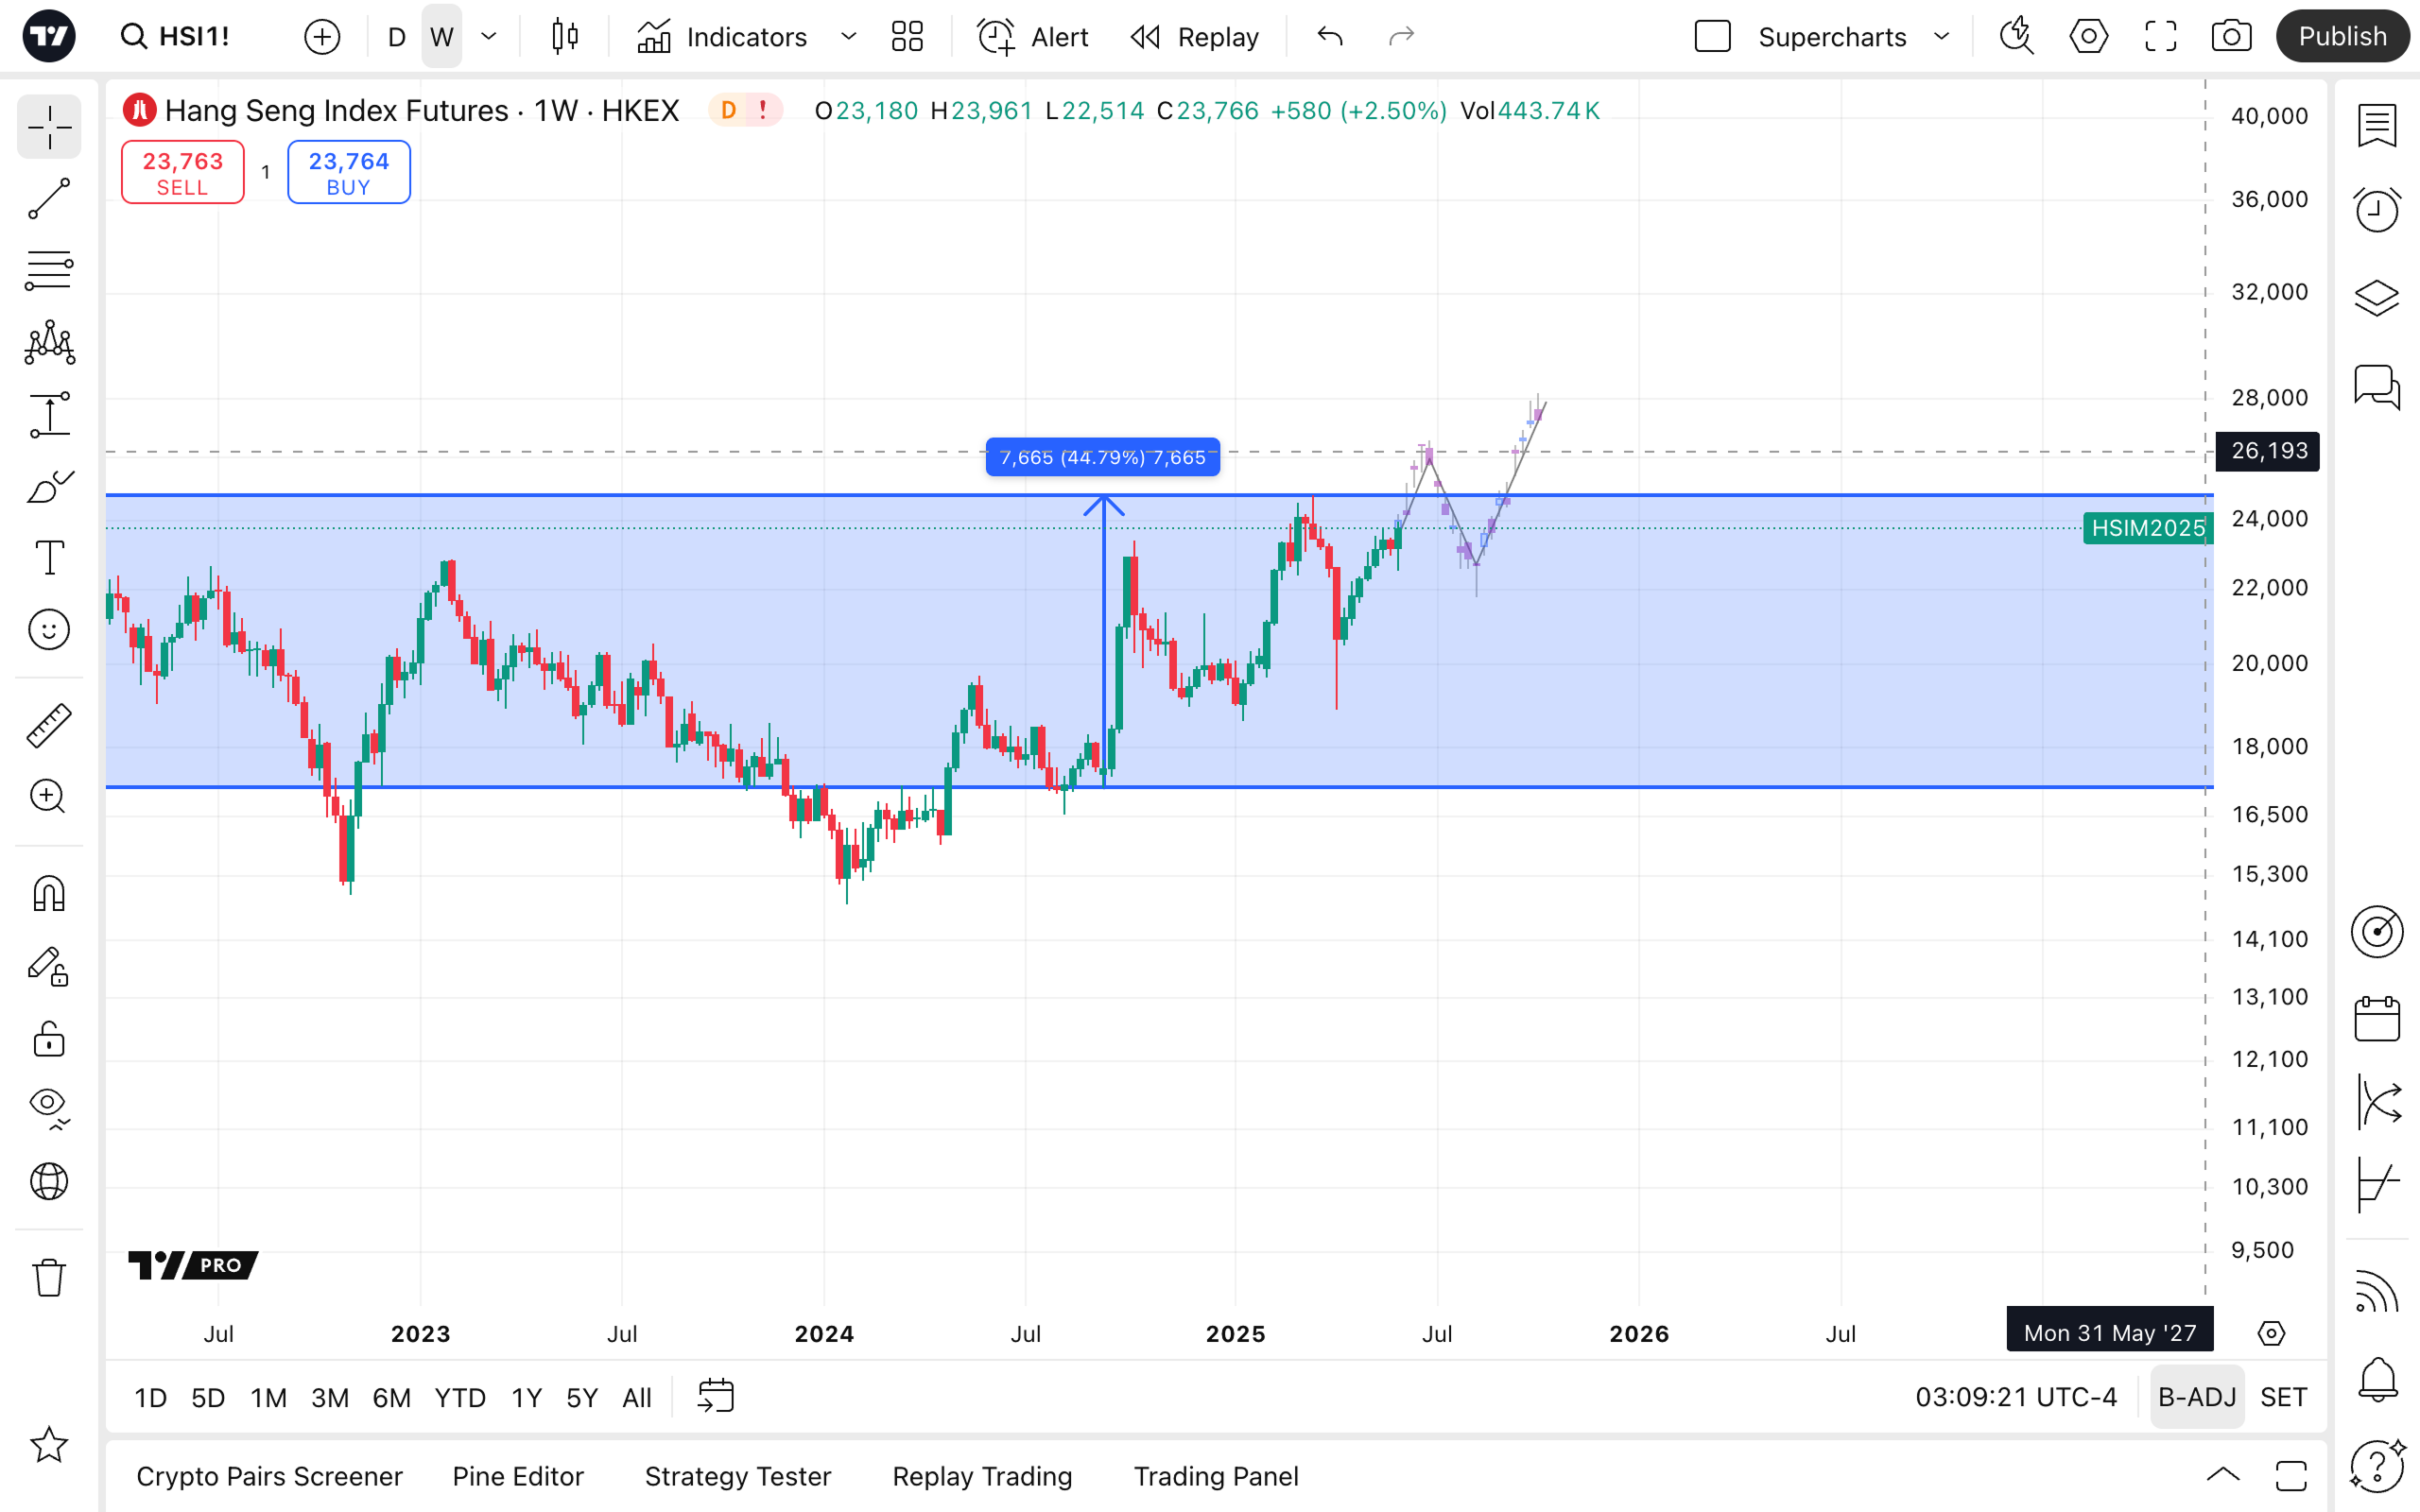
With these tools, you can gauge chart distances and project the past into the future to foresee price movements. Forecasting tools help you identify potential price trajectories and adjust your positions accordingly. For that, you can use:
Volume-based drawing tools display trading volume to help you identify support and resistance levels. To discern potential ranges for buying the dip and selling the rip, you can use one of these tools:
With measurers, you can gauge time and date on your Supercharts:
- Price range
- Date range
- Date and price range
Geometric shapes
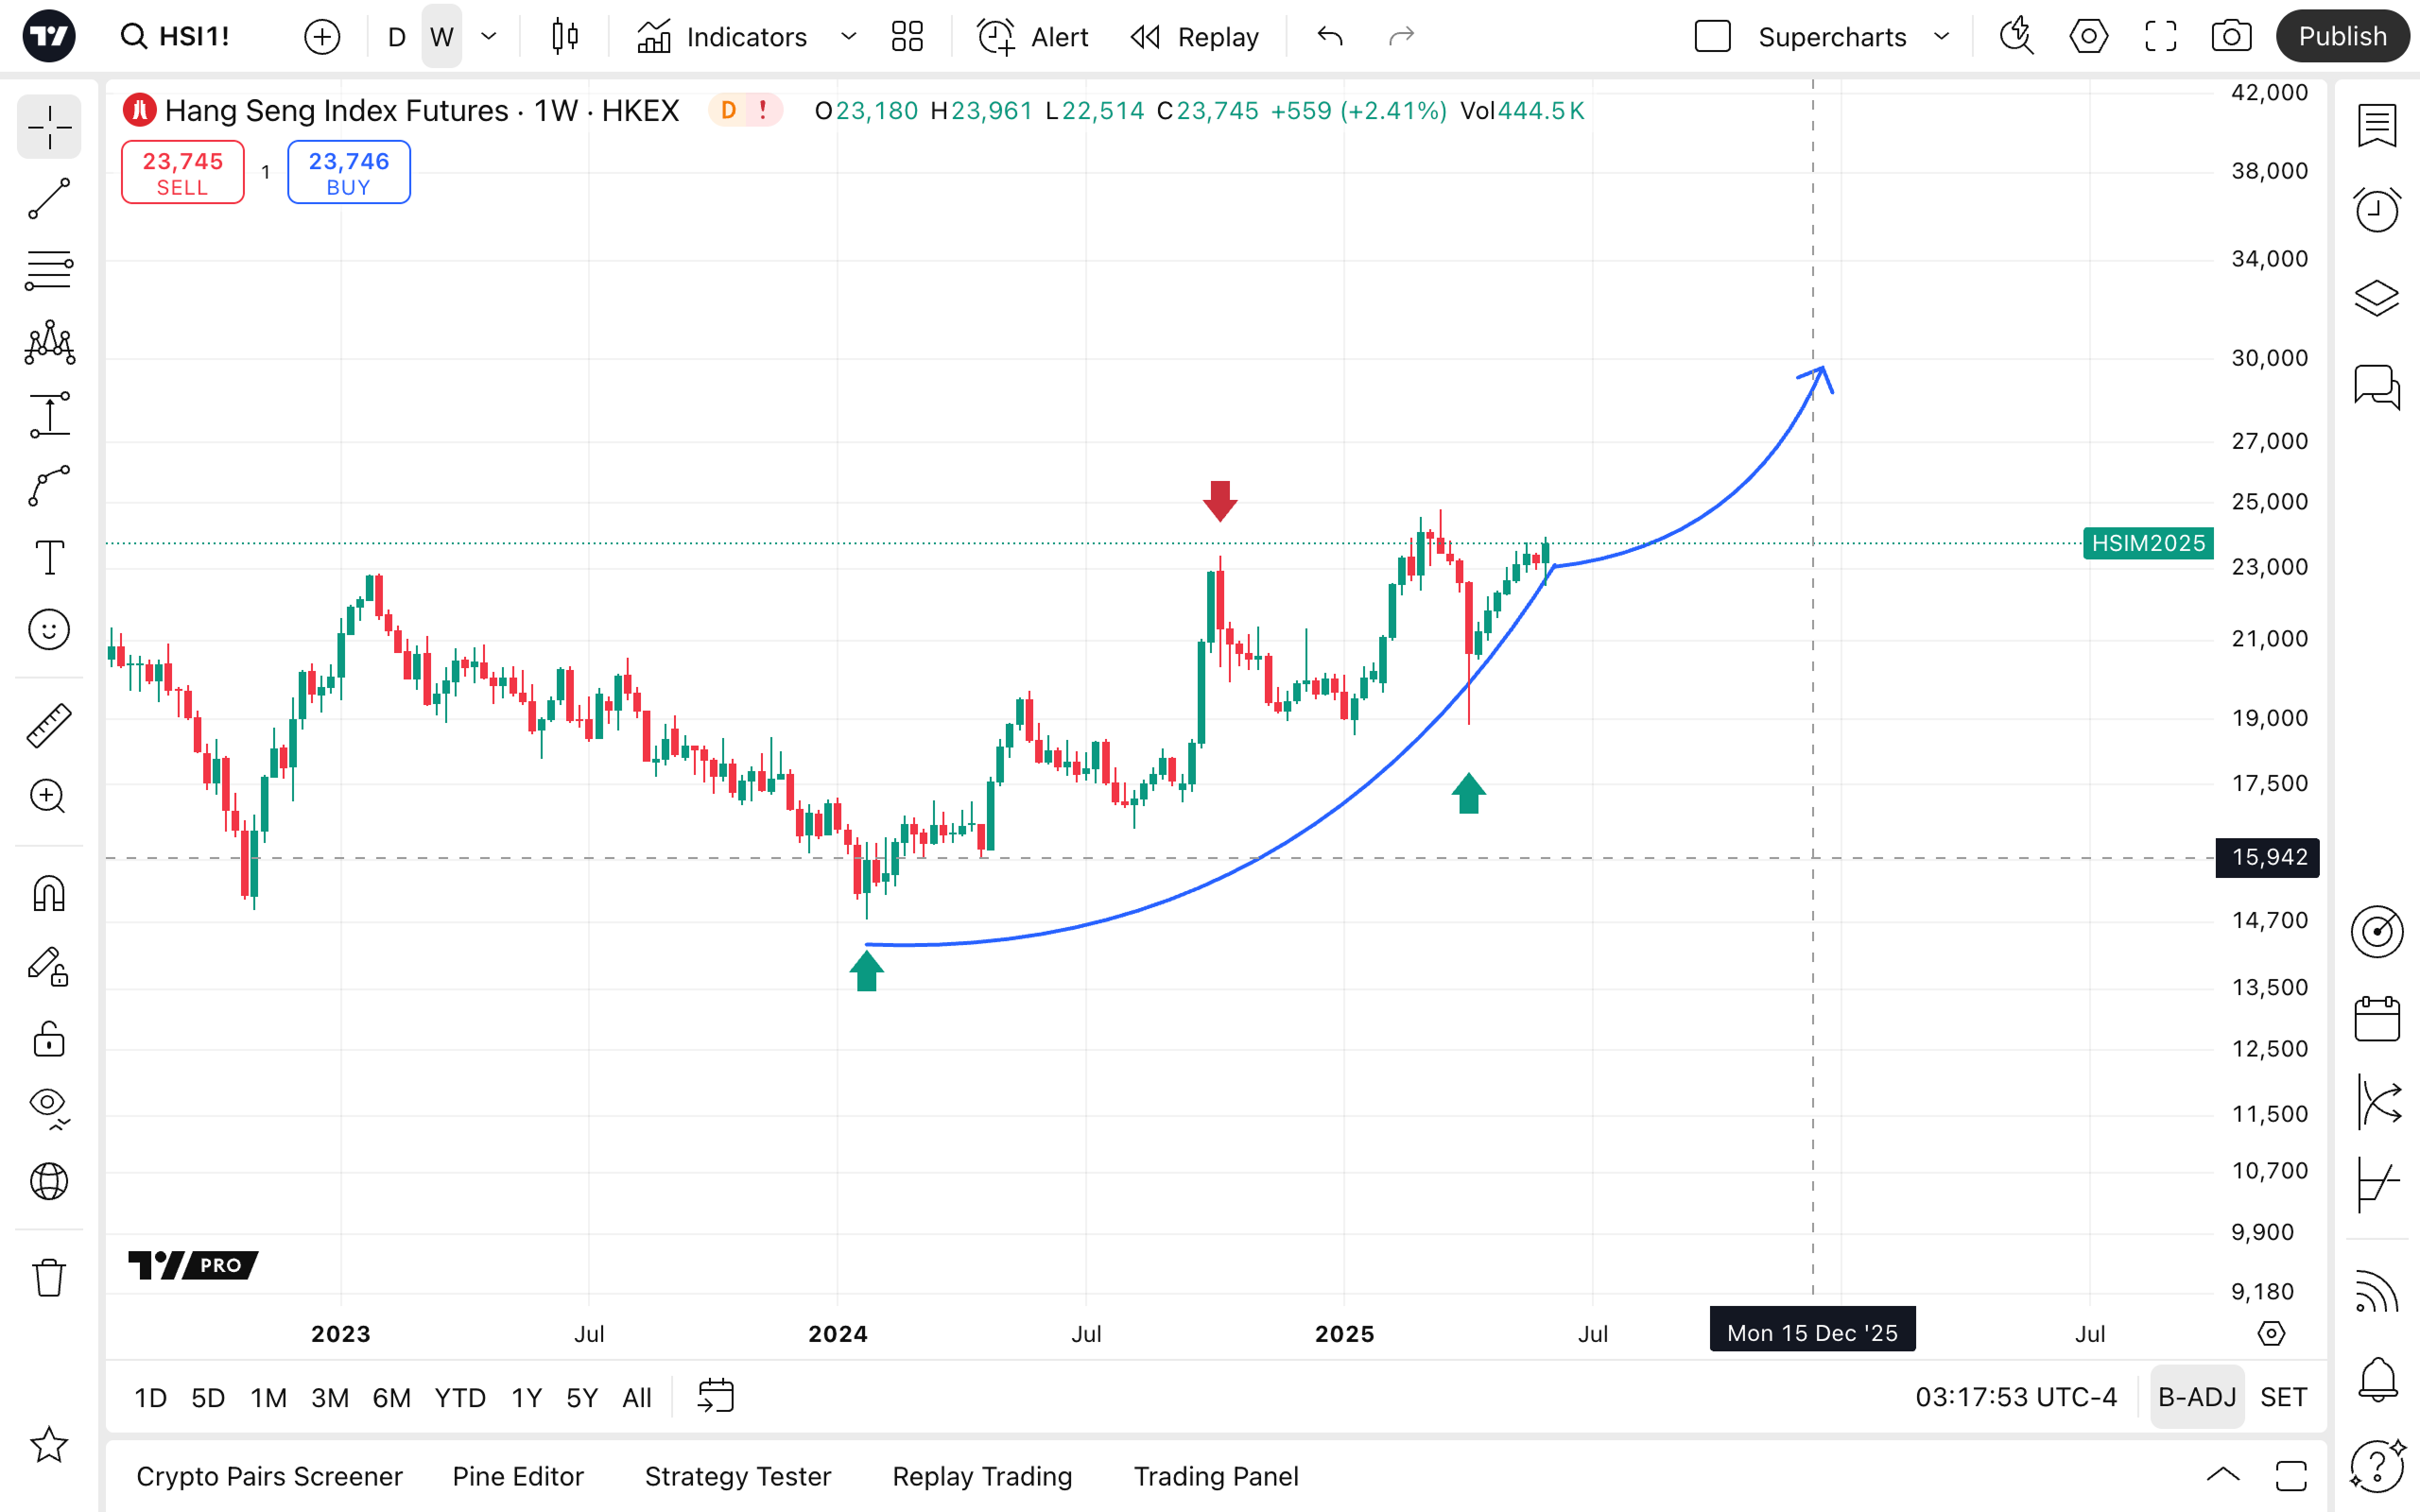
As for the classic geometric shapes, you can find and use:
Also, in this section of the drawing toolbar, you can access the following brushes and arrows:
Annotation tools
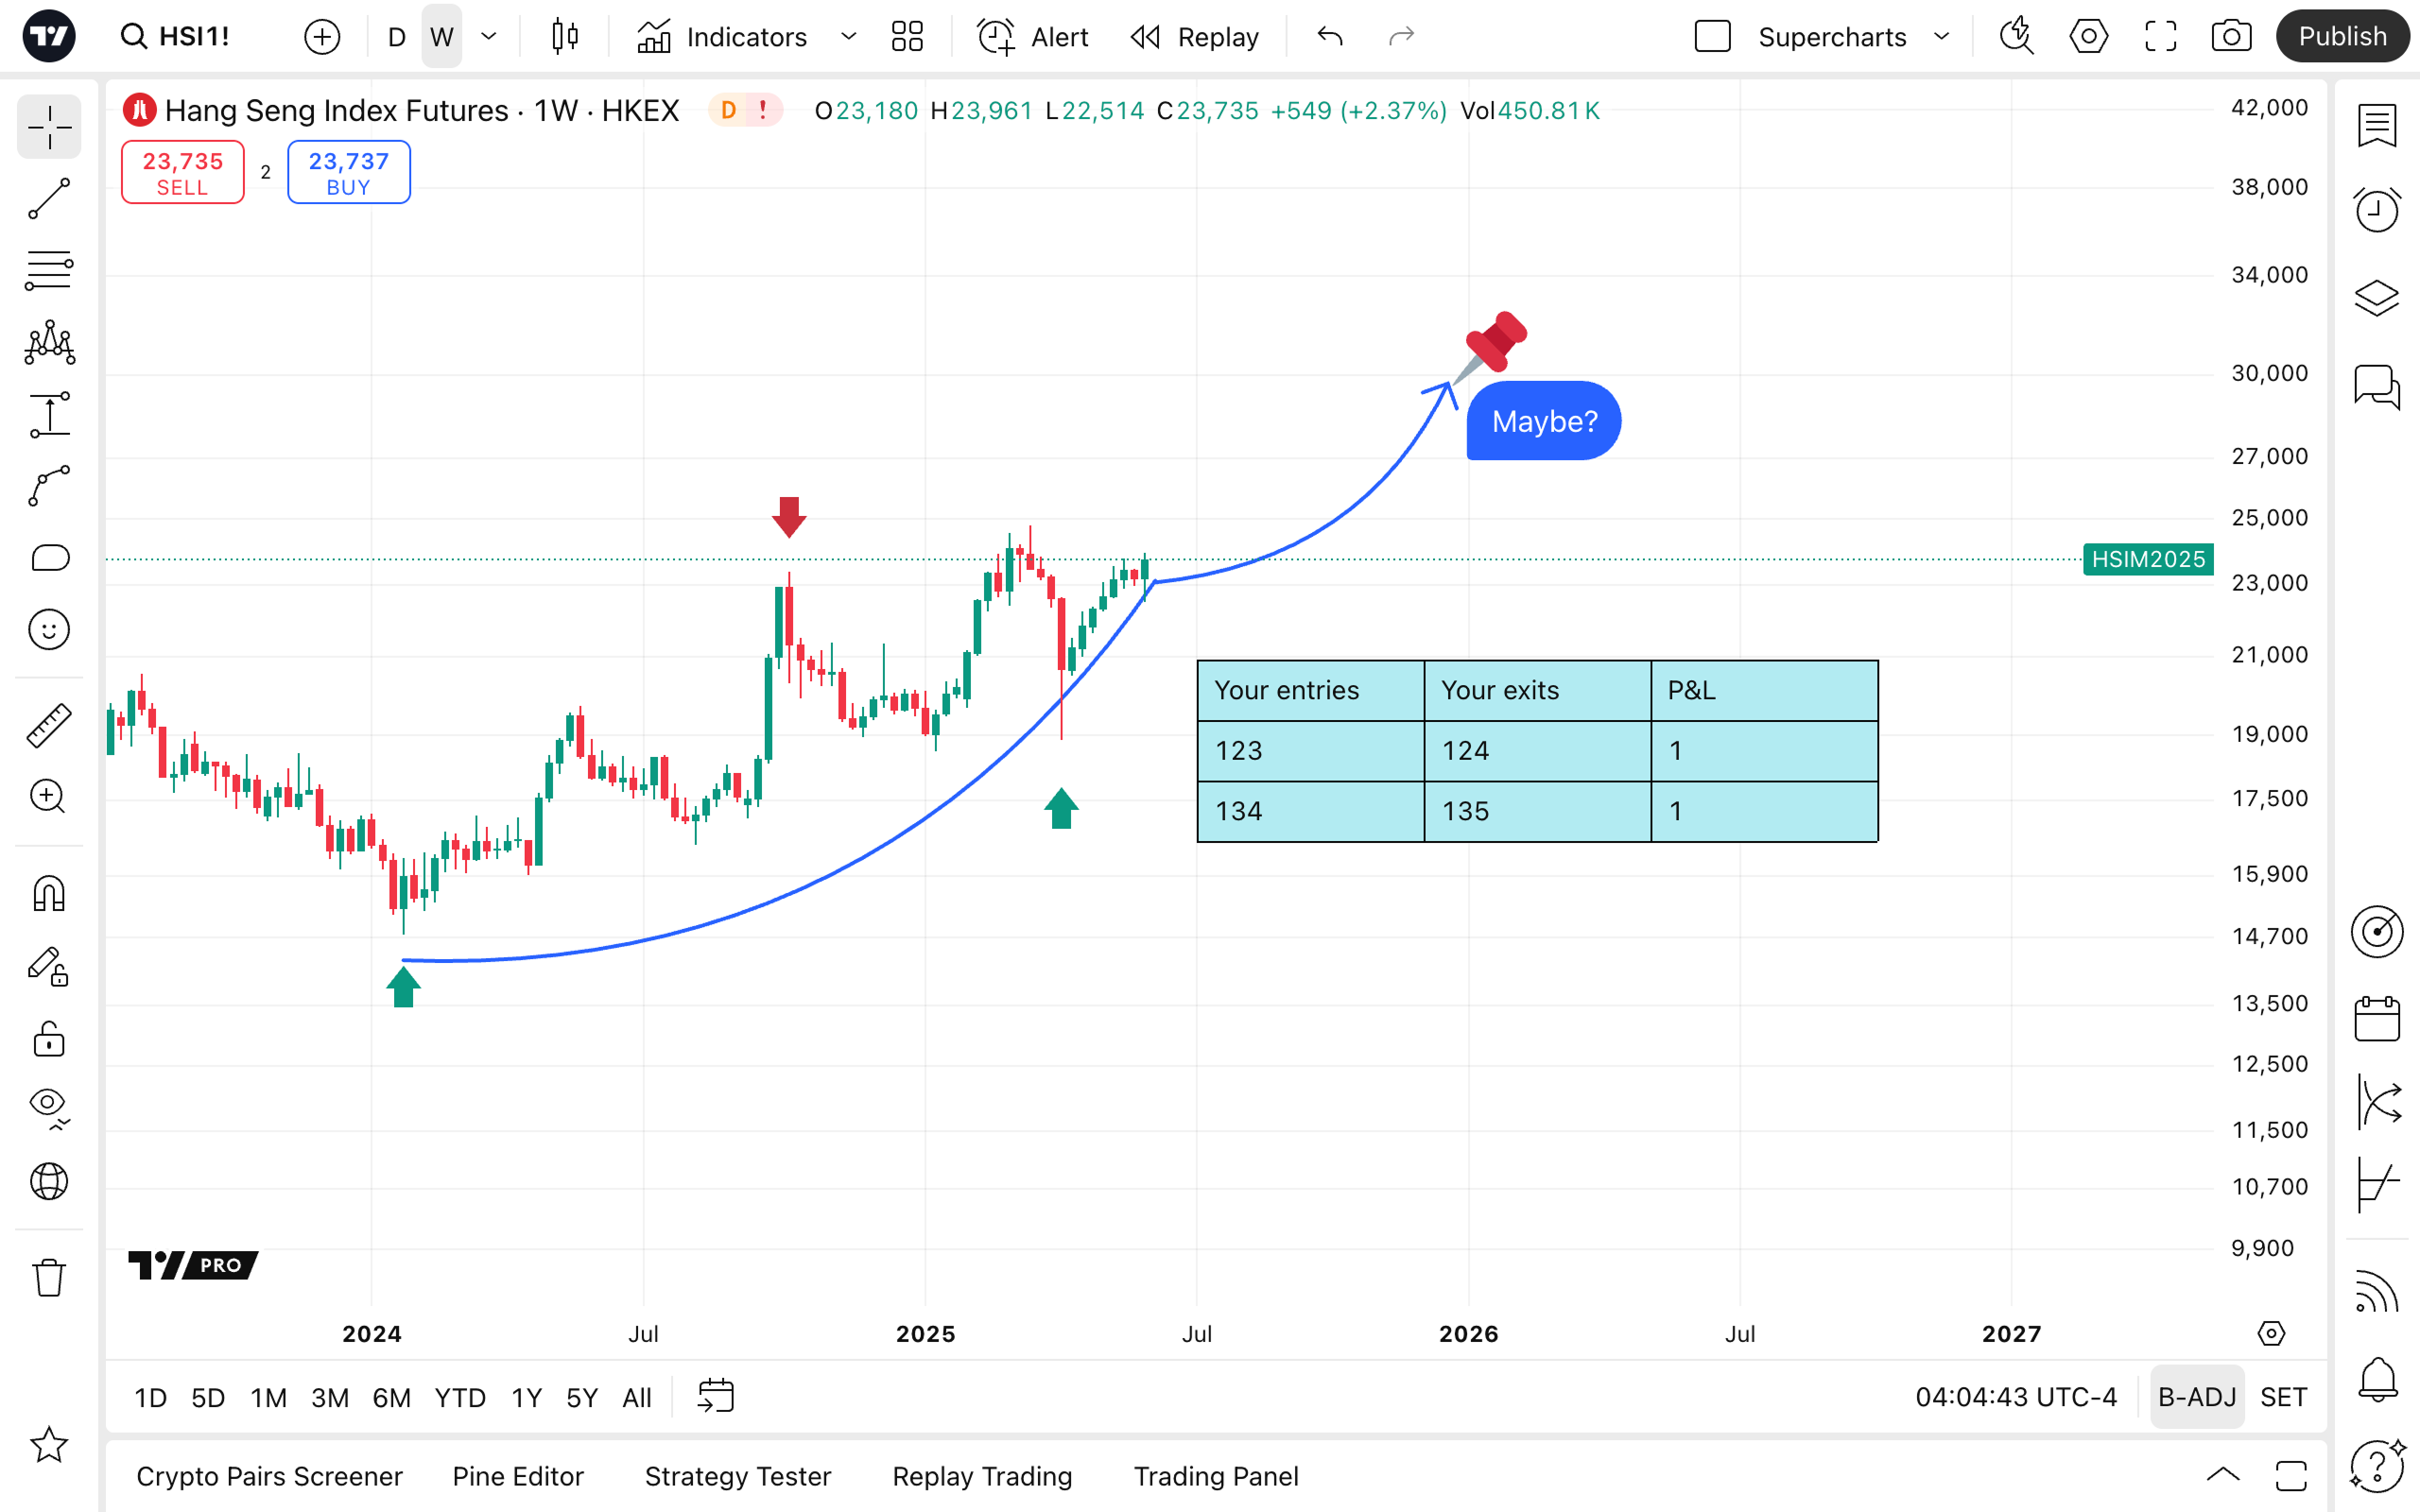
Add notes directly to the chart, making your analysis clearer. If you need to make a price note, leave a comment, or create a table, explore the broad range of annotation tools:
For content creation purposes, to engage with your audience, look for the following features:
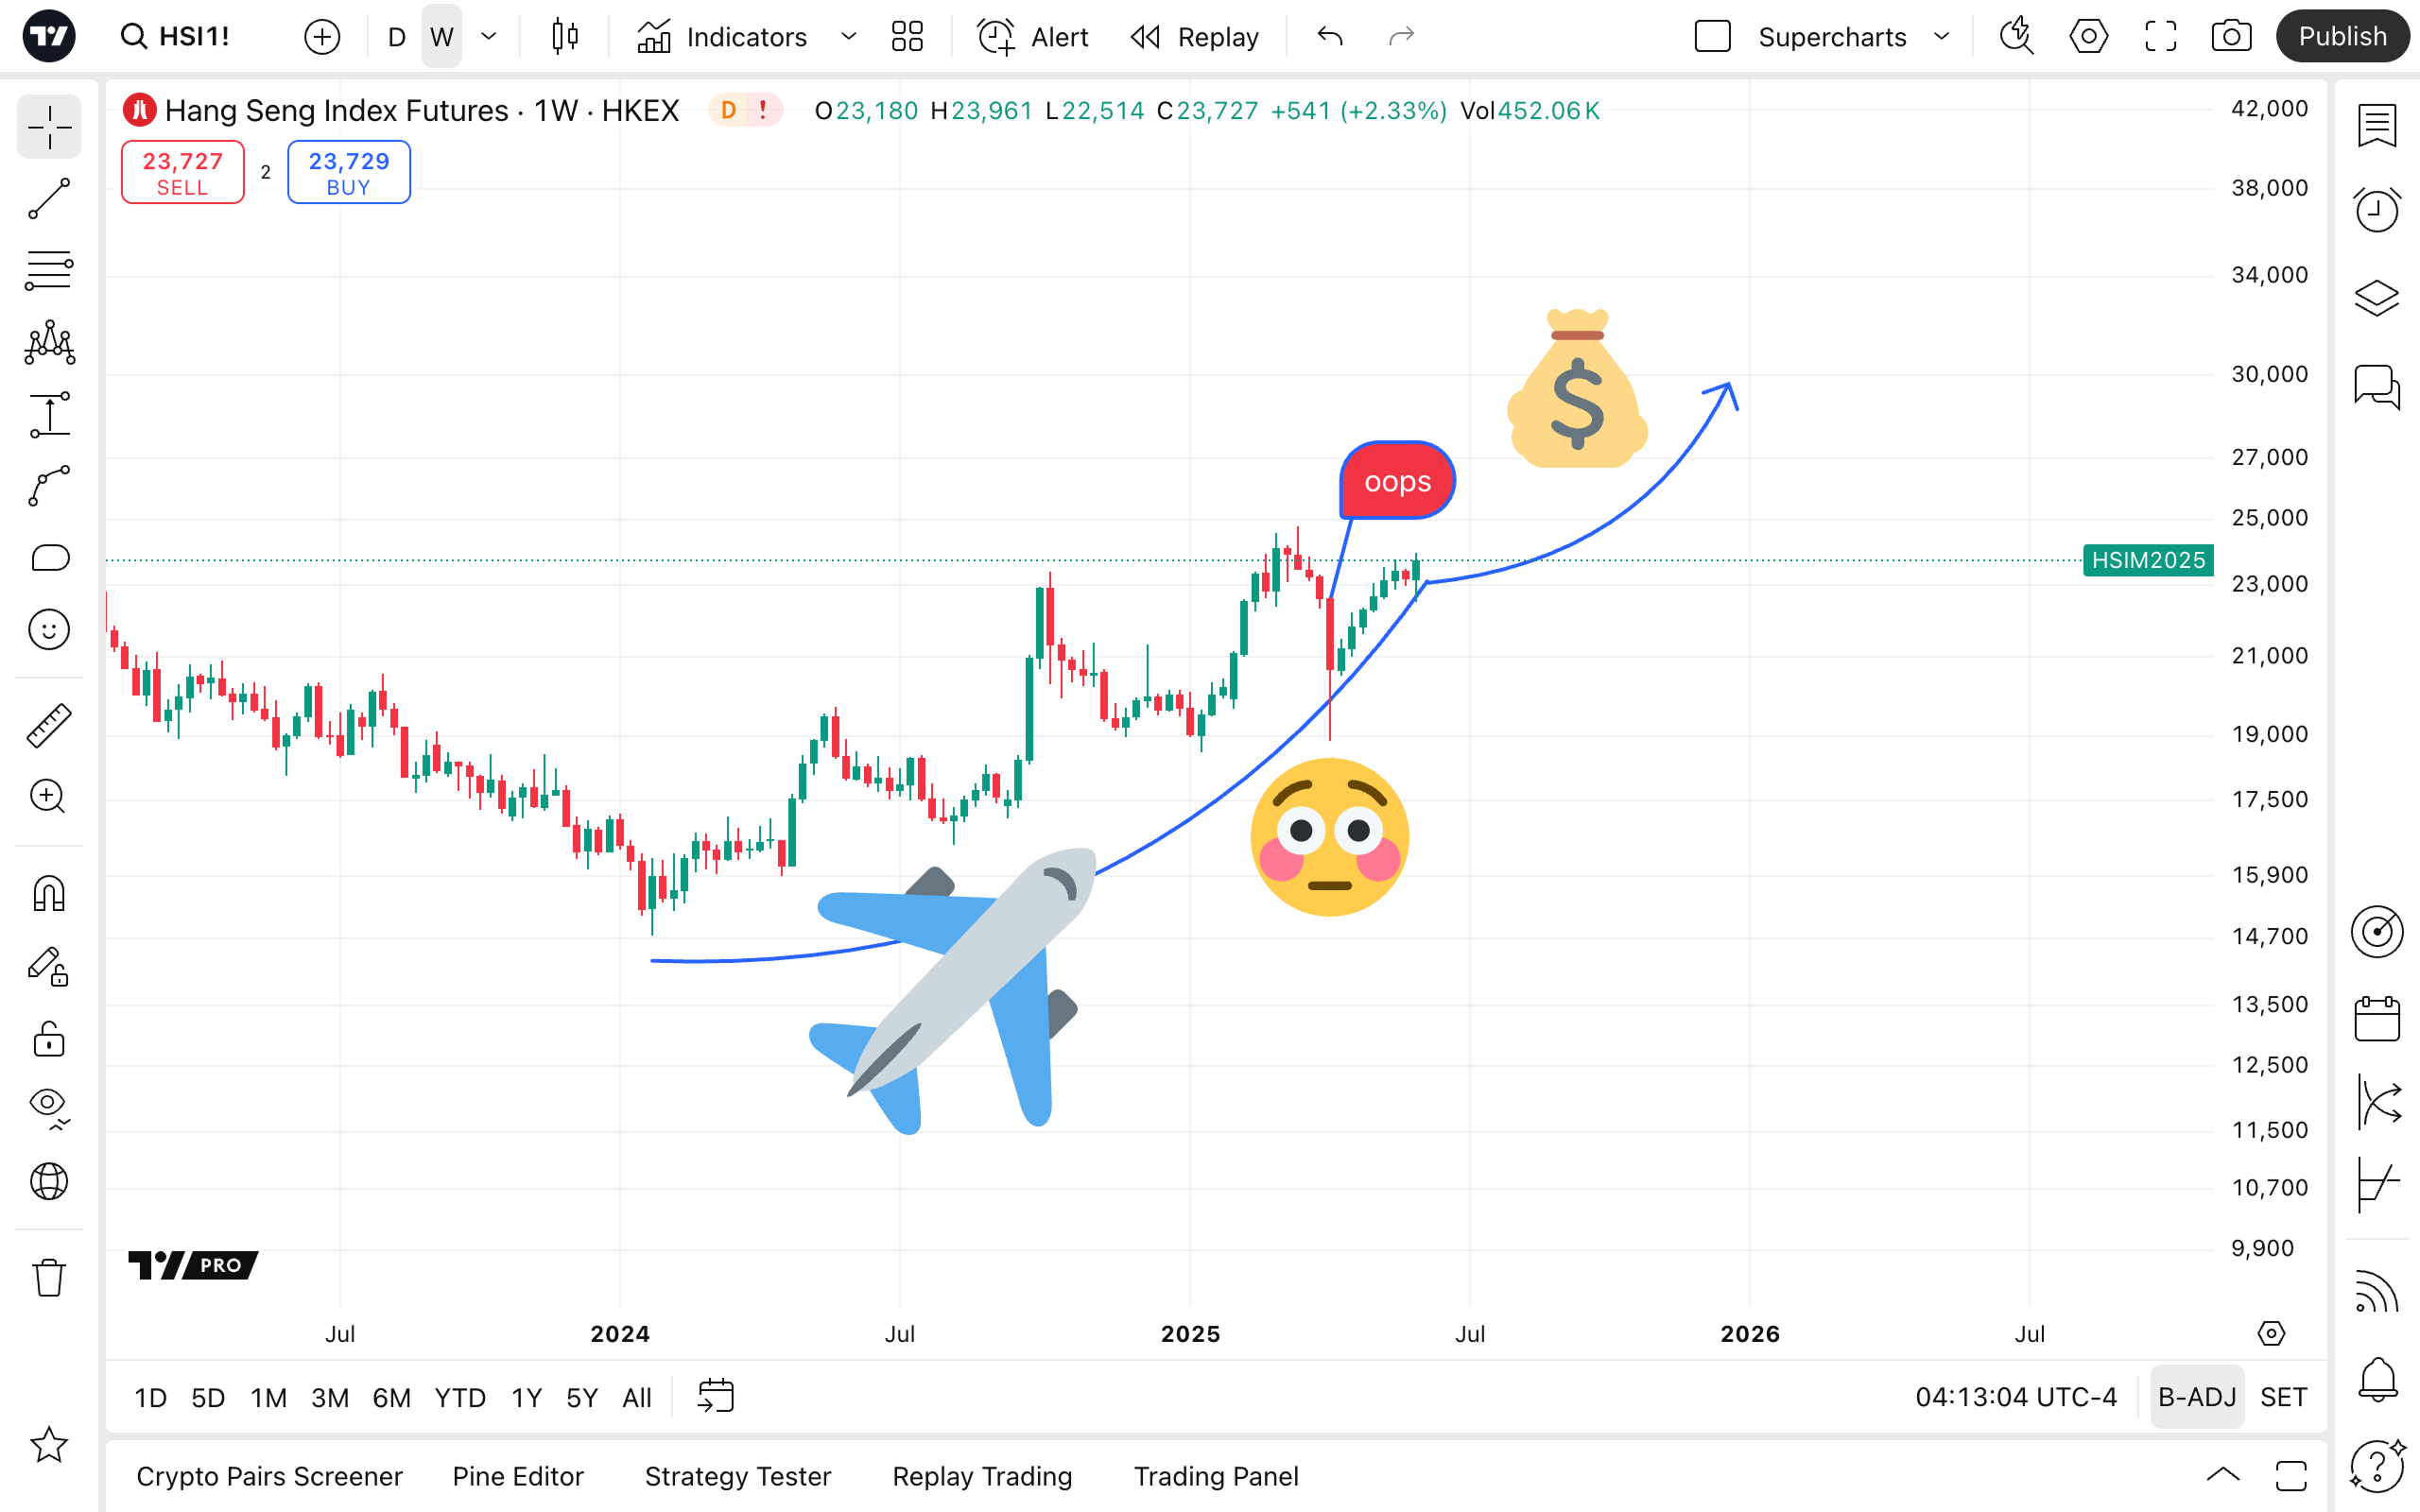
Chart management utilities
- Measure: With this tool, you can measure the distance between bars in either direction and see the price changes. This is a helpful tool to quickly see an asset's performance over multiple bars and determine what your next take-profit and stop-loss orders might be.
- Zoom in: You can use this tool to magnify a particular area of the chart to scrutinize a specific section.
- Magnets: Make the drawings "stick" to the nearest price point.
- Strong magnet: Forces drawings to glue to the open, high, low, or close prices.
- Weak magnet: Allows your drawings to be placed at a distance from the price.
Note: If you choose "Snap to indicators," your drawings will consider overlay indicator values as attachment points, just like they do with price.
- Keep drawing: Choose this if you need to add multiple objects to the chart successively. If not selected, after each drawing is placed, you will return to your cursor.
- Lock all drawings: This option prevents accidental movement of drawings. Each drawing can be easily moved to another place on the chart, which is sometimes undesirable. With this feature, you can make sure they stay exactly where you intend them to be. If an accidental drawing replacement happens, you can always press Ctrl + Z or Cmd + Z to undo it.
- Hide options: Sometimes it's easy to overdo it with drawings and indicators and get lost in all of them. To clear up your chart, even temporarily, you can hide Drawings, Indicators, Positions and orders, or All.
- Sync drawings options: With the Sync drawings options, you can make them appear on other layouts. To master this feature, learn more about TradingView layouts and how to leverage multi-chart setups.
- Remove options: Similar to Hide options, you can delete drawings, indicators, or both.
Oh, and one last thing...
Developing your own analysis approach is a time-consuming process, but it's definitely worth it. You are unlikely to see two traders using the same indicators with the same settings, using the same drawing tools, on the same layouts, for the same assets.
Uniqueness and personalization are the basis of successful charting. We're always here to help you find the best tools and instruments to highlight your view.
Also read: