
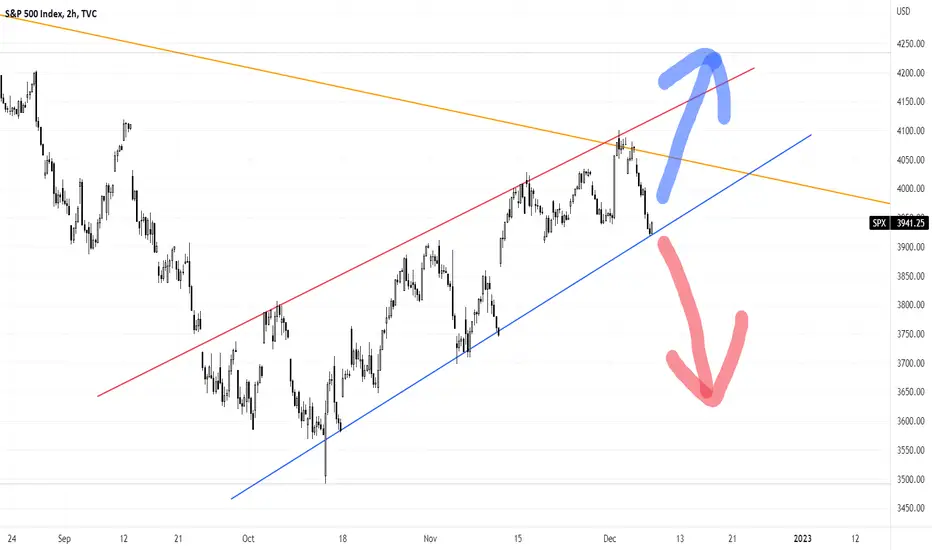
S&P 500 (2H chart) @ 6 December 2022
Drilling down to the more granular 2-hour chart, it's clear that the S&P 500 is at another make-or-break situation...
- Index is testing the strong support (blue line)
- Index previously rejected two strong resistances:- (i) mid-term trendline (red line) and (ii) long-term counter-trendline (orange line)
Drilling down to the more granular 2-hour chart, it's clear that the S&P 500 is at another make-or-break situation...
- Index is testing the strong support (blue line)
- Index previously rejected two strong resistances:- (i) mid-term trendline (red line) and (ii) long-term counter-trendline (orange line)

פרסומים קשורים
כתב ויתור
המידע והפרסומים אינם מיועדים להיות, ואינם מהווים, ייעוץ או המלצה פיננסית, השקעתית, מסחרית או מכל סוג אחר המסופקת או מאושרת על ידי TradingView. קרא עוד ב־תנאי השימוש.
פרסומים קשורים
כתב ויתור
המידע והפרסומים אינם מיועדים להיות, ואינם מהווים, ייעוץ או המלצה פיננסית, השקעתית, מסחרית או מכל סוג אחר המסופקת או מאושרת על ידי TradingView. קרא עוד ב־תנאי השימוש.