
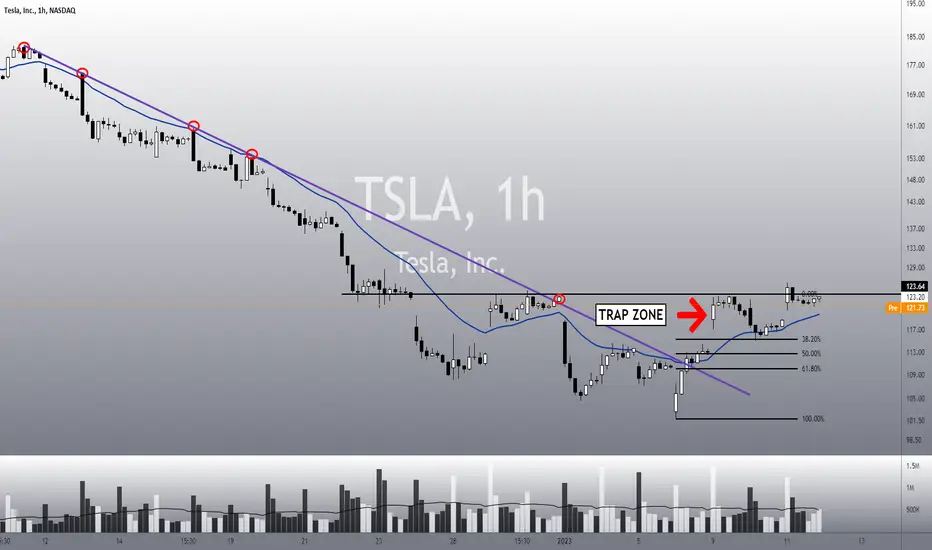
• TSLA is still trading inside a “Trap Zone”, between the support level at the 21 EMA, and the resistance level under $123. Since the 21 EMA keeps climbing, it’ll squeeze the price in a tighter range as time passes, and soon, it’ll have to do a breakout;
• If TSLA does a downwards breakout, and loses the 21 ema, probably it will seek the 61.8% Fibonacci’s Retracement again (at least);
• This could be the bullish reversal structure that could reverse the bearish sentiment we mentioned in our previous public study on TSLA – link below this post;
• Since TSLA broke the purple trend line, it seems it wants to reverse the trend. Either way, a confirmation would only come if TSLA breaks the $123;
• In case of an upwards breakout, TSLA could seek the 21 EMA in the daily chart, or even one of the retracements, as seen on the chart below:

• It all depends on how it’ll react after a breakout from the Trap Zone in the 1h chart. I’ll keep you updated on this, as usual.
Remember to follow me to keep in touch with my daily analyses!
• If TSLA does a downwards breakout, and loses the 21 ema, probably it will seek the 61.8% Fibonacci’s Retracement again (at least);
• This could be the bullish reversal structure that could reverse the bearish sentiment we mentioned in our previous public study on TSLA – link below this post;
• Since TSLA broke the purple trend line, it seems it wants to reverse the trend. Either way, a confirmation would only come if TSLA breaks the $123;
• In case of an upwards breakout, TSLA could seek the 21 EMA in the daily chart, or even one of the retracements, as seen on the chart below:
• It all depends on how it’ll react after a breakout from the Trap Zone in the 1h chart. I’ll keep you updated on this, as usual.
Remember to follow me to keep in touch with my daily analyses!

פרסומים קשורים
כתב ויתור
המידע והפרסומים אינם מיועדים להיות, ואינם מהווים, ייעוץ או המלצה פיננסית, השקעתית, מסחרית או מכל סוג אחר המסופקת או מאושרת על ידי TradingView. קרא עוד ב־תנאי השימוש.
כתב ויתור
המידע והפרסומים אינם מיועדים להיות, ואינם מהווים, ייעוץ או המלצה פיננסית, השקעתית, מסחרית או מכל סוג אחר המסופקת או מאושרת על ידי TradingView. קרא עוד ב־תנאי השימוש.