
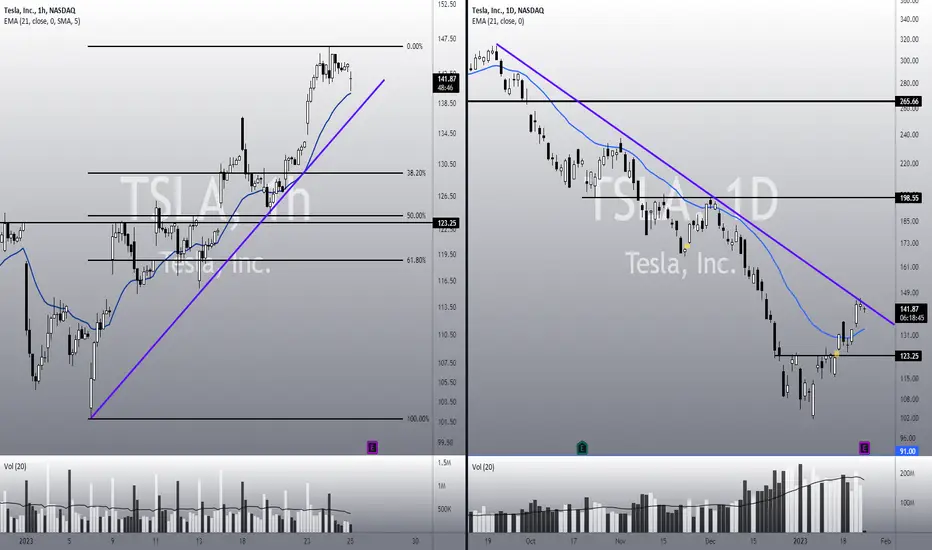
• It seems TSLA wants to correct from here. If it loses the dual-support made by the 21 ema + purple trend line in the 1h chart, we might expect a pullback to the 21 ema in the daily chart, at least;
• The most important support level is the $123. Only if TSLA loses this key point it would resume the bear trend seen in the daily chart, and in this scenario, the $100 area might be our next stop;
• What’s more, the $123 is around the 50% Fibonacci’s Retracement in the 1h chart;
• TSLA will report earnings today, and in order to maintain the bullish bias it is important to stay above the 21 ema in the daily chart, despite any short-term correction due to volatility;
• In addition, to confirm a true bullish sign, it has to break the purple trend line seen in the daily chart, connecting the previous top levels. If TSLA fails in doing so, and triggers a top sign under this line, the situation might get ugly (again);
• I’ll keep you updated on this, as usual.
Remember to follow me to keep in touch with my daily analyses!
• The most important support level is the $123. Only if TSLA loses this key point it would resume the bear trend seen in the daily chart, and in this scenario, the $100 area might be our next stop;
• What’s more, the $123 is around the 50% Fibonacci’s Retracement in the 1h chart;
• TSLA will report earnings today, and in order to maintain the bullish bias it is important to stay above the 21 ema in the daily chart, despite any short-term correction due to volatility;
• In addition, to confirm a true bullish sign, it has to break the purple trend line seen in the daily chart, connecting the previous top levels. If TSLA fails in doing so, and triggers a top sign under this line, the situation might get ugly (again);
• I’ll keep you updated on this, as usual.
Remember to follow me to keep in touch with my daily analyses!

פרסומים קשורים
כתב ויתור
המידע והפרסומים אינם מיועדים להיות, ואינם מהווים, ייעוץ או המלצה פיננסית, השקעתית, מסחרית או מכל סוג אחר המסופקת או מאושרת על ידי TradingView. קרא עוד ב־תנאי השימוש.
כתב ויתור
המידע והפרסומים אינם מיועדים להיות, ואינם מהווים, ייעוץ או המלצה פיננסית, השקעתית, מסחרית או מכל סוג אחר המסופקת או מאושרת על ידי TradingView. קרא עוד ב־תנאי השימוש.