
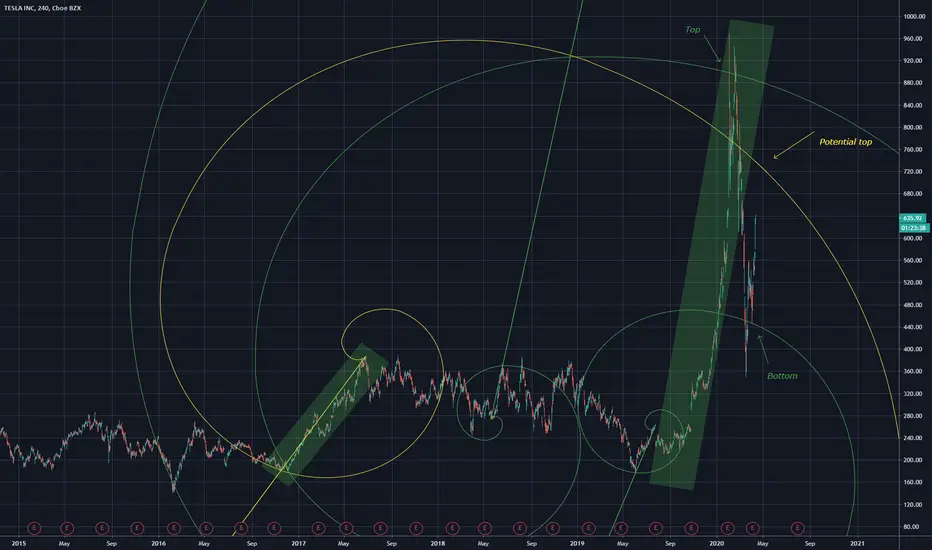
forecasting a potential top using Fibonacci spirals, and outlining how Fibonacci spirals can be used to show tops and bottoms.
For those looking to enter price is currently in a neutral zone, look for a short once the fib line is reached.
Or go long I dont really care.
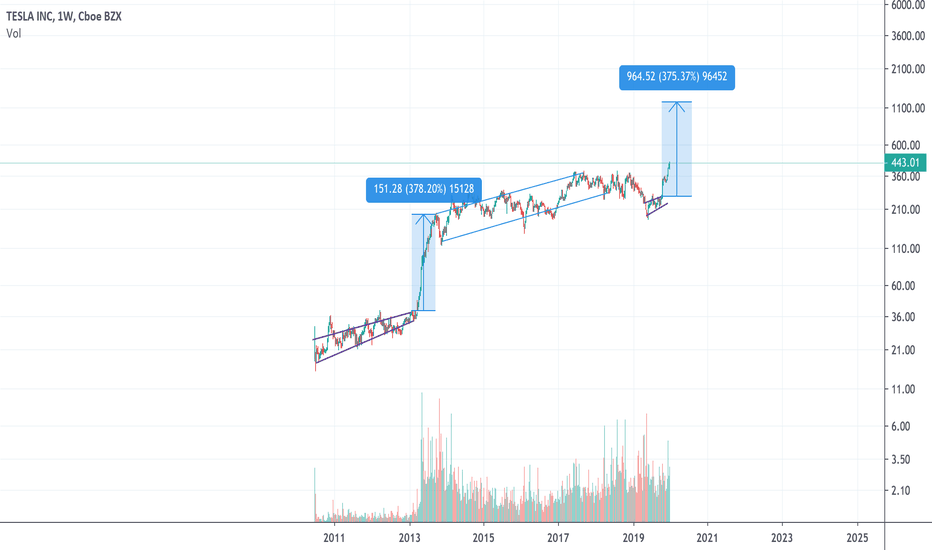
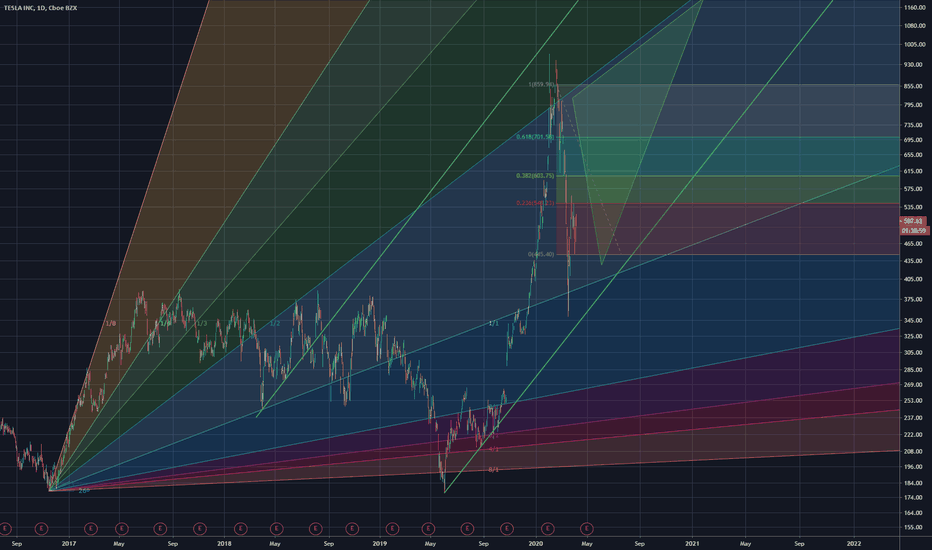
Above chart is a bit iffy, hope someone got some use out of it.
For those looking to enter price is currently in a neutral zone, look for a short once the fib line is reached.
Or go long I dont really care.
Above chart is a bit iffy, hope someone got some use out of it.

כתב ויתור
המידע והפרסומים אינם מיועדים להיות, ואינם מהווים, ייעוץ או המלצה פיננסית, השקעתית, מסחרית או מכל סוג אחר המסופקת או מאושרת על ידי TradingView. קרא עוד ב־תנאי השימוש.
כתב ויתור
המידע והפרסומים אינם מיועדים להיות, ואינם מהווים, ייעוץ או המלצה פיננסית, השקעתית, מסחרית או מכל סוג אחר המסופקת או מאושרת על ידי TradingView. קרא עוד ב־תנאי השימוש.