
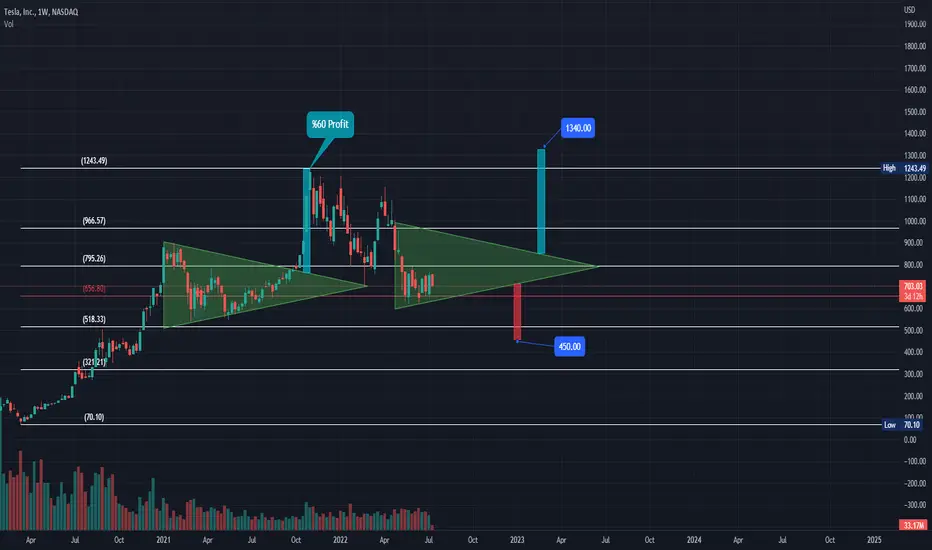
TSLA 1W Chart
-If the same triangle pattern occurs and we can see 1300-1400 in long term (Q2 2023 and later)
-As we all know recession is on the table and if FED increase rates more than expected we can find TSLA less than 500 by the end of the year.
Technical Datas
-Short term accumulation zone --> 590 - 656
-Long term Pivot --> 656 (If we see weekly candles're closed below this, we can try short, target 450)
-Support 1: 656
-Support 2: 590
-Support 3: 518
-Resistance 1: 755
-Resistance 2: 795
-Resistance 3: 966 (If we see weekly candles're closed above this level, we can expect new ATH)

TradingView Öğreniyorum bültenime ücretsiz abone olmak için: substack.com/@burakkesmeci
כתב ויתור
המידע והפרסומים אינם מיועדים להיות, ואינם מהווים, ייעוץ או המלצה פיננסית, השקעתית, מסחרית או מכל סוג אחר המסופקת או מאושרת על ידי TradingView. קרא עוד ב־תנאי השימוש.
TradingView Öğreniyorum bültenime ücretsiz abone olmak için: substack.com/@burakkesmeci
כתב ויתור
המידע והפרסומים אינם מיועדים להיות, ואינם מהווים, ייעוץ או המלצה פיננסית, השקעתית, מסחרית או מכל סוג אחר המסופקת או מאושרת על ידי TradingView. קרא עוד ב־תנאי השימוש.