
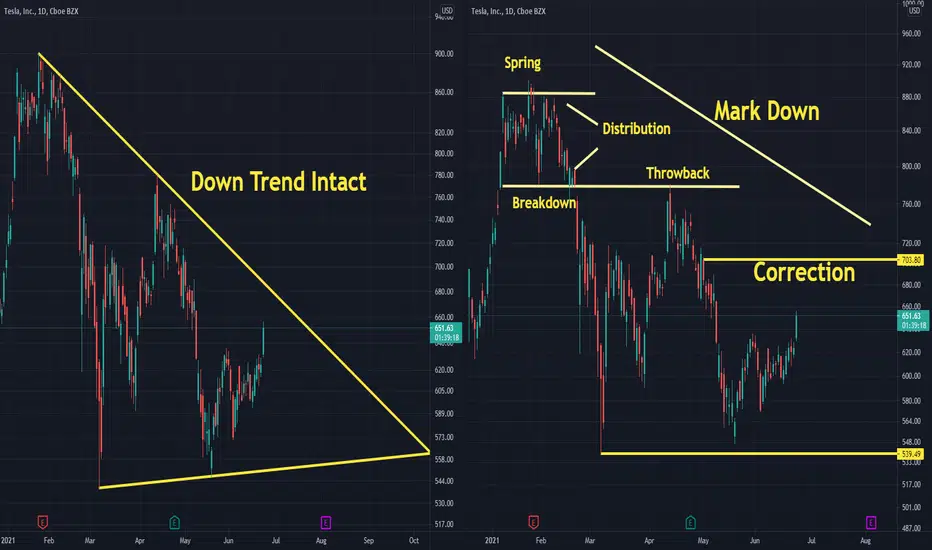
I have nothing to say, just read the article and see how many similarities exist.
I think the Tesla chart is Identical to the example chart in the article: Making Money The Wyckoff Way (CSC, DNR)
Link: https://www.investopedia.com/articles/active-trading/070715/making-money-wyckoff-way.asp
I will not surprised if tesla tests 690-700 and experience another leg down.
Moshkelgosha
I think the Tesla chart is Identical to the example chart in the article: Making Money The Wyckoff Way (CSC, DNR)
Link: https://www.investopedia.com/articles/active-trading/070715/making-money-wyckoff-way.asp
I will not surprised if tesla tests 690-700 and experience another leg down.
Moshkelgosha

Use the following link to access trading ideas: patreon.com/SniperTraderStocks?utm_medium=unknown&utm_source=join_link&utm_campaign=creatorshare_creator&utm_content=copyLink
כתב ויתור
המידע והפרסומים אינם מיועדים להיות, ואינם מהווים, ייעוץ או המלצה פיננסית, השקעתית, מסחרית או מכל סוג אחר המסופקת או מאושרת על ידי TradingView. קרא עוד ב־תנאי השימוש.
Use the following link to access trading ideas: patreon.com/SniperTraderStocks?utm_medium=unknown&utm_source=join_link&utm_campaign=creatorshare_creator&utm_content=copyLink
כתב ויתור
המידע והפרסומים אינם מיועדים להיות, ואינם מהווים, ייעוץ או המלצה פיננסית, השקעתית, מסחרית או מכל סוג אחר המסופקת או מאושרת על ידי TradingView. קרא עוד ב־תנאי השימוש.