AUD/JPY – Bullish Cup & HandleAUD/JPY is showing signs of a potential bullish reversal following an extended bearish trend. On the 1-hour timeframe, price has developed a well-defined Cup & Handle pattern, supported by bullish RSI divergence and a Fibonacci retracement setup.
The cup formation begins at Point A, where price established a significant swing low near 109.70 before gradually recovering towards Point B around 112.60, completing the rounded bottom structure.
Following the recovery, price encountered resistance at the neckline and started retracing, forming the handle of the pattern.
1. Fibonacci Retracement & Handle Formation
After reaching Point B, price experienced a sharp rejection from the neckline and retraced towards the 0.382 Fibonacci level, around 111.50.
The current price action suggests that buyers are attempting to defend this retracement area, with price recovering towards 111.80.
The Fibonacci retracement zone between 0.382 and 0.5, approximately 111.50–111.15, represents a potential support area for the handle formation.
As long as price maintains support within this region, the bullish continuation scenario remains technically viable.
2. RSI Divergence & Momentum Confirmation
The RSI previously developed a bullish divergence near the bottom of the cup, where price formed lower lows while RSI established higher lows, indicating weakening bearish momentum.
This divergence supported the subsequent recovery towards the neckline.
However, RSI also displayed a bearish divergence near Point B, where price pushed towards the neckline while RSI formed a lower high. This signaled weakening bullish momentum and contributed to the current retracement.
The RSI has now recovered towards the neutral 50 level, suggesting that selling pressure may be easing.
A sustained recovery above 50, followed by a move towards 60, would provide additional confirmation of improving bullish momentum.
3. Entry Strategy & Bullish Confirmation
Primary entry – Handle support
I am monitoring the 111.50–111.15 Fibonacci support zone for a potential bullish reversal.
A bullish rejection candle, higher low, or bullish engulfing formation within this region could provide an early entry opportunity.
Conservative entry – Neckline breakout
For stronger confirmation, I will wait for a decisive hourly candle close above the neckline resistance around 112.60.
A successful breakout followed by a retest of the neckline as support would strengthen the bullish continuation scenario and confirm the Cup & Handle pattern.
4. Profit Targets & Risk Management
My projected bullish targets are:
TP1: 113.12 – Initial resistance.
TP2: 114.23 – Lower boundary of the major resistance zone.
TP3: 114.90 – Upper resistance and projected pattern target.
The projected move towards 114.90 is based on the measured move of the Cup & Handle formation, extending the approximate depth of the cup above the neckline.
A sustained breakdown below the handle support would weaken the immediate bullish setup. A protective stop-loss should be positioned according to the selected entry, the confirmed handle low, and the trader's risk tolerance.
The key is to wait for bullish confirmation rather than anticipate the breakout.
#AUDJPY #CupAndHandle #ForexTrading #TechnicalAnalysis #Fibonacci #RSIDivergence #BullishSetup #PriceAction #TradingView #Sarmaaya.pk
NZD/USD Official Trading PlanNZD/USD Official Trading Plan
1. Trading Instrument
Trading Instrument: NZD/USD
2. Analysis Timeframe
Analysis Timeframe: 2H Band Trading
3. Entry Level
Go long near the market price at 0.57541
4. Stop Loss Level
Full position stop loss placed at 0.57380.
Strictly execute stop loss once the price breaks the stop loss level, no holding and no subjective adjustment. This trade is configured with a fixed risk-reward ratio of 1:16.
5. Take Profit & Risk Protection Rules
1. First Target: 0.58270
Reduce half of the position, move stop loss forward to lock floating profits and protect remaining positions.
2. Second Target: 0.58950
Reduce half of the remaining positions again, continue to push up stop loss to further expand profit protection range.
3. Third Target: 0.5988880
Reduce half of the remaining positions, push stop loss again to fully secure trading profits.
Leave the last tail position to run with the trend and dynamically adjust protection according to real-time price movement.
6. Position Sizing
Trade with a fixed 1:16 risk-reward ratio for band trading. Control single trade risk within a reasonable range, prohibit over-sizing and averaging down against the trend. All position calculations strictly comply with the preset high reward trading structure.
7. Trading Cycle
2H cycle band trading. Hold positions according to trend structure, close partial positions step by step at each target level, and retain tail positions to capture further trend extension opportunities.
8. Risk Transaction Reminder
Foreign exchange markets are affected by international capital flows, macroeconomic data, interest rate expectations and global risk sentiment, with uncertain intraday volatility and sudden trend reversals. 2H band trading has medium holding cycle risk, and price gap and slippage may occur in extreme market conditions, which will affect the actual execution of stop loss and take profit. This trade adopts a high 1:16 risk-reward strategy, which requires stricter execution discipline. Graded position reduction and stop loss pushing can effectively control risks, but cannot completely eliminate market uncertainty. All position adjustment operations must be executed strictly in accordance with the pre-set plan, and impulsive temporary position opening and position adjustment are prohibited.
Professional Disclaimer
All financial transactions involve huge risks such as price fluctuations, liquidity imbalance and sudden market reversals. The foreign exchange market trades continuously with high uncertainty, and slippage often occurs in stop-loss and take-profit execution. Leveraged trading amplifies both returns and risks, and may cause partial or total loss of principal. This trading plan is only for personal strategy reference and does not constitute any investment invitation or financial advice. All opening, closing and risk control decisions are independently executed by the trader, and all profit and loss consequences shall be borne solely by the trader.
AUD/USD Official Trading PlanAUD/USD Official Trading Plan
1. Trading Instrument
Trading Instrument: AUD/USD
2. Analysis Timeframe
Analysis Timeframe: 2H Band Trading
3. Entry Level
Go long near the market price at 0.771275
4. Stop Loss Level
Full position stop loss placed at 0.71180.
Strictly execute stop loss once the price breaks the stop loss level, no holding and no subjective adjustment.
5. Take Profit & Risk Protection Rules
1. First Target: 0.71700
Reduce half of the position, move stop loss forward to lock floating profits and protect remaining positions.
2. Second Target: 0.72000
Reduce partial positions again, continue to push up stop loss to further expand profit protection range.
3. Third Target: 0.723390
Reduce half of the remaining positions, push stop loss again to fully secure trading profits.
Leave the last tail position to run with the trend and dynamically adjust protection according to real-time price movement.
6. Position Sizing
Trade with fixed band trading risk ratio. Control single trade risk within a reasonable range, prohibit over-sizing and averaging down against the trend.
7. Trading Cycle
2H cycle band trading. Hold positions according to trend structure, close positions partially at each target level, and hold tail positions for trend extension opportunities.
8. Risk Transaction Reminder
Foreign exchange markets are affected by international capital flows, macroeconomic data, interest rate expectations and global risk sentiment, with uncertain intraday volatility and sudden trend reversals. 2H band trading has medium holding cycle risk, and price gap and slippage may occur in extreme market conditions, which will affect the actual execution of stop loss and take profit. Graded position reduction and stop loss pushing can effectively control risks, but cannot completely eliminate market uncertainty. All position adjustment operations must be executed strictly in accordance with the pre-set plan, and impulsive temporary position opening and position adjustment are prohibited.
Professional Disclaimer
All financial transactions involve huge risks such as price fluctuations, liquidity imbalance and sudden market reversals. The foreign exchange market trades continuously with high uncertainty, and slippage often occurs in stop-loss and take-profit execution. Leveraged trading amplifies both returns and risks, and may cause partial or total loss of principal. This trading plan is only for personal strategy reference and does not constitute any investment invitation or financial advice. All opening, closing and risk control decisions are independently executed by the trader, and all profit and loss consequences shall be borne solely by the trader.
 Long
Long
Long 
GOLD H4 — Stay Neutral!After several bullish weeks, gold is now making a correction. At the current level, it is better to stay neutral because the market is not in a good position for either buying or selling. However, I believe the buy side has better potential.
For a short trade, it may be better to wait for Wave c of B to complete, possibly around $4,600. After that, another Wave C should complete the ABC correction.
If the ABC correction finishes around $4,250, there may be a good opportunity to look for buy positions, with the potential for much higher targets.
[MRVL] ABCD Harmonic Pattern forming for Bullish ProjectionFUNDAMENTAL ANALYSIS
1. The Sales and Cash flow are increasing but there was a slight decrease in NET-INCOME from last fiscal year. MRVL's net income dropped due to one-time items below operating income—a large prior-quarter gain and a financing charge—not business weakness. Core fundamentals (revenue +30%, strong cash flow, low debt, good ROE) are positive; valuation (P/E 75, P/S 21) and volatility are negative.
2. On Seasonality charts the major bullish move in MRVL starts after October. Hence better to wait in entering the trade. Hence BUY LIMIT ORDER would be more suitable.
3. Qualitative score is 5/10, The company shows meaningful strengths in technical defensibility, innovation intensity, resilience, customer relevance, and future growth exposure, especially through AI infrastructure and data-center demand. However, the score is limited by weaker evidence of recurring revenue, unclear succession visibility, uncertain employee-retention strength, limited pricing-power confirmation, and uneven profitability over recent years. Overall assessment: Moderate-quality business with strong growth potential, but not yet a fully durable or predictable compounder on qualitative grounds.
TECHNICAL ANALYSIS
1. After making HH at 329, price retaced down to 170, reaching the FIB level of 61.80%. After that price is somewhat bullish to sideways around the FIB level of 38.2%. This is not a strong Buy Signal
2. Although on Daily TF, an ABCD harmonic pattern is getting formed, hinting an upside. Hence careful BUY STOP entry would be advised, once a solid bullish breakout noticed. So as per Seasonality, this breakout might happen in Oct 2026
3. A bullish flag is also observed on on 4H, also hinting bullish movement in future.
CONCLUSION
1. Fundamentally strong company riding the AI wave
2. Technically at a tricky spot and careful BUY STOP entry is recommended.
TRADE PLAN
1. Pull Catch: BUY STOP @ 160 (SL@ 200, TP1@320 R:R 1:1, TP2@380 R:R1:2)
2. Last HH Break: BUY STOP @ 340 (SL@ 265, TP1@415 R:R 1:1, TP2@490 R:R1:2)  Long
Long
#USDCAD: Big Bullish Move Has Started! Get Ready 🔺The directional bias for USDCAD is fully bullish. The current decline from 1.42595 is viewed as a corrective retracement into a higher-timeframe buying zone, rather than the beginning of a sustained bearish trend.
🔺Price is trading near 1.38365 and gradually approaching the planned entry region at 1.37321. This area sits at the upper boundary of the broader 1.35363–1.37321 demand zone, where buyers may begin rebuilding positions for the next expansion higher.
Bullish Market Structure
🔺USDCAD previously produced a strong rally from its discounted price region, confirming that demand remains present at lower levels. That bullish expansion carried price into the 1.42595 premium zone, where profit-taking and selling pressure created the current pullback.
🔺Although price has formed short-term lower highs beneath the descending trend line, this movement is delivering the market back toward a more favourable buying location. The correction therefore supports the bullish setup by improving the potential risk-to-reward ratio.
Preferred Buying Area
🔺The primary entry level is positioned around 1.37321, with the complete buying zone extending down to 1.35363.
Traders should monitor this region for evidence that the correction is ending, including:
• Strong rejection candles or long lower wicks
• A bullish engulfing formation
• A lower-timeframe Change of Character (CHoCH)
• A bullish Break of Structure (BOS)
• A break and successful retest of the descending trend line
🔺These confirmations would indicate that buyers are returning and that bullish momentum is beginning to rebuild.
Bullish Targets
If price responds positively from the buying zone, the following upside objectives become relevant:
1. 1.4000 — initial psychological resistance and a possible partial-profit area
2. 1.42595 — first main target and previous premium selling zone
3. 1.48030 — second target and the broader buy-side liquidity objective
🔺The first major challenge will be 1.42595. Price may consolidate or retrace from this level before continuing toward 1.48030, as illustrated by the projected path on the chart.
🔺A decisive breakout and successful retest of 1.42595 would strengthen the case for the second bullish expansion.
Invalidation
🔺The bullish setup remains valid while the 1.35363–1.37321 buying zone is respected.
🔺A sustained 3-day close below 1.35363 would invalidate the planned entry structure. This level should therefore be treated as the technical exit point rather than an area for repeatedly adding to a losing position.
🔺A temporary liquidity wick below the zone may occur, so confirmation from the candle close is more meaningful than an intraday price spike.
LIKE AND COMMENT❤️
THE SETUPSFX_ TEAM❤️🇬🇧
ALAB – Is the Next Leg of the Rally About to Begin?Presenting another high-probability chart story.
Some stocks don't spend months building a base—they simply explode higher, correct sharply, and resume the trend. ALAB is starting to look like one of them.
After an explosive A→B impulsive rally, the stock entered a swift correction, retracing almost perfectly into a high-confluence support zone.
Now, buyers appear to be stepping back in.
What stands out?
✅ V-shaped correction back into the previous breakout zone.
✅ Successful breakout retest, with the prior resistance acting as new support.
✅ The correction filled the nearby price gap, removing unfinished business.
✅ Price found support at the 200 EMA, a level institutions often defend during strong uptrends.
✅ The retracement reached the Fibonacci Golden Pocket (0.5–0.618), adding another layer of confluence.
This is exactly the type of pullback trend traders often wait for after a parabolic move.
Is an AB=CD Pattern Developing?
One pattern worth watching is a potential AB=CD harmonic continuation.
If the current rebound develops into a new impulse leg similar in magnitude to the first rally, the projections become very interesting:
🎯 First objective: around $500
🚀 Extended AB=CD projection: near $650
These aren't guarantees—they are measured projections that become increasingly relevant only if buyers reclaim momentum and continue printing higher highs.
Bullish Scenario
As long as ALAB continues holding above the breakout retest zone and the 200 EMA, the current pullback looks more like a healthy reset within a strong primary uptrend than the beginning of a trend reversal.
Invalidation
A decisive daily close below the retest zone would weaken the bullish structure and suggest that the correction is not yet complete.
Every chart tells a story.
This one looks like a fast train making a scheduled stop. The explosive first leg is complete, the breakout has been retested, the gap has been filled, and multiple support factors are converging in the same area.
Now the question is:
Is the next AB=CD leg already departed? 🚄📈  Long
Long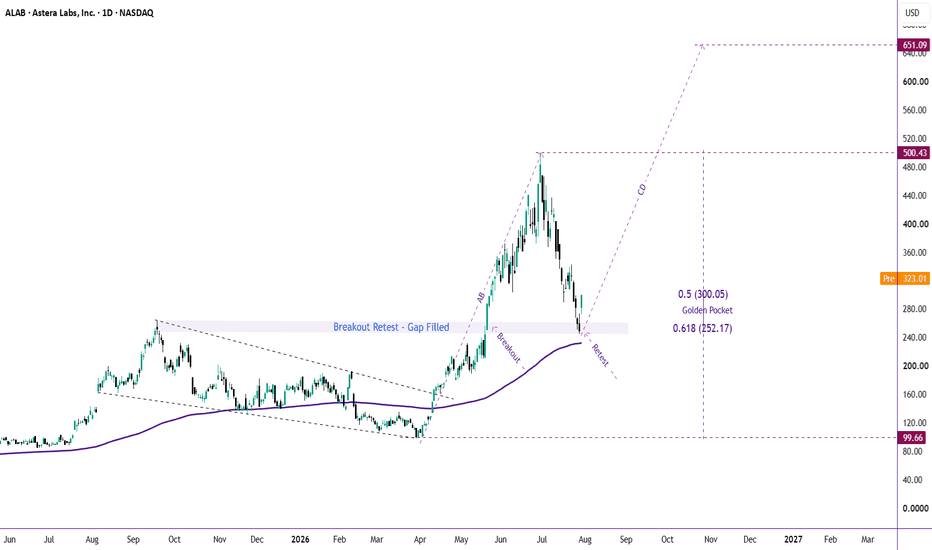
Divergence Confirmed at the Lows — The Road to $100K BeginsBitcoin printed a clear bullish divergence at the $57,000–$67,000 lows on both the Daily and Weekly timeframes — a strong signal that selling pressure was exhausting and a structural shift was underway.
Following this divergence, price broke higher with strong momentum, now setting its sights on the liquidity resting above $97,000 and the psychological round-number target at $100,000.
📍 Near-term expectation: before continuation, a corrective pullback into the $70,000–$75,000 zone is likely — a healthy retracement to rebalance the move.
📍 If confirmation signals appear in that zone (rejection wicks, bullish structure shift, momentum shift on lower timeframes), the stage is set for a bullish AB=CD continuation pattern, projecting the next leg toward the $97K–$100K liquidity zone.
Bias remains bullish as long as the $70K–$75K zone holds as support. A break below would invalidate this structure and call for reassessment.
⚠️ Shared for educational purposes only — not financial advice.
 Long
Long
ENA(Ethena): Textbook Fibonacci Retracement & Clean SetupThe technical structure on CRYPTOCAP:ENA is aligning perfectly with a massive shift in fundamental tokenomics announced today, August 27, 2026. We just saw a textbook pullback and defense of a key Fibonacci level, and the structural setup for a macro expansion toward the $0.20 zone is flashing green.
The Fundamental Catalysts: Buybacks, IP Transfer & Eliminated VC Overhang
Technical setups need fuel, and the Ethena Foundation just provided a massive supply shock. Today, they announced a four-part ecosystem overhaul designed to cut selling pressure and directly return value to token holders:
VC Buyouts: The Ethena Foundation completely bought out all locked ENA tokens from major seed investors who had been selling over the past nine months.
Protocol Fee Switch: A governance proposal is now live, and has been approved by the risk committee, to activate a fee switch. This mechanism will take net revenues from Ethena's business lines and use them for programmatic ENA token buybacks directly from the market.
Eliminating Monthly VC Unlocks: To eliminate future supply overhang, the Foundation and lead investors agreed to release unvested tokens, putting an end to the monthly VC token-unlock schedule. Core team tokens will remain locked under their original vesting schedules.
Value Alignment & IP Transfer: A Master Framework Agreement transferred all protocol intellectual property and economic value exclusively to the Ethena Foundation, which is governed by ENA holders. Equity investors in Ethena Labs will no longer receive residual cash flows from the protocol.
They are systematically removing future sell pressure while introducing automated buy pressure. When you combine this fundamental shift with a perfect technical bounce, you get the aggressive expansion we are seeing right now.
The Technical Execution: Golden Fib & Dynamic Support
Looking at the 1-hour chart, the mechanics of this move are incredibly clean:
The Parabolic Expansion & Reset: We saw an aggressive rally from the $0.086 floor up to $0.183. After a vertical move, a structural reset is required to flush out late retail longs.
The Fibonacci Defense: The price retraced exactly into the deep golden Fib pocket between $0.135 and $0.140. Notice how this landed perfectly on top of the dynamic blue moving average line, establishing a reinforced floor.
The Reversal: Buyers stepped in exactly where they were supposed to. We caught a V-shape recovery, breaking back through $0.160 local resistance. The sellers are exhausted, and the market structure has shifted back to the upside.
The Game Plan: Pyramiding the Upside
We do not chase green candles blindly; we trade the structure.
1. The Targets: The immediate target is a retest of the local high at $0.183. If we break and close above that liquidity pool, the next macro objective is the psychological $0.200 level.
2. LTF Execution: If you missed the $0.138 Fib bounce, do not FOMO into resistance. Drop down to the 5-minute chart. Wait for the price to consolidate and establish a higher low (ideally defending the $0.160 - $0.165 zone). Look for a clean 2-bar streak of bullish confirmation on the 5-minute to validate your entry.
3. Risk Management: Your invalidation level is crystal clear. If we lose the Fibonacci swing low at $0.135, the thesis is dead. Keep stop losses tight and scale into the position as the trend validates itself.
Are you already positioned from the $0.138 bounce, or waiting for the $0.183 breakout to add size? Let me know your execution plan in the comments below! 👇
Disclaimer: This analysis is for educational purposes for the finance trading community. It is not financial advice. Always trade your own plan and manage your risk strictly.  Long
Long
 Long
Long
Short 
BTC/USD approaching key resistanceFor those who read my previous post, you may recall that I highlighted the following:
As shown in the chart below, BTC/USD has been capped under the 50-day SMA at US$64,917 since 21 July, supported by a resistance zone between US$67,396 and US$65,693. This follows the breakout beyond the upper boundary of a falling wedge, drawn from the high of US$67,255 .
The reaction to the said SMA/resistance indicates that buyers could soon step in and attempt to find acceptance above the noted area. If this materialises, the door potentially opens for a run to resistance at 74,178 .
With the above in mind, despite a period of back and forth around the 50-day SMA – which is now actually trading around US$63,755 – the pair has caught a strong tailwind on the back of US Treasury Secretary Scott Bessent’s bond intervention announcement. Resistance at US$67,396-65,693 has been cleared, with room for buyers to continue stretching their legs until resistance at US$74,178 and the 200-day SMA at US$74,917. Also bolstering this resistance area is an ‘alternate’ AB=CD resistance pattern derived from the 1.272% Fibonacci projection at US$73,774 and a 61.8% Fibonacci retracement at US$73,319.
Written by FP Markets Chief Market Analyst Aaron Hill Short 
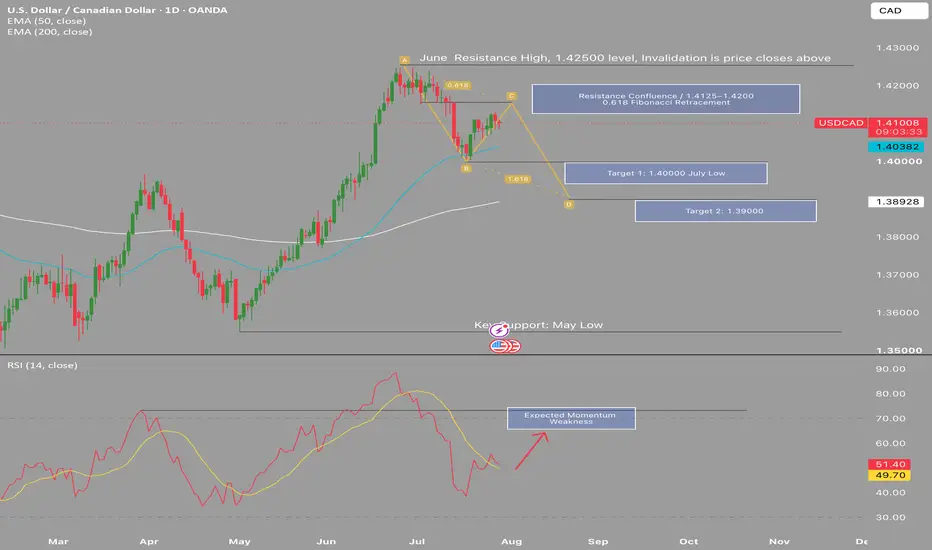
USDCAD- Resistance Confluence Signals Potential Bearish ReversalUSDCAD is approaching a significant technical inflection point following a corrective rally into a high-confluence resistance zone between 1.4125 and 1.4200. This area combines the June resistance high, the 61.8% Fibonacci retracement of the recent decline, and the projected completion of an ABCD harmonic pattern, creating a technically compelling area for sellers to regain control. Despite the recent recovery, price continues to trade below the 1.4250 June swing high, which remains the key invalidation level, with a sustained daily close above this resistance suggesting that bullish momentum has resumed. Should price reject from this confluence zone, initial downside objectives remain the psychological 1.4000 level and the July swing low, followed by 1.3900, where the 200-day EMA provides additional dynamic support and technical confluence. Momentum has also begun to recover following the recent rally, although I will be monitoring for expected momentum weakness and bearish price action before considering short exposure, as this remains a forecast rather than a confirmed reversal.
From a fundamental perspective, this outlook is supported by the potential for relative Canadian dollar strength should the current macroeconomic environment continue to favour CAD over USD. Softer US inflation, weaker labour market data, or a more accommodative Federal Reserve could reduce support for the US dollar, while resilient Canadian economic data, a comparatively hawkish Bank of Canada, and stronger crude oil prices may continue to underpin demand for the Canadian dollar. Market participants should also remain attentive to upcoming Federal Reserve and Bank of Canada policy decisions, inflation releases, employment reports, and developments in the energy market, as these events are likely to influence the next directional move. While price action will ultimately determine whether this scenario develops, the current combination of technical confluence and macroeconomic factors presents a compelling case for a bearish continuation should resistance between 1.4125 and 1.4200 be successfully defended.
USDCAD is approaching a significant technical inflection point following a corrective rally into a high-confluence resistance zone between 1.4125 and 1.4200. This area combines the June resistance high, the 61.8% Fibonacci retracement of the recent decline, and the projected completion of an ABCD harmonic pattern, creating a technically compelling area for sellers to regain control. Despite the recent recovery, price continues to trade below the 1.4250 June swing high, which remains the key invalidation level, with a sustained daily close above this resistance suggesting that bullish momentum has resumed. Should price reject from this confluence zone, initial downside objectives remain the psychological 1.4000 level and the July swing low, followed by 1.3900, where the 200-day EMA provides additional dynamic support and technical confluence. Momentum has also begun to recover following the recent rally, although I will be monitoring for expected momentum weakness and bearish price action before considering short exposure, as this remains a forecast rather than a confirmed reversal.
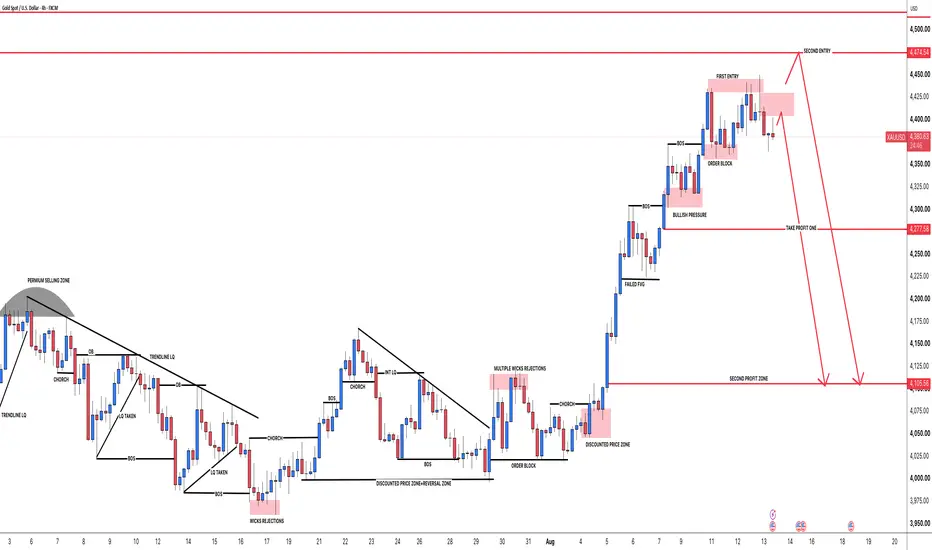
From a fundamental perspective, this outlook is supported by the potential for relative Canadian dollar strength should the current macroeconomic environment continue to favour CAD over USD. Softer US inflation, weaker labour market data, or a more accommodative Federal Reserve could reduce support for the US dollar, while resilient Canadian economic data, a comparatively hawkish Bank of Canada, and stronger crude oil prices may continue to underpin demand for the Canadian dollar. Market participants should also remain attentive to upcoming Federal Reserve and Bank of Canada policy decisions, inflation releases, employment reports, and developments in the energy market, as these events are likely to influence the next directional move. While price action will ultimately determine whether this scenario develops, the current combination of technical confluence and macroeconomic factors presents a compelling case for a bearish continuation should resistance between 1.4125 and 1.4200 be successfully defended. #XAUUSD: Sellers Pressure Has Increased Possible +3000 Pips Move📌The price of gold (XAUUSD) has experienced a significant bullish expansion from the discounted-price region below 4,100. This advance developed through a sequence of liquidity events: sell-side liquidity was collected, bullish CHOCH and BOS formations occurred, demand and order blocks were respected and a previously bearish fair value gap failed.
📌The failed fair value gap acted as an inversion signal and was followed by strong displacement through the 4,300 and 4,370 structure levels. The completed leg into the current highs was therefore structurally bullish.
📌However, the price location has now changed. At 4,391.50, gold is no longer trading in discount. It is positioned in the premium portion of the active 4H dealing range after a highly imbalanced rally. Price is now approaching stacked supply and buy-side liquidity, creating the conditions for distribution and bearish repricing provided lower-timeframe order flow confirms the reversal.
I📌mportantly, the 4H chart has not yet produced a fully confirmed bearish market structure shift. Therefore, this is a conditional short setup from premium, not a blind market sell.
Market Structure and Liquidity Narrative
The earlier sections of the chart repeatedly demonstrate the same institutional delivery:
🔺Liquidity forms around swing highs, equal lows or trendline liquidity.
🔺Price raids that liquidity.
🔺A CHOCH or market structure shift develops.
🔺Displacement then carries price towards the opposite side of the range.
The late-July rejection from approximately 3,960–4,000 was the most important recent example. Sell-side liquidity was collected before price reversed and broke several external highs.
The August expansion subsequently printed consecutive bullish BOS signals. The bullish order block around 4,355–4,372 and the earlier bullish-pressure zone around 4,302–4,324 remain important structural footprints from that move.
A decisive break below the 4,355–4,372 order block would be the first significant evidence that bullish delivery is failing. A subsequent retest of that broken order block as resistance could transform it into a bearish breaker and strengthen the downside thesis.
Premium Zones and Entry Models
The latest rally has delivered price into a premium array containing several layers of supply.
Near-term mitigation zone: 4,404–4,429
🔺This is the lower supply area used by the chart’s shorter projected path. A corrective bounce into this zone could mitigate newly created bearish supply before price begins moving towards the downside objectives.
First-entry zone: 4,430–4,445
🔺This is the primary premium selling zone marked on the chart. Price has already traded into this area and produced an initial rejection. Recent highs within and above the zone hold buy-side liquidity, meaning another test could first sweep stops before a bearish move develops.
Second-entry level: 4,474.54
🔺If price ignores the first rejection and runs above the current highs, the chart allows for a deeper manipulation towards 4,474.54.
🔺This would represent an ICT-style liquidity raid: price takes external buy-side liquidity, attracts breakout buyers, stops out early sellers and trades deeper into premium before reversing.
🔺A touch of 4,474.54 is not sufficient confirmation by itself. The setup requires rejection, bearish displacement and a lower-timeframe market structure shift after liquidity has been taken.
Confirmation-Based Execution
The preferred execution model is on the 15-minute or 1-hour timeframe:
🔺Allow price to enter 4,404–4,429, 4,430–4,445 or the deeper 4,474.54 liquidity level.
🔺Look for a sweep of a recent high or equal highs.
🔺Require bearish displacement through the nearest protected intraday low.
🔺Confirm a bearish CHOCH or MSS.
🔺Ideally, the displacement should leave a clean bearish FVG.
🔺Use the retracement into that FVG, bearish order block or breaker as the entry rather than chasing the initial move.
🔺Prioritise confirmation during the London or New York liquidity window.
If the price falls through 4,355–4,372 without first retracing into premium, the safer approach is to wait for the broken bullish order block to be retested as resistance. Selling after a large bearish expansion would result in a poor entry point.
Downside Objectives
Take Profit One: 4,277.58
This is the first major rebalance area marked on the chart. It is located near the origin of the later bullish displacement and represents the logical first objective once the bullish order block fails. Partial profit may be considered here while retaining reduced exposure towards the second target.
Second Profit Zone: 4,105.56
This is the larger external draw on liquidity. It aligns with:
🔺The previous range-high region.
🔺The multiple-wick-rejection area.
🔺The base of the August breakout.
🔺The origin of the major bullish imbalance.
A move into 4,105.56 would complete the broader bearish repricing projected by both paths on the chart.
Bearish Scenarios
Primary Scenario
🔺Price retraces into 4,404–4,429 or retests the 4,430–4,445 premium zone. Buy-side liquidity is depleted, a bearish displacement confirms an MSS and the price breaks the 4,355–4,372 bullish order block.
This would expose 4,277.58 first, followed by 4,105.56.
Secondary-Entry Scenario
🔺Price expands through the recent highs and raids liquidity at 4,474.54. A bearish displacement and MSS from that level would provide the higher-premium entry shown on the chart.
The downside objectives remain 4,277.58 and 4,105.56.
This is our comprehensive chart analysis. If you find it helpful and informative please let us know in the comments. We wish you a happy trading week and weekend. Good luck and trade safely!
The SetupsFX_ Team❤️  Short
Short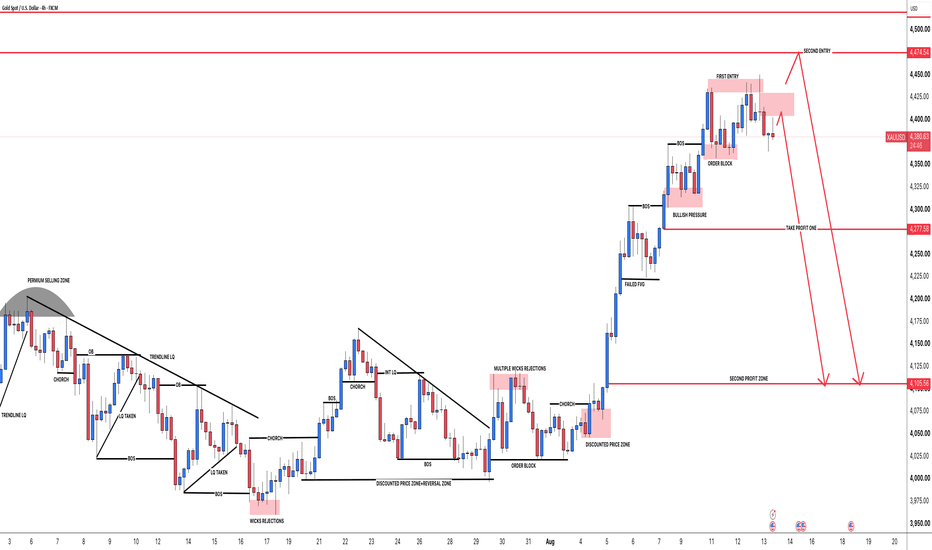
 Short
Short
 Long
Long
XAUUSD (Gold) Setup: Pullback to Trendline Support & Bullish RebOverview:
Gold (CFDs on Gold, 2-hour timeframe) is undergoing a corrective pullback following a strong impulsive expansion. Price is currently approaching the rising trendline support and local moving average structure, setting up for a potential bullish continuation move.
Key Technical Highlights:
Support & Trendline Confluence: Price is retracing toward the ascending trendline support and the moving average ribbon near 4,381, holding above the major structural base.
Structural Objectives:
Target 1: Overhead resistance zone near 4,450 - 4,500
Trading Plan / Setup:
Bias: Bullish (Buy / Long)
Entry Zone: Around the trendline support / current retracement area (~4,381)
Stop Loss (SL / Invalidation): Placed strictly below structural trendline support (~4,250 - 4,275 region)
Take Profit (TP): Scaled upward toward the resistance zone near 4,450 - 4,500
Educational Disclaimer: This analysis is published for educational and informational purposes only and should not be construed as professional financial or investment advice. Trading CFDs and commodities involves substantial risk of loss and is not suitable for every investor. Always perform your own due diligence and manage your risk accordingly before executing any trades. Short 
Short 

 Long
Long