Bat
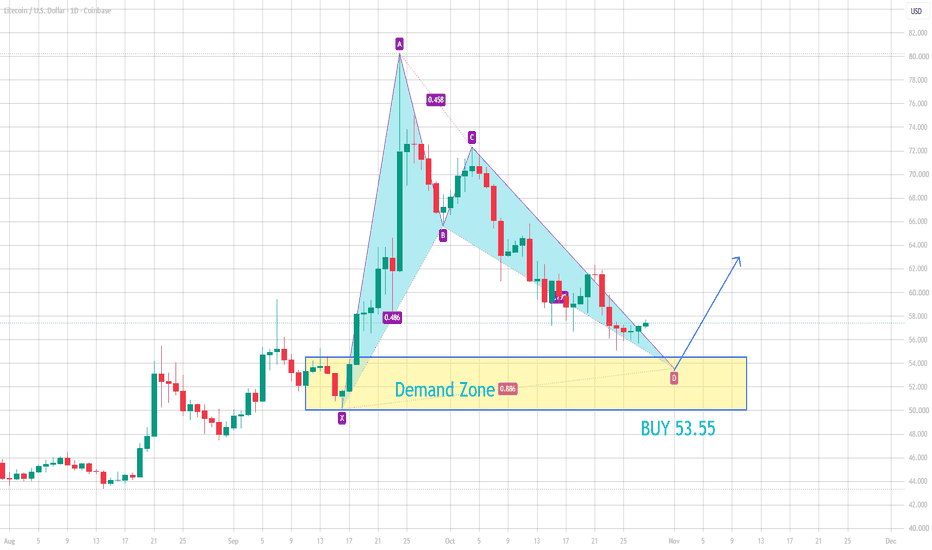
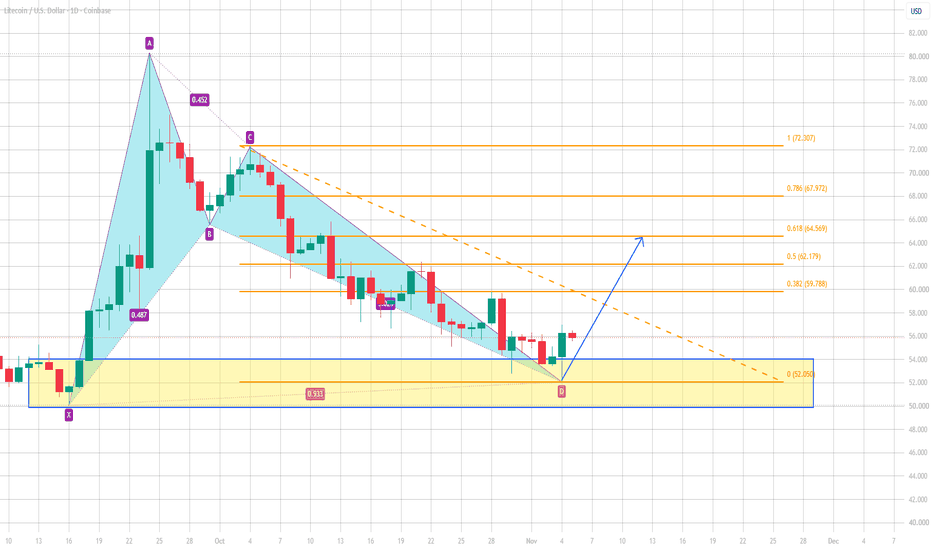
LTCUSD BUY 55.10On the daily chart, LTCUSD has stabilized after testing a previous demand zone, with the short-term price action forming a bullish "Bat" pattern. Traders may look to the support area near 55.10; if the price pulls back and stabilizes there, long positions could be considered, with an upside target near 64.57.
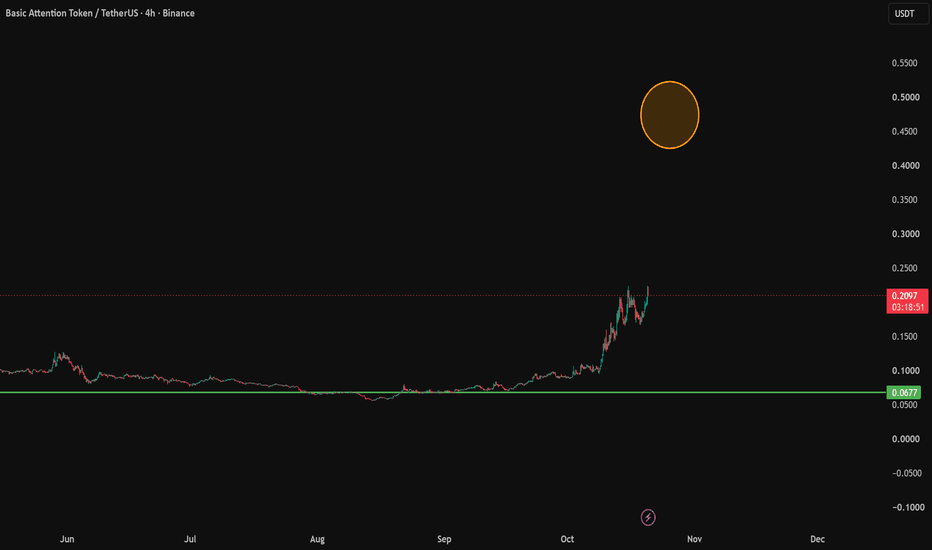
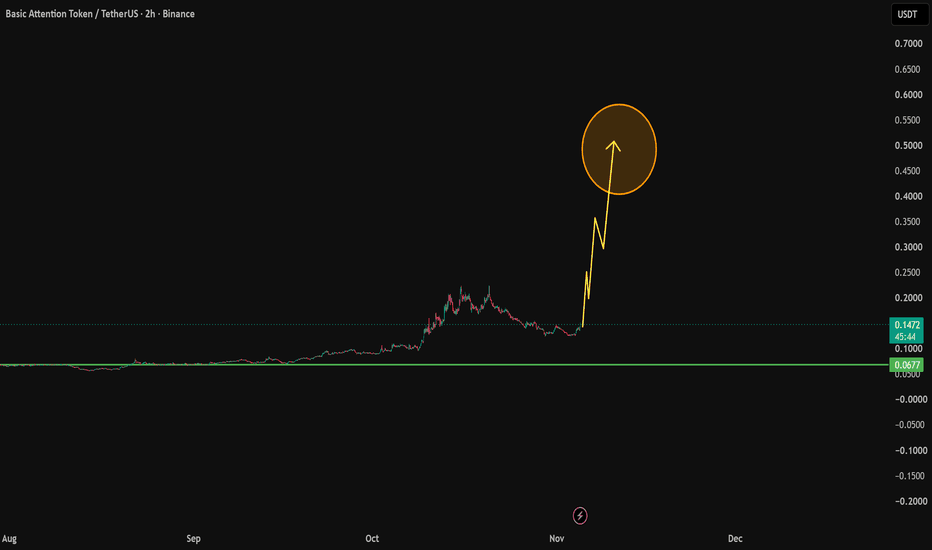
THE KNOWN WHALE TOKEN BAT:USDT IS READY FOR RETURN.. $0,40+it can take some time, but there is huge chance BAT:USDT is going to breakout.
This token is known as the whale building token, and as there is data showing with high possiblity a return of building volume, can this token enter into new increase view.
we will follow and see if this BAT:USDT is going to renew.
We follow the daily first signal of volume setup, which can confirm later into real swing trend.
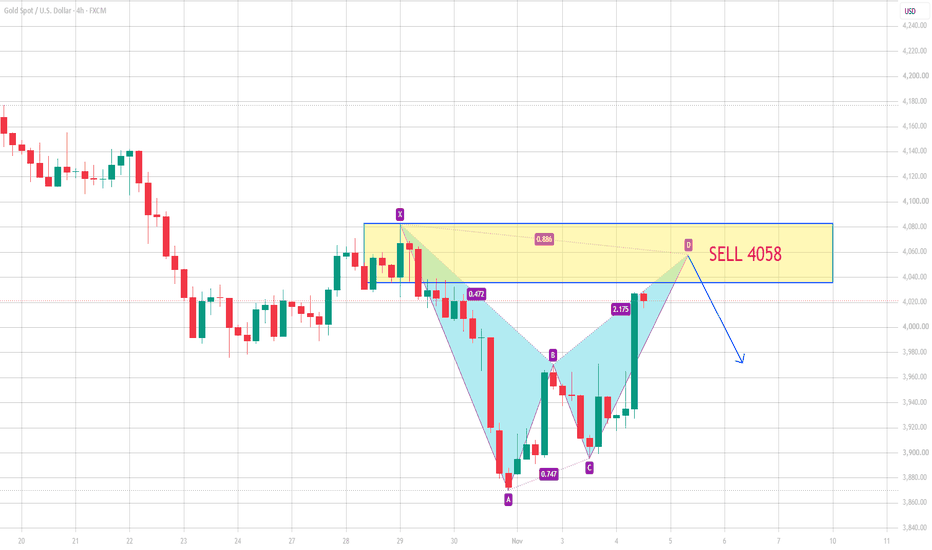
XAUUSD SELL 4058On the 4-hour chart, gold has stabilized from its lows. In the short term, focus on the area around 4058, which serves as a potential entry point for a short position based on a bearish "Bat" pattern; this level also coincides with a previous supply zone. Should the price break above the resistance near 4082, a bullish trend is likely to emerge.
NZDUSD SELL 0.5695On the 4-hour chart, NZD/USD has shown signs of stabilization and a rebound in the short term. Attention should be focused on the area near 0.5695, which serves as a potential entry point for a short position based on a bearish "Bat" pattern; this level also coincides with a previous supply zone.
XAGUSD bullish BatXAGUSD (4H) – Bullish Harmonic Reversal Watch
Silver has completed a deep bullish harmonic structure near the 0.967 XA retracement, extending beyond the standard Bat completion level.
Price initially reacted from the PRZ but failed to sustain the recovery, breaking below the 56.60 support zone and continuing toward lower structural support. Meanwhile, RSI is developing bullish divergence, suggesting weakening selling momentum.
With price trading below the primary high-volume acceptance regi
EURUSD - Bullish BatEURUSD is completing a Bullish Bat harmonic pattern near the ideal 0.886 XA retracement, with the D-point aligning with a key demand zone around 1.1130–1.1150.
Price has reacted slightly from the PRZ following an extended bearish move, while RSI is recovering from oversold territory, suggesting potential selling exhaustion.
The volume profile shows price trading below the primary volume acceptance region, creating an opportunity for a bullish rotation back toward value if buyers successfully
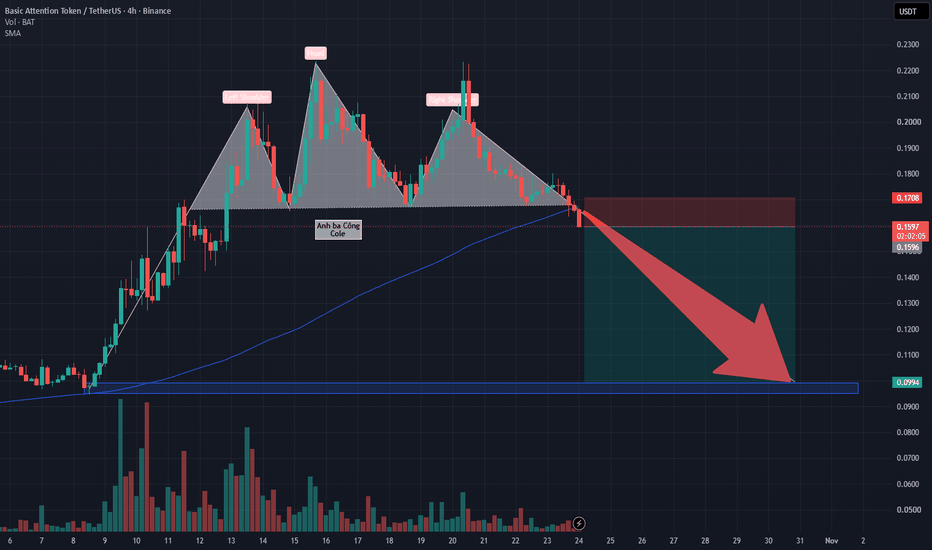
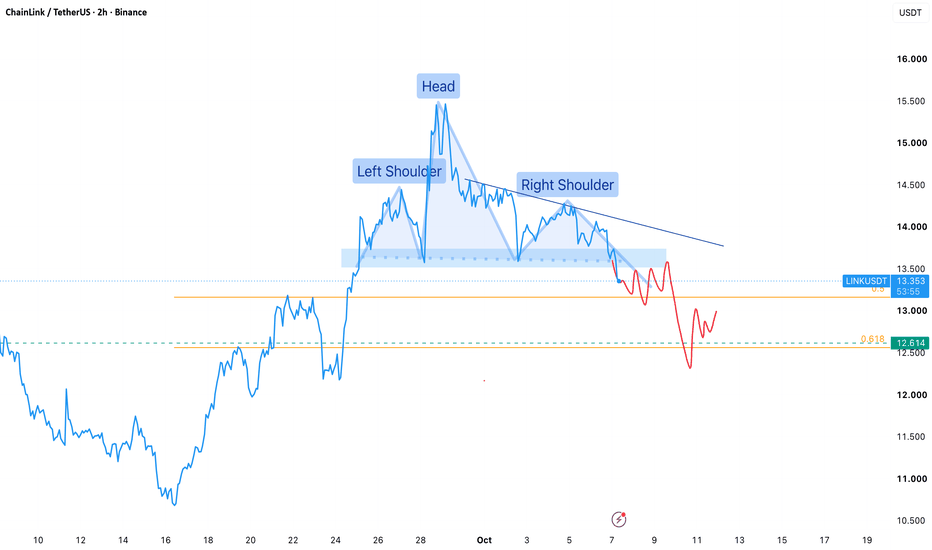
BAT Confirms Head and Shoulders BreakdownBAT Confirms Head and Shoulders Breakdown: Neckline Breach Opens Direct Route Toward 0.1 USD?
BAT on the 4-hour timeframe has officially completed a textbook head and shoulders reversal pattern as a decisive red candle broke cleanly through the horizontal neckline shelf around 0.165 USD. This sharp breakdown definitively neutralizes any remaining bullish defense observed across recent sessions.
The decisive technical catalyst lies in price simultaneously losing the ascending dynamic MA100 base
Stablecoin Dominance Rebound: What It Means for CryptoStablecoins Dominance (1D)
Stablecoin dominance has bounced from a key support and is now heading toward the next resistance at 12.49%.
What the chart shows:
Dominance fell from the 15.72% high to ~10.6%, a drop of over 5 percentage points. Capital moved out of stablecoins and into crypto assets.
Price reached the rising long-term red line (~10.65%) twice, in late September and early October, and bounced both times. This forms a double-bottom structure.
The recent pullback held at the light-b
CADJPY – Bearish Bat Completion CADJPY (1H) – Bearish Bat Completion
CADJPY has reached the 0.886 XA retracement near 112.615, completing a well-structured Bearish Bat pattern within a key resistance zone.
The Fibonacci ratios show strong harmonic alignment, while bearish RSI divergence suggests weakening bullish momentum.
Price is testing the upper resistance area, above the volume profile's primary high-volume region, making this a key zone to monitor for bearish rejection and a potential reversal toward value.
Nasdaq and Major Players Discuss US Stocks Trading at 3AMMajor financial institutions, including Nasdaq, Cboe, and Morgan Stanley, are exploring the potential implications of US stocks trading at 3AM. This discussion, highlighted by a recent tweet from @PythNetwork, raises questions about market accessibility and trading dynamics. As the trading landscape evolves, this could significantly impact investor strategies and market participation.
Quick Take
Nasdaq, Cboe, Morgan Stanley, OTC Markets, and TraditionData are collaborating on after-hours tradin
Basic Attention Token (BAT) Completes Bottom Recovery—BullishBasic Attention Token (BAT) is producing the biggest week and the biggest candle since the February crash. With this candle, the bottom recovery process is about to be completed. We've seen over and over what this means, a massive bullish wave will show up next.
This is a project that we've been tracking for a while and not one has failed to recover. Sure, some are taking more than others to move but notice the pattern, they are all moving forward at some point in time.
Some started to move ri
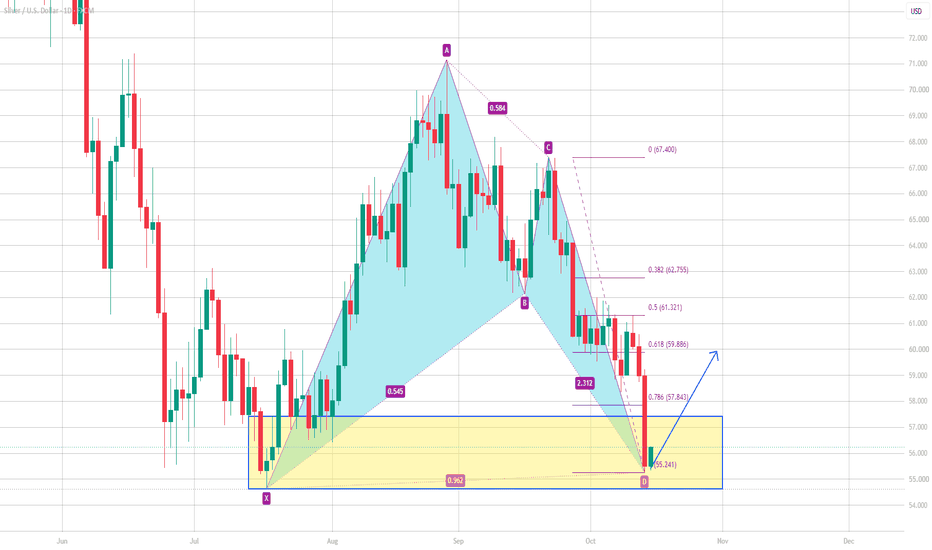
XAGUSD TP 59.88On the daily chart, XAGUSD has pulled back into a previous demand zone, with short-term price action forming a potential bullish "Bat" pattern. A long position may be considered, with an upside target near 59.88. Should the price break below the support level near 54.6, it would open the door for further downside.
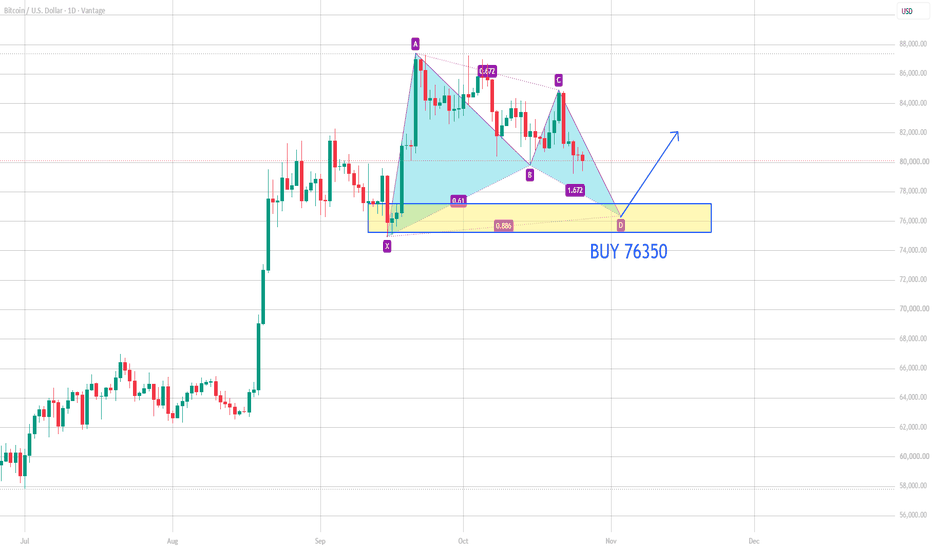
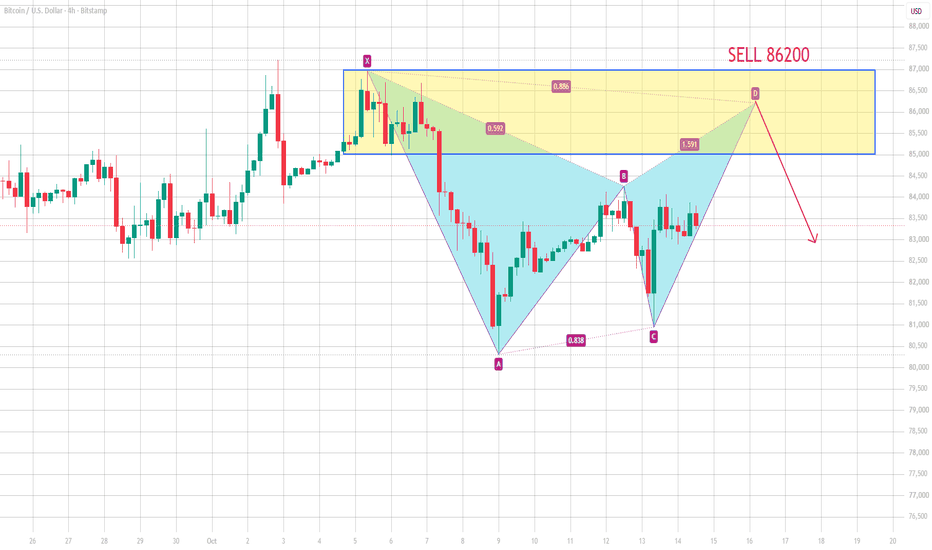
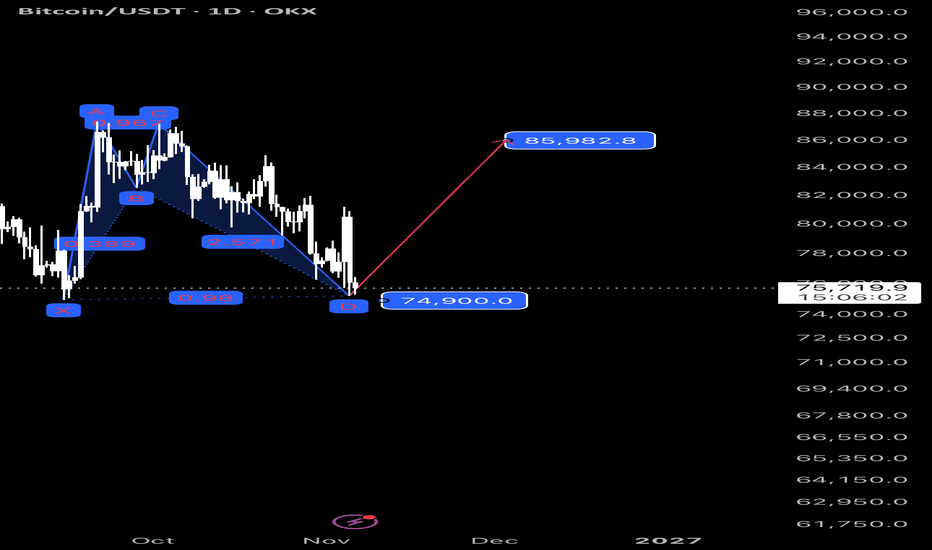
BTCUSD SELL 86200On the 4-hour chart, BTCUSD is fluctuating at high levels; attention should be focused on the area near 86,200, which serves as a potential short-selling entry point for a bearish pattern and lies within a previous supply zone. A drop below the support level near 80,000 would open up room for further downside.
AUDJPY - Barely Legal Type II bearish BatAUDJPY is testing a 0.886 harmonic completion zone near major resistance and the upper portion of the volume profile.
Price is consolidating beneath the prior high while RSI shows bearish divergence and declining momentum, suggesting buyers are losing strength.
This is a key area to watch for bearish rejection and confirmation of a deeper rotation lower.
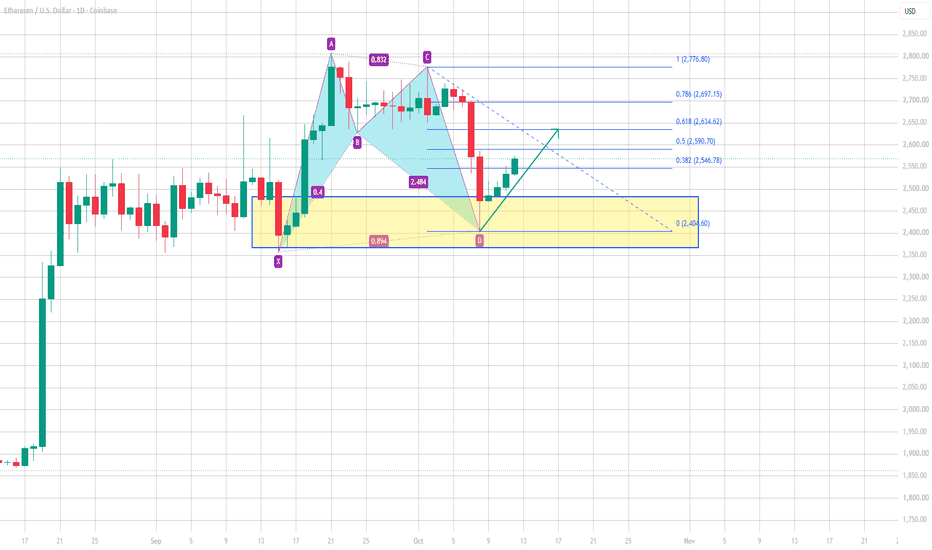
ETHUSD TP 2635On the daily chart, ETHUSD has stabilized after testing the previous demand zone, with short-term bullish momentum prevailing. Attention should be focused on the 2520–2550 range; if the price pulls back and stabilizes, further long positions could be considered, while resistance near 2635 should be monitored on the upside.
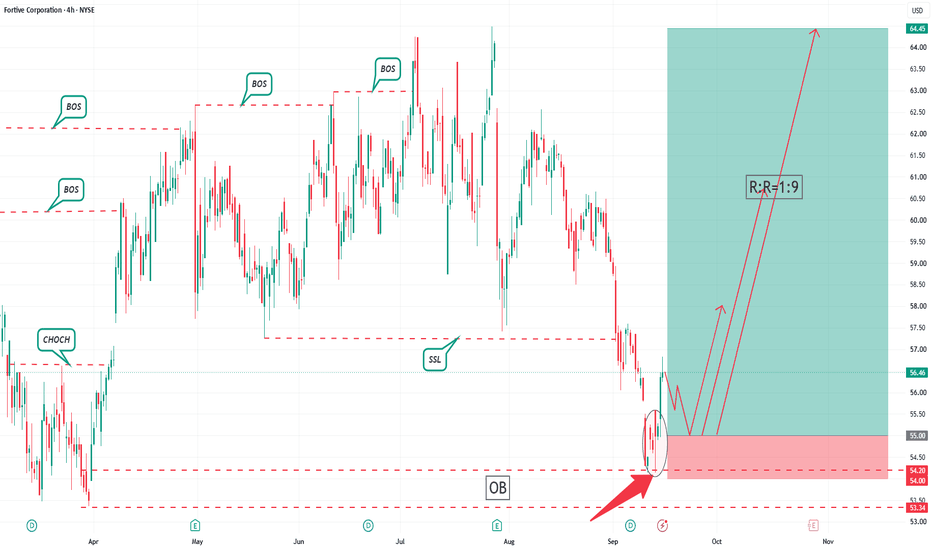
FTV Official Trading PlanFTV Official Trading Plan
1. Trading Instrument
Trading Instrument: FTV (US Stock)
2. Analysis Timeframe
Analysis Timeframe: 4H Band Trading
3. Entry Level
Wait for price pullback and go long near the market price at 55.00
4. Stop Loss Level
Full position stop loss placed at 54.000.
Strictly execute stop loss once the price breaks the stop loss level, no holding and no subjective adjustment. This trade is configured with a fixed risk-reward ratio of 1:9.
5. Take Profit & Risk Protection