Long
Long
Bitcoin Fake Breakout — Is a Bigger Correction About to Begin?Bitcoin ( BINANCE:BTCUSDT ) has experienced an upward trend over the past few days, and many traders were expecting Bitcoin to at least reach the 200_EMA(Weekly). However, due to the increasing geopolitical tensions in the Middle East and the possibility that these tensions could intensify in the coming days and nights, the market situation has changed.
At the same time, U.S. stock indices such as the S&P 500 ( CAPITALCOM:SPX500 ), as well as precious metals like Gold ( OANDA:XAUUSD ) and Silver ( OANDA:XAGUSD ), have started to decline, while the Dollar Index ( TVC:DXY DXY) has started to rise. Therefore, it seems unlikely that Bitcoin can continue its rally against this increasing macroeconomic pressure.
Before starting the technical analysis, it is important to mention that any news, statements, or developments related to the Middle East tensions over the next 24 hours could have a significant impact on risk assets such as Bitcoin.
Bitcoin has once again moved below the resistance zone($65,630-$64,650) and the 50_EMA(Daily), which could be considered a potential fake breakout.
From an Elliott Wave perspective, it appears that Bitcoin’s recent upward move could be part of a corrective structure, potentially forming a Double Three Correction(WXY).
Also, we can see a bearish Butterfly Harmonic Pattern in the 4-hour time frame.
Based on the points mentioned above, I expect Bitcoin to continue its bearish trend. After breaking the Ascending Channel support line, Bitcoin could decline at least toward the $63,300 level. If bearish momentum increases, we could expect a deeper correction.
First Target: $63,300
Second Target: $62,180
Stop Loss(SL): $66,400
Key levels: $64,120 _ $62,800 _ $66,000
Cumulative Short Liquidation Leverage: $67,700-$67,100
Cumulative Long Liquidation Leverage: $64,440-$63,460
Cumulative Long Liquidation Leverage: $61,830-$60,550
What’s your view on Bitcoin? Do you think Bitcoin can resume its bullish trend, or should we expect a correction similar to other markets?
Note: Any news, statements, or developments related to the ongoing Middle East tensions could quickly affect Bitcoin’s price action and other risk assets.
💡 Please respect each other's opinions and express agreement or disagreement politely.
📌Bitcoin Analysis (BTCUSDT), 4-hour time frame.
🛑 Always set a Stop Loss(SL) for every position you open.
✅ This is just my idea; I’d love to see your thoughts too!
🔥If you find it helpful, please BOOST this post and share it with your friends.  Short
Short
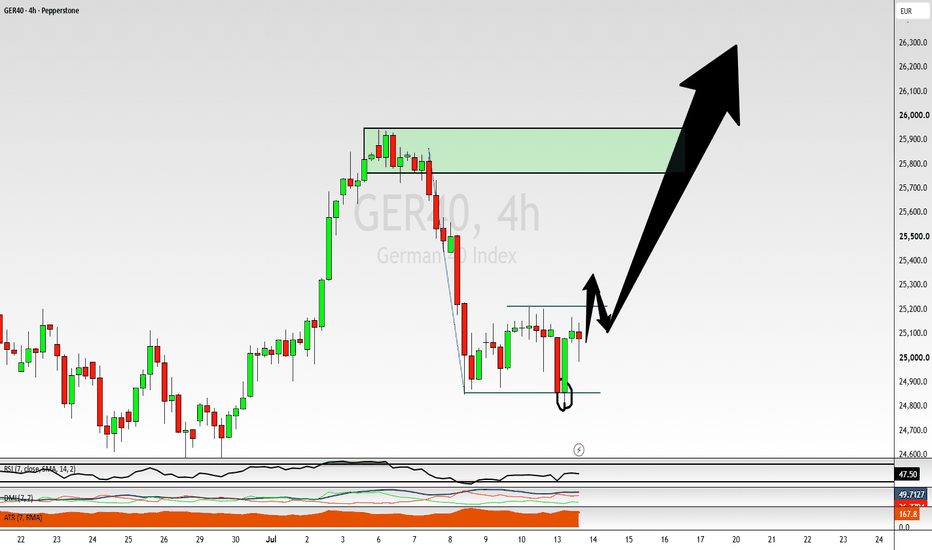
DAX : Buying the Pullback Instead of Chasing All-TimLast week, the DAX pushed into fresh all-time highs, and I warned against becoming the trader who buys at the most expensive price just before the market finally decides to pull back. Instead of chasing strength, the goal was to wait for price to give us some relief and look for an opportunity to enter at a more favorable level.
Thanks to the bearish Butterfly pattern, we were able to do exactly that — identifying a potential reversal zone and waiting for price to retrace into an area where buyers could step back in. Now, the DAX is showing some encouraging signs, with multiple bullish candles forming and suggesting that this may be the level where the retracement finds support.
For confirmation, I’d like to see price break and close above the current sideways consolidation channel, signaling that buyers are regaining control.
Because the broader trend remains strongly bullish, a conservative target would be a retest of the previous all-time highs. However, given the strength of the overall trend, I would want to maintain some exposure to the possibility of a continuation move higher if momentum carries the market beyond those previous highs.
Please leave any questions, comments or share your ideas below
Akil  Long
Long
Gold Climbed Fast _ But a Bearish Butterfly Is FormingIn the past few hours, due to comments from Kevin Warsh suggesting a potential rate cut in the future, a wave of positivity has led Gold ( OANDA:XAUUSD ) to rise. However, this bullish move seems temporary. Now, let’s dive into gold’s technical analysis on the 1-hour timeframe—stay with me.
Gold is currently trading near a resistance zone($4,122-$4,091).
From an Elliott Wave perspective, Gold appears to be completing its primary Wave 4, which seems to follow a Zigzag correction(ABC/5-3-5).
Additionally, on Gold’s 1-hour chart, we can clearly observe a Bearish Butterfly harmonic pattern forming.
I expect that Gold will fail to break the resistance zone($4,122-$4,091) in the coming hours and will decline at least to $4,011. If the bearish trend continues, it could drop further to around $3,974.
First Target: $4,011
Second Target: $3,974
Third Target: $3,923
Stop Loss(SL): $4,144(Worst)
What’s your view on Gold? Will it settle below $4,000, or should we expect another upward move in gold’s price?
💡 Please respect each other's opinions and express agreement or disagreement politely.
📌 Gold Analyze (XAUUSD), 1-hour time frame.
🛑 Always set a Stop Loss(SL) for every position you open.
✅ This is just my idea; I’d love to see your thoughts too!
🔥 If you find it helpful, please BOOST this post and share it with your friends.  Short
Short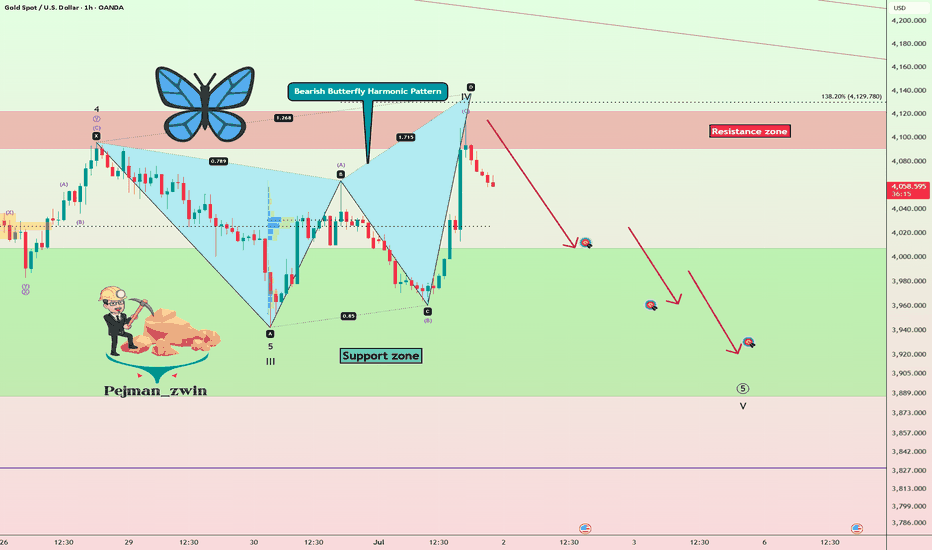
Short 
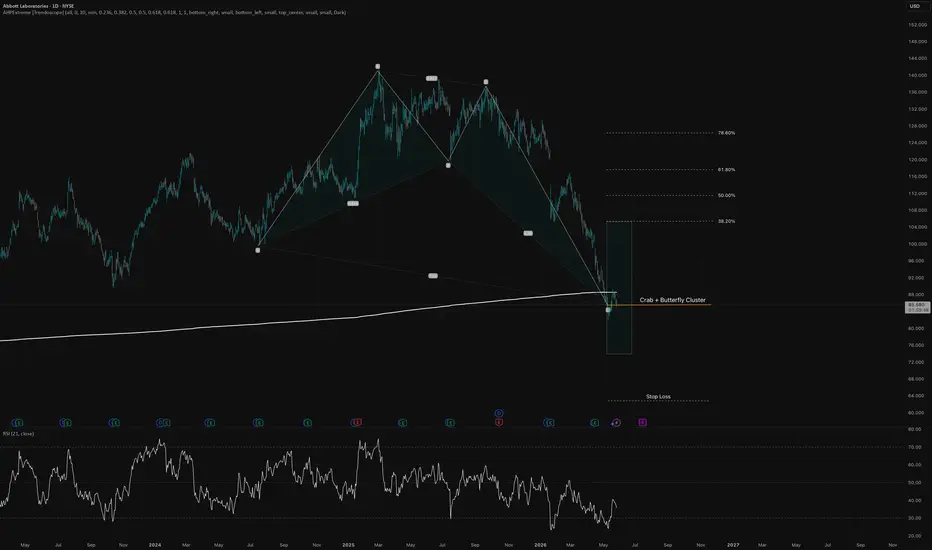
ABT | Bullish Harmonic Reversal Zone at Major Support
ABT | Bullish Harmonic Reversal Zone at Major Support
Abbott Laboratories is currently trading into a technically important reaction area on the daily chart.
After the strong decline from the 2025 highs, price has reached a potential harmonic completion zone where multiple projections appear to cluster. The area around 85–88 USD is especially relevant, as it aligns with:
* a potential Bullish Crab / Butterfly completion zone
* a visible harmonic pattern cluster
* a long-term rising support / moving average area
* a psychologically important former support region
* an oversold recovery attempt on the RSI
From a structure perspective, ABT has completed a sharp corrective leg into the projected D-zone. This makes the current area interesting for a possible bullish reversal, but confirmation is still important.
The first key signal would be a strong daily reaction from the current zone, ideally followed by a reclaim above the short-term structure around **88–90 USD**. A higher low after that reclaim would strengthen the bullish case.
Bullish Scenario
If price confirms support in the current zone, the first upside objective would be the lower Fibonacci retracement area around **104–106 USD**. Above that, the next relevant targets are located near:
**TP1:** 104–106 USD
**TP2:** 118–120 USD
**TP3:** 136–138 USD
The 0.618 retracement area near 118–120 USD is particularly important, as this would be the first major test of whether the reversal is only a corrective bounce or the beginning of a broader recovery.
Bearish Scenario
The setup loses quality if ABT fails to hold the harmonic completion zone and breaks clearly below the current support area. A decisive daily close below the PRZ would indicate that the pattern is failing and that lower prices could follow.
For now, the chart is not a blind long signal, but it is a technically attractive reversal watchlist setup. The current zone offers a clean risk-defined area, while the upside potential remains significant if buyers step in.
Conclusion:
ABT is trading at a relevant harmonic support cluster. A confirmed bullish reaction from this area could open the door for a recovery toward 105 USD, 120 USD and potentially 137 USD. Confirmation remains key.  Long
Long
 Short
Short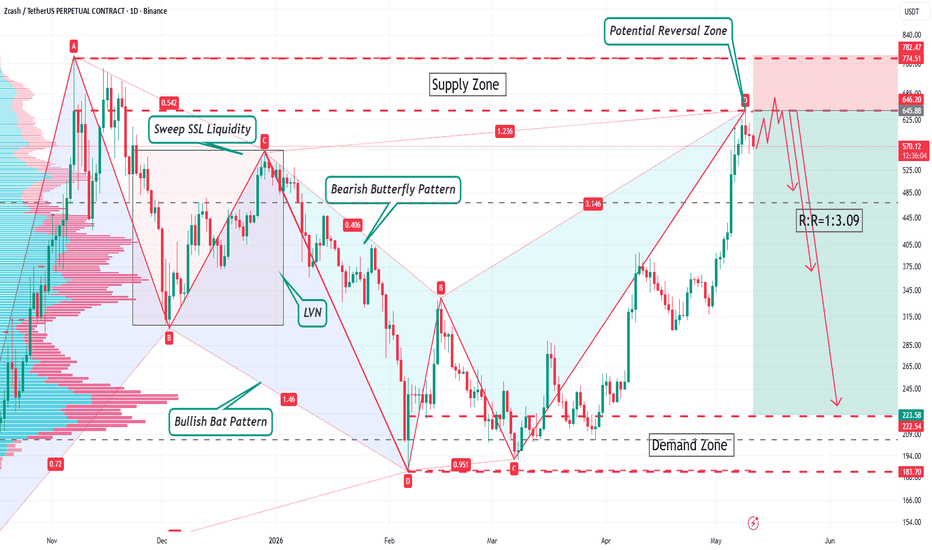
Short 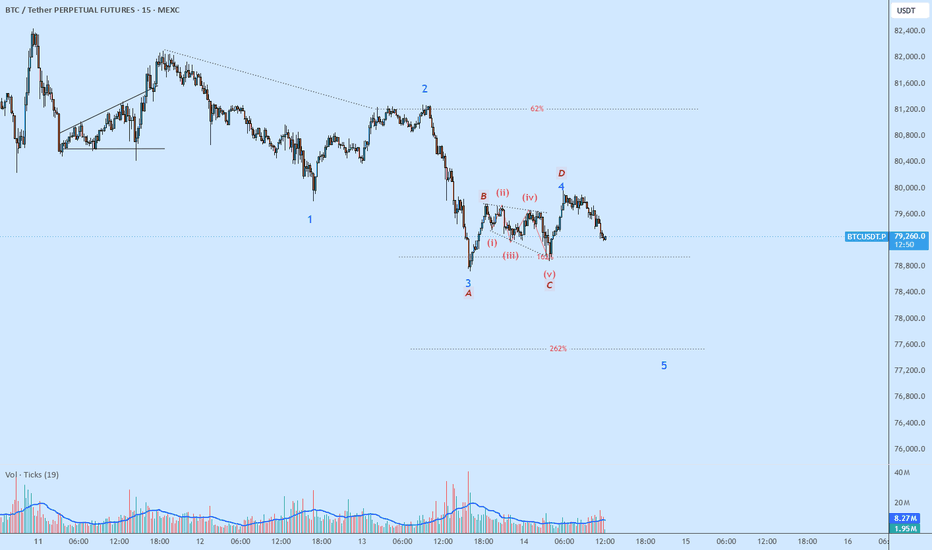
$ZS — The Triangle Waits Patiently🕯️ NASDAQ:ZS — The Triangle Waits Patiently 🕯️
Not a Wyckoff base. Not a simple trendline bounce. This is an Elliott Wave descending triangle (A-B-C-D-E) playing out across multiple years — and we just tapped wave (C).
📜 THE STRUCTURE
Impulse (2019-2022): $30 → $385. Five-wave bull move.
Correction (2022-present): Triangle pattern, converging trendlines.
(A) 2023 low: $89 — first test of ascending support
(B) 2025 high: $340 — rejection at descending resistance
(C) 2026 current: $135 — higher low, bouncing off ascending trendline support
(D) projected ~$300 — next rejection, lower high
(E) projected ~$200 — final higher low, last shakeout
🔮 THE CRITICAL LEVEL: $89.54
That 2023 low is the floor of the entire triangle. Loss of $89 invalidates the structure. Hold it = continuation pattern intact.
🚀 THE THRUST
After wave (E) completes, triangles typically resolve with a thrust in the direction of the original trend. For NASDAQ:ZS , that means a breakout above the descending resistance line (~$300-340 zone by 2028-2030), targeting the measured move of the triangle height added to the breakout point.
Measured move math:
Triangle height: $385 − $89 = $296
Breakout point (projected): ~$300
Thrust target: $440-480
📍 LEVELS THAT MATTER RIGHT NOW
🔑 $135 — current price (wave C zone)
🔑 $145 — short-term reclaim for C confirmation
🔑 $120 — triangle lower bound (lean zone)
🔑 $89 — HARD INVALIDATION (loss = pattern broken)
⚖️ RISK FRAME
If wave (C) is in: risk $45 to invalidation, first trend-change confirmation at $180, wave (D) target at $300.
Risk/reward from $135: 3.6:1 to wave (D).
This isn't a 3-month trade. This is a multi-year pattern completion setup. Swing traders scale in and out of the waves. Long-term holders accumulate at (C) and (E).
🕸️ THE READ
The triangle is doing what triangles do: compressing volatility, testing the faithful, shaking out the impatient. The (A) low held three years ago. The ascending trendline held this week. The pattern is alive.
Process over prediction. Risk-first, always.
Geometry is fate when the structure is clean.
— @WaverVanir
#wavervanir #volanx #ZS #ElliottWave #cybersecurity  Long
Long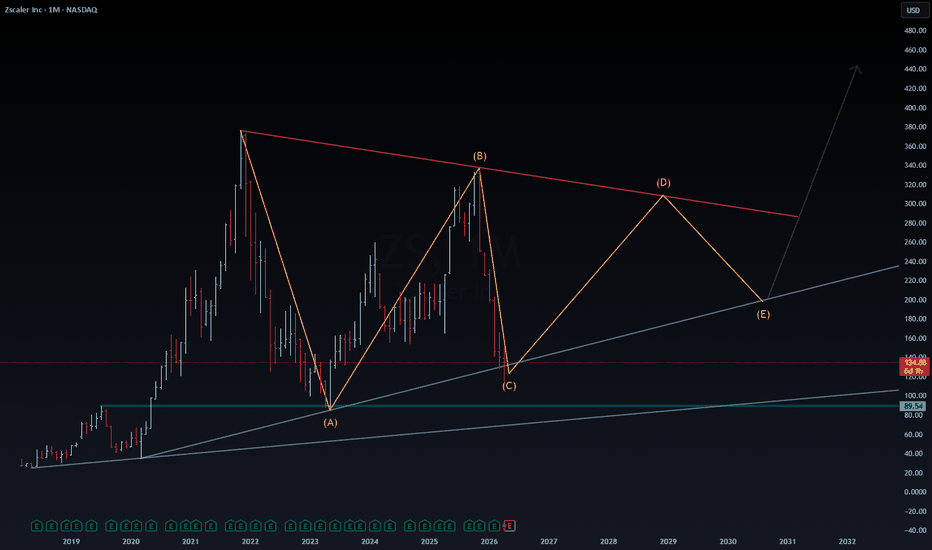
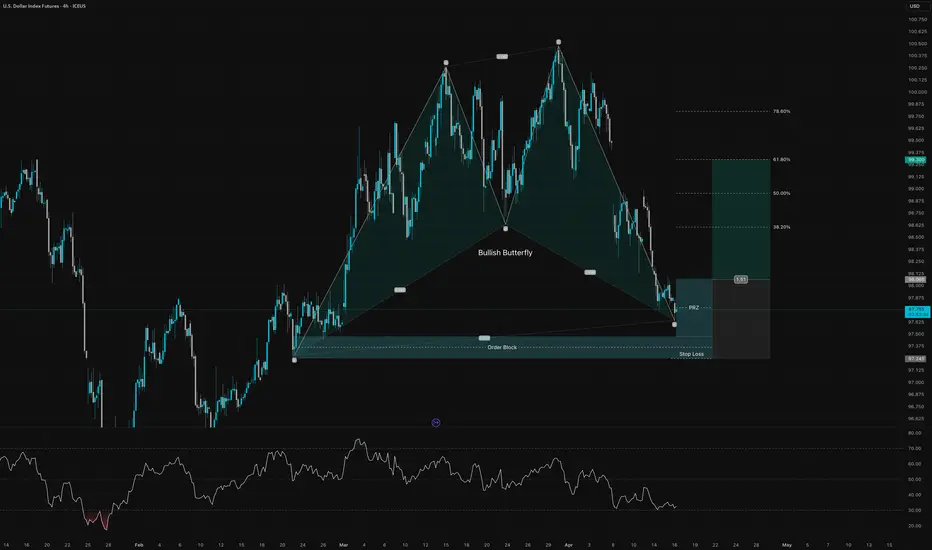
U.S. Dollar Index Future Bullish ButterflyOn the 4H chart, U.S. Dollar Index Futures are approaching a technically important reaction zone after completing a Bullish Butterfly harmonic pattern. The pattern terminates inside a well-defined PRZ (Potential Reversal Zone) around the 97.60–97.25 area, which also overlaps with a prior order block. This confluence makes the current region highly relevant for a possible bullish reaction.
After the strong selloff from the recent highs, price has now reached a zone where downside momentum may start to fade. In addition, RSI is trading in a weak area, suggesting the market is already stretched on the downside. That does not guarantee an immediate reversal, but it does support the idea that sellers may be losing momentum near support.
As long as price holds above the lower boundary of the PRZ and the stop-loss area around 97.25, a recovery move toward the next Fibonacci retracement levels becomes increasingly likely. The first upside targets are located near the 38.2% retracement, followed by the 50.0% and 61.8% levels, with the latter sitting around 99.30 and acting as the main bullish target in this setup.
The bullish idea would be invalidated by a clear break below the PRZ and stop-loss zone, as that would suggest the harmonic support has failed and sellers remain in full control.
Overall, this is a countertrend bullish setup inside a larger bearish move, so confirmation through price action is important. If buyers defend the PRZ, the chart offers an attractive rebound opportunity with a favorable risk-to-reward structure.
 Long
Long
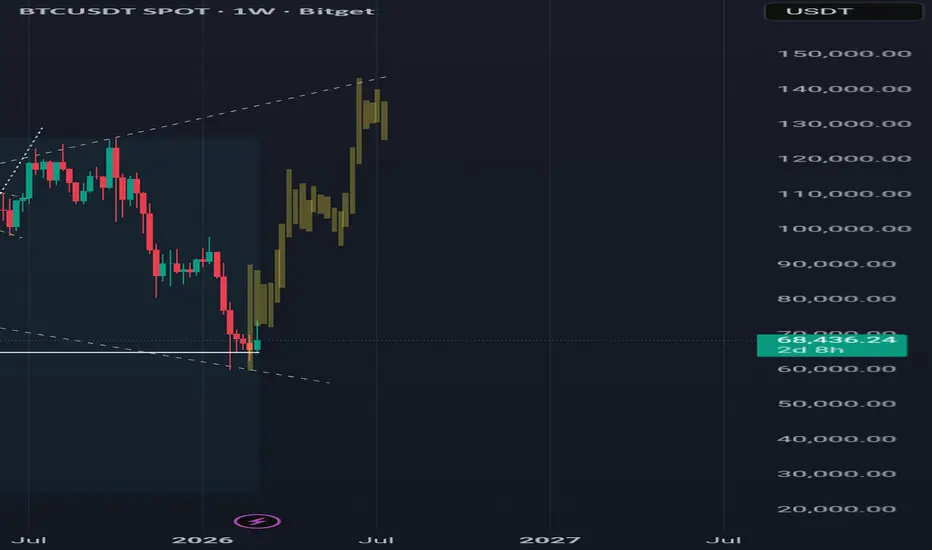
Bitcoin D1 Bullish ButterflyBitcoin (BTC1!) | D1 Chart Analysis
Bitcoin is trading off a completed **Bullish Butterfly** on the daily chart, with the reversal zone forming around the **59,100 area**. Since the reaction from the PRZ, price has been building a recovery structure and is now pushing back into higher retracement territory.
From a technical perspective, the pattern remains valid as long as the market continues to defend the reaction low and hold above the broader support structure.
**Bullish view**
The key idea here is that the Butterfly completion marked an exhaustion point in the previous selloff. As long as Bitcoin holds above the pattern low, the path remains open for a continuation toward the main retracement objectives:
* **38.2%** around **84,000**
* **50.0%** around **92,000**
* **61.8%** around **100,800**
* **78.6%** around **112,000**
A sustained move through the first retracement levels would confirm that the bullish reversal is gaining traction.
**Two stop loss variants**
**1. Aggressive stop loss**
Place the stop **below the Butterfly invalidation low / D-point**, around **59,100**.
This is the tighter risk model and fits traders who want better R:R but accept a higher chance of being stopped by volatility.
**2. Conservative stop loss**
Place the stop **below the lower daily FVG support**, around **43,700**.
This is the wider structural stop and gives the trade more room, but it comes with heavier downside tolerance and weaker capital efficiency.
**What matters now**
The bullish thesis stays intact while price holds above the PRZ reaction low. If Bitcoin starts accepting above the current recovery range, the market could gradually rotate toward the higher Fibonacci objectives. A rejection back into the PRZ, however, would slow the bullish case and put the pattern under pressure again.
Key levels:
Support: **59,100** / **43,700**
Resistance / targets: **84,000** / **92,000** / **100,800** / **112,000**
For now, this still looks like a valid daily bullish reversal structure — but continuation now matters more than pattern completion alone.
Long 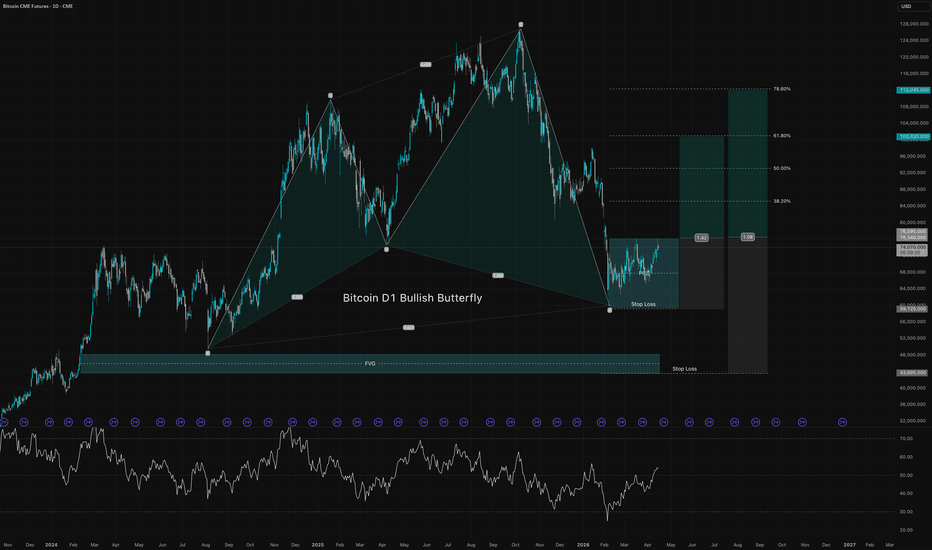
 Long
Long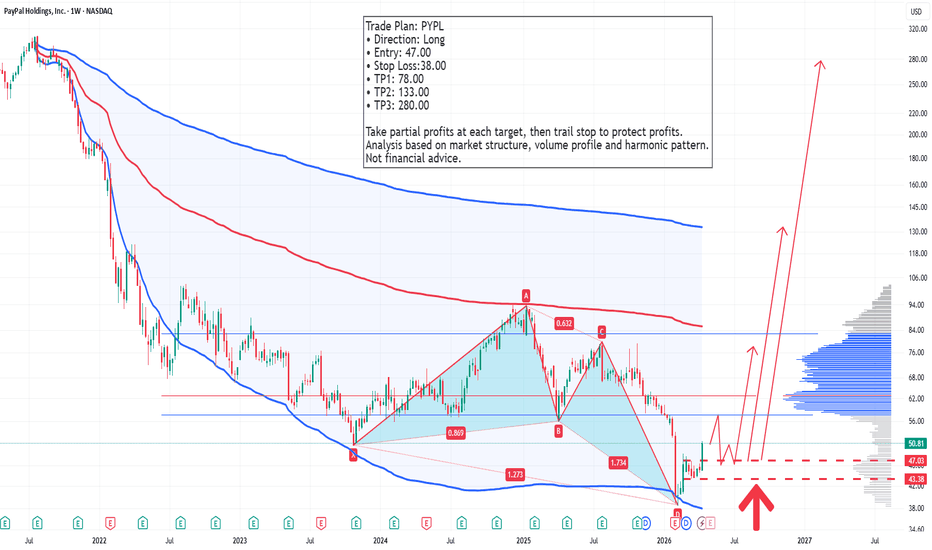
 Long
Long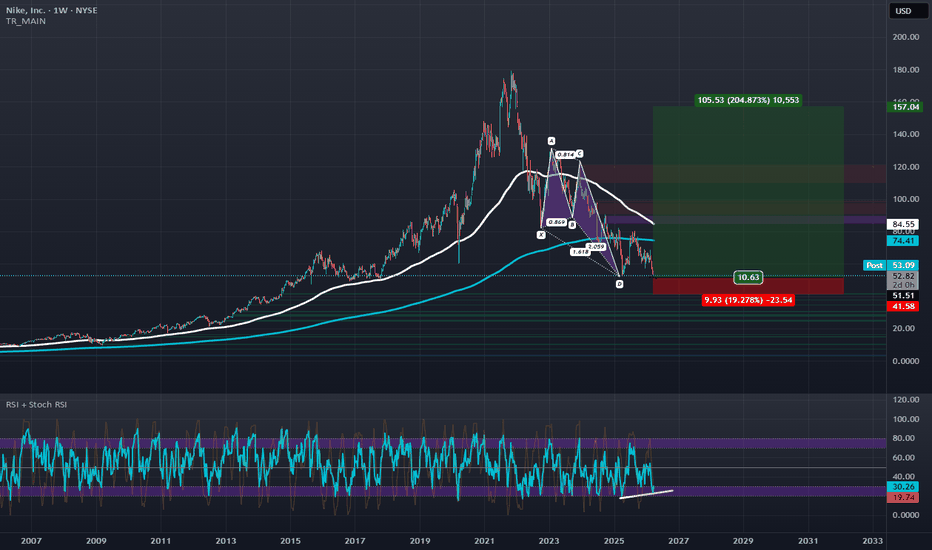
Long 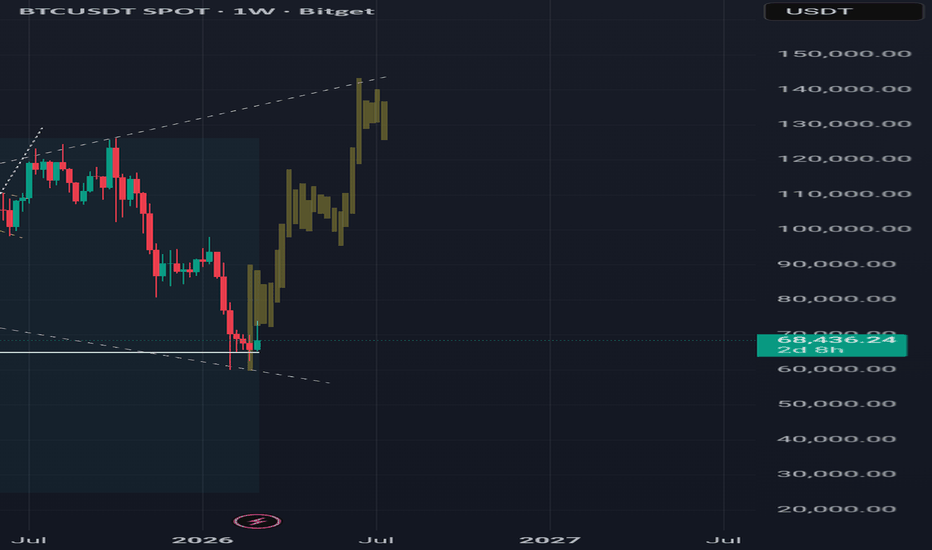
 Long
Long
 Long
Long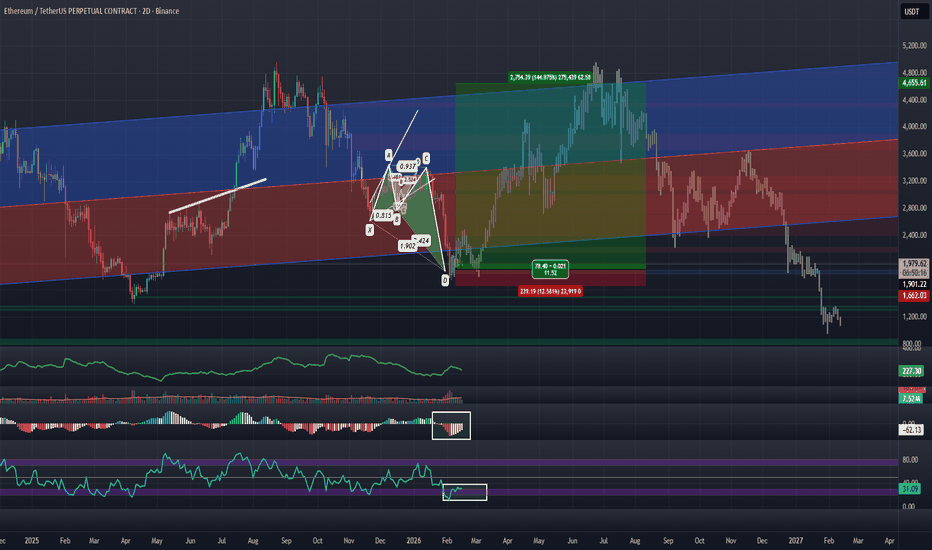
BTCUSD: Bearish Logscale Butterfly with Bearish RSI DivergenceJul 18, 2025:
Bitcoin has been setting up at the log adjusted 1.902 HOP for a Type 2 retest of the Logscale Bearish Butterfly for the last few months but recently pushed a bit above it and appears to be settling at the linear 1.902 HOP of the local price around the $118,000 area. Between $104,000 and $118,000 is a zone of linear of logscale Fibonacci confluence pointing towards the being the area to look for a more major downside reaction than we got off the initial Type 1 Reaction 1.618 PCZ reversal in 2021.
The most recent push to the linear 1.902 seems to have allowed the structure of the RSI to develop a more Bearishly Distributive and Divergent curve, while the MACD is in the process of developing a 2nd layer of Bearish Divergence. Ultimately at these highs we'd like to see the RSI weaken further as price begins to settle back within the 1.902 bearish zone of confluence before being more sure of downside.
Additionally, during the push higher, longer dated bearish call interest came in around the 123-125k levels which to me signals a newly formed hard resistance that will be hard to gap over and will make failure here more likely. I think if we do see failure we can of course fill the CME gap down at 91.8k, but ultimately the true first target is down at 30k with max targets down near the 0.886 around $4.8k and the 100 percent retrace down at around $3,123.51 over the coming quarters.
Taking into account the wide range in downside exposure I think the best and safest way to speculate on this downside would be through the buying of the March, 27th, 2026 Puts at the $95,000 strike or the closest IBIT equivalent March, 20th, 2026 Puts at the 58 strike this will give plenty of time, as well as plenty of range for the puts to appreciate 10's of thousands of dollars in value as BTC trades down into the targeted zones below it.
02/05/2026
Trade closed manually
Closed for now; details here:
www.tradingview.com
This is a Repost: because the original post from Jul 18, 2025, got taken down by a TradingView moderator for having a custom moving average indicator that was not made public. Despite the moving averages only just being simply and exponential moving averages anyone could add to their charts. In light of this issue I have published the multi-moving average indicator so hopefully that should stop mods from taking down past and future posts.
For the time being I will keep this post in neutral status as we've already moved down significantly, are in the oversold zones in the RSI, and are likely due for a retrace back up which I will go into details about on my next post which will be a repost from last week's idea which was also taken down by a moderator. Long