ETHUSDT 45-Min Short Swing Trading PlanETHUSDT 45-Min Short Swing Trading Plan
1. Trading Instrument
Ethereum / Tether USDT (ETHUSDT)
2. Trading Time frame
45-Minute (45 min) Chart — Swing Short Trade
3. Market Bias
Bearish swing bias. Short trade setup, execute staged downside profit-taking with partial position reduction and dynamic protective stop adjustment at each target level.
4. Entry Rule
Initiate short position around the price level of 2395.00.
5. Stop Loss Rule
Fixed hard stop loss placed at 2412.00 to limit maxi
Butterfly
FET/USDT Bullish Setup
FET/USDT is showing **two bullish harmonic patterns** at the same time: a **Bullish Bat** (green) and a **Bullish Butterfly** (yellow).
A **Bullish Bat** is a harmonic pattern that looks for a potential price reversal from a lower support area.
A **Bullish Butterfly** is another harmonic pattern that can signal a possible bullish reversal after a strong decline.
Here, both patterns point to the same area, making the **$0.0777–$0.0900 zone** important to watch.
**Entry:** Look for a bullish
GBPCHF - Bearish ButterflyGBPCHF is completing a Bearish Butterfly pattern near the 1.27 extension, aligning with a major resistance zone and the VAH area of the volume profile.
Price is pressing into the upper value boundary after an extended bullish run, while RSI has shown repeated bearish divergence signals, suggesting upside momentum may be weakening.
This is a key zone to watch for bearish rejection and reversal confirmation, especially if price fails to hold above the D-point/VAH resistance area.
Bitcoin Fake Breakout — Is a Bigger Correction About to Begin?Bitcoin ( BINANCE:BTCUSDT ) has experienced an upward trend over the past few days, and many traders were expecting Bitcoin to at least reach the 200_EMA(Weekly). However, due to the increasing geopolitical tensions in the Middle East and the possibility that these tensions could intensify in the coming days and nights, the market situation has changed.
At the same time, U.S. stock indices such as the S&P 500 ( CAPITALCOM:SPX500 ), as well as precious metals like Gold ( OANDA:XAUUSD ) and Si
EUA dec26 potencial shortA bearish harmonic pattern has emerged on the 1-hour TF, which matches the ABCD pattern on the 4-hour TF. You can see two possible ranges of targets: one more conservative and the other more advanced. Huge volume at around 81.7 and a little less at around 83. Fundamentally CDS strongly in the money in Q4 (bullish support).
A potential Bullish Butterfly on the HOTUSDT 2H chart
B: 0.789 retracement of XA ✅
C: 0.797 retracement of AB ✅
D: 1.62 extension of BC / 1.178 of XA → completing around 0.000251
The pattern is not complete yet — waiting for price to reach the D point (PRZ). 0.000197 remains a separate major support level to watch below.
No position should be considered until reversal confirmation (candle pattern, volume) appears at the PRZ.
Not financial advice.
#HOT #HOTUSDT #Butterfly #HarmonicPatterns #Binance
DAX : Buying the Pullback Instead of Chasing All-TimLast week, the DAX pushed into fresh all-time highs, and I warned against becoming the trader who buys at the most expensive price just before the market finally decides to pull back. Instead of chasing strength, the goal was to wait for price to give us some relief and look for an opportunity to enter at a more favorable level.
Thanks to the bearish Butterfly pattern, we were able to do exactly that — identifying a potential reversal zone and waiting for price to retrace into an area where buy
Gold Climbed Fast _ But a Bearish Butterfly Is FormingIn the past few hours, due to comments from Kevin Warsh suggesting a potential rate cut in the future, a wave of positivity has led Gold ( OANDA:XAUUSD ) to rise. However, this bullish move seems temporary. Now, let’s dive into gold’s technical analysis on the 1-hour timeframe—stay with me.
Gold is currently trading near a resistance zone($4,122-$4,091).
From an Elliott Wave perspective, Gold appears to be completing its primary Wave 4, which seems to follow a Zigzag correction(ABC/5-3-5).
A
Gold turned Bearish🥇 XAUUSD — 4H UPDATE
Bias: 🔴 Bearish
Looking for: Short setups
Key levels:
— Resistance (flipped support): 4,450 zone
— Current price: ~4,332to 4350 - first Resistance
— Target: 4,190
Structure:
Support broke last week. Bears are in control. Price is now below the key supply zone — that level is now resistance.
Watch:
Possible Bullish Bat harmonic setting up to the downside before a reversal. D-point completion around the 4,190–4,200 area. Will reassess for longs once pattern completes wi
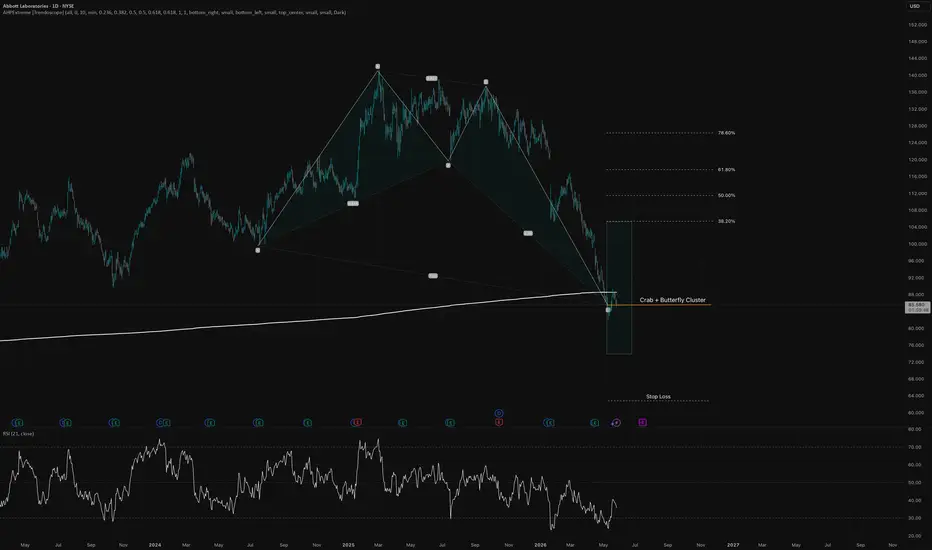
ABT | Bullish Harmonic Reversal Zone at Major Support
Abbott Laboratories is currently trading into a technically important reaction area on the daily chart.
After the strong decline from the 2025 highs, price has reached a potential harmonic completion zone where multiple projections appear to cluster. The area around 85–88 USD is especially relevant, as it aligns with:
* a potential Bullish Crab / Butterfly completion zone
* a visible harmonic pattern cluster
* a long-term rising support
$COINBASE:BTCUSD : BTCUSD Develop a ButterflyCOINBASE:BTCUSD
You can trade the CD leg 📈 or wait for the D point to complete 🎯
⚠️ This content is for educational purposes only and does not constitute financial or trading advice. We are not responsible for any misuse or incorrect application of this information.
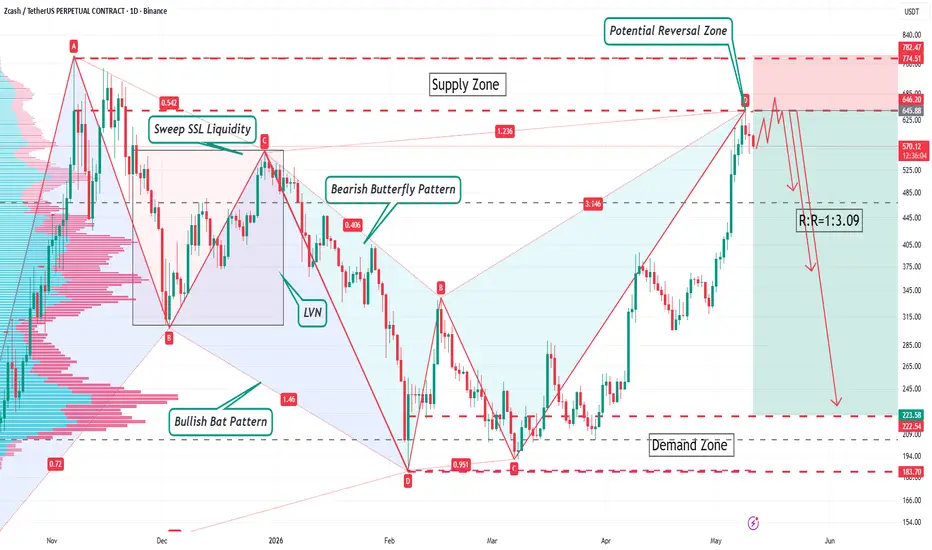
ZEC/USDT Perpetual Trading PlanZEC/USDT Perpetual Trading Plan
Trading Plan: ZEC/USDT Perpetual
Market Direction: Short (Daily Timeframe)
Entry Price: 645.88
Stop Loss Price: 782.50
Profit Targets & Position Management:
1. First Target: 488.00 - Reduce position by half, move stop loss to break-even
2. Second Target: 369.50 - Reduce remaining position by half, adjust stop loss upward
3. Third Target: 223.60 - Reduce remaining position by half, adjust stop loss upward
4. Last Position: Hold with trailing stop loss
Risk D
$ZS — The Triangle Waits Patiently🕯️ NASDAQ:ZS — The Triangle Waits Patiently 🕯️
Not a Wyckoff base. Not a simple trendline bounce. This is an Elliott Wave descending triangle (A-B-C-D-E) playing out across multiple years — and we just tapped wave (C).
📜 THE STRUCTURE
Impulse (2019-2022): $30 → $385. Five-wave bull move.
Correction (2022-present): Triangle pattern, converging trendlines.
(A) 2023 low: $89 — first test of ascending support
(B) 2025 high: $340 — rejection at descending resistance
(C) 2026 current: $135 — higher
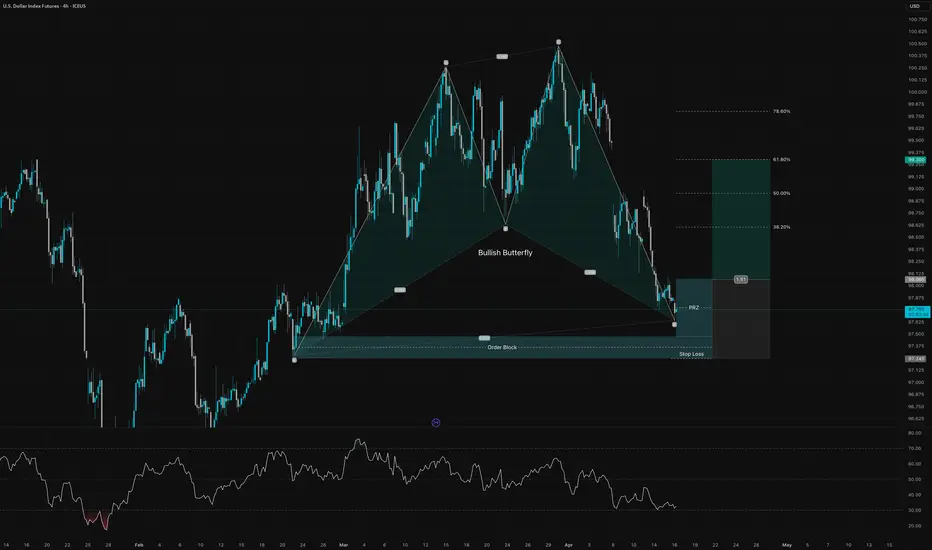
U.S. Dollar Index Future Bullish ButterflyOn the 4H chart, U.S. Dollar Index Futures are approaching a technically important reaction zone after completing a Bullish Butterfly harmonic pattern. The pattern terminates inside a well-defined PRZ (Potential Reversal Zone) around the 97.60–97.25 area, which also overlaps with a prior order block. This confluence makes the current region highly relevant for a possible bullish reaction.
After the strong selloff from the recent highs, price has now reached a zone where downside momentum may sta
Bitcoin D1 Bullish ButterflyBitcoin (BTC1!) | D1 Chart Analysis
Bitcoin is trading off a completed **Bullish Butterfly** on the daily chart, with the reversal zone forming around the **59,100 area**. Since the reaction from the PRZ, price has been building a recovery structure and is now pushing back into higher retracement territory.
From a technical perspective, the pattern remains valid as long as the market continues to defend the reaction low and hold above the broader support structure.
**Bullish view**
The key id
NKE: 1.618 Bullish Butterfly with RSI Bullish DivergenceNKE is down 71% from the highs with an unfilled upside gap at $157. In this decline NKE has formed some RSI Bullish Divergence at the 1.618 PCZ of a Bullish Butterfly. Given how much NKE has already been beaten down I think that it is slightly more likely for NKE to attempt to find a bottom here especially as it goes into earnings today and if it does I think it could rise to the top of the pattern to $130 and from there maybe even go for the full gap fill at $157 so long as today's earnings do
EURJPY: Consolidation Hiding Opportunities (Gartley & Butterfly)The EUR/JPY has been in a period of consolidation since the start of 2026. Now, many traders see consolidative markets as “boring” or offering no opportunities—but the truth is, they can be full of setups if you know where to look.
Today, I’m focusing on two potential harmonic patterns:
A Bearish Gartley on the Daily & a Bearish Butterfly on the 4-Hour – Now, I’ll be honest—I’m not usually a fan of butterfly patterns because of their risky completion points. But this particular formation is ra
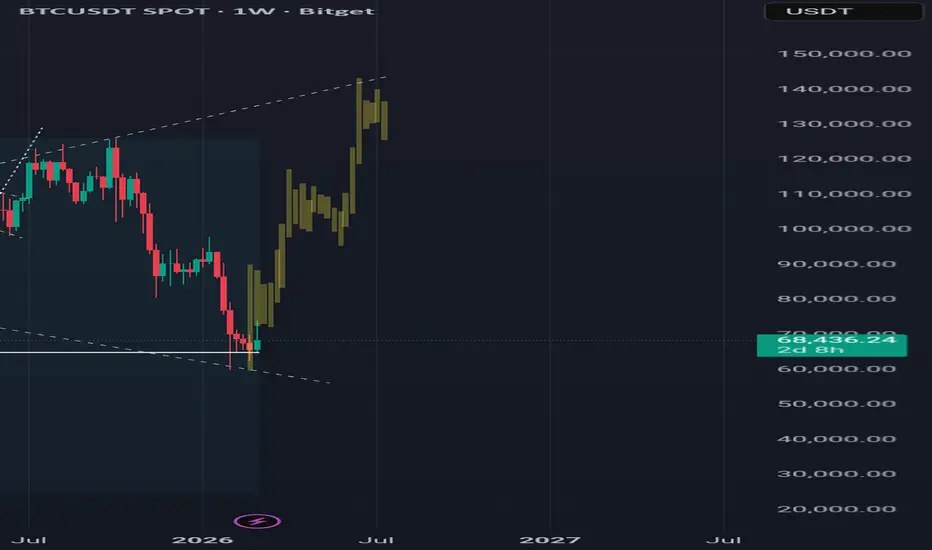
Plausible Bitcoin Price pathThe lower and upper trend line haven't been broken, giving a 📢 shape pattern. A bounce is plausible here, contrary to what majority think.
Combining the trend line with the visible POI, this would be interesting to watch.
If this plays out, I'd bet a bearish wolf pattern at 140kish would playout with a bearish target of 40k thereabout.
Ohhh well, time will tell.
NG. National Grid Long - Enter now or DCA around entry/SL zoneNG. National Grid Long - Enter now or DCA around entry and SL zone
Already in this trade but still a chance to enter on any pullback or slow DCA around entry.
Dividend paying
Long term uptrend so could hold a bit of position rather than full exit.
Bull flagging on old support with breakout
Hidden bullish divergence on MACD and RSI, suggesting continuation up
TP1 based on butterfly harmonic 1.272 target
TP2 based on 1.618 fib extension
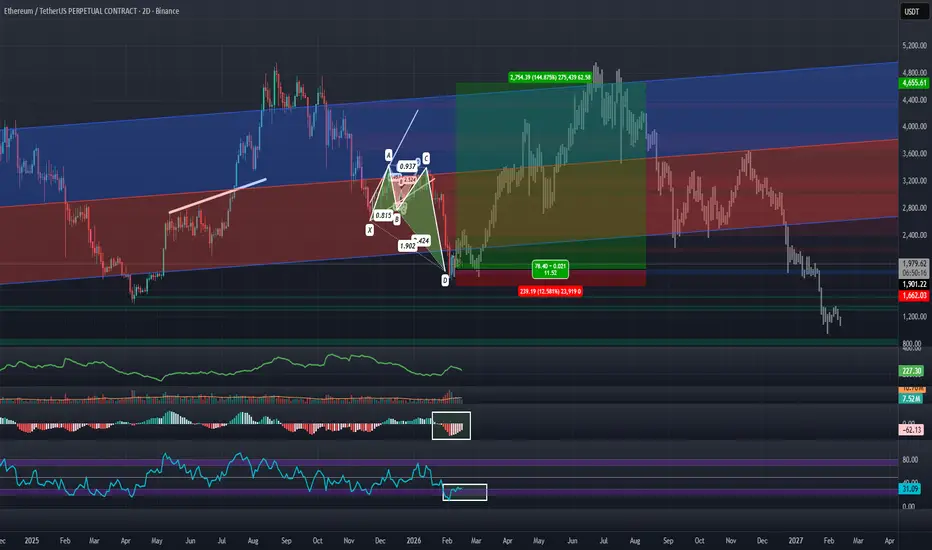
ETHUSD: Bullish Butterfly at HOP with RSI and MACD RecoveringPreviously I shorted ETH via puts on the Grayscale ETHE ETF seen here: But I will now be taking profit on those shorts and looking to long ETH back up to around the mid-top lines of the linear regression channel. I will be doing so off the back of a Bullish Butterfly that has developed on the daily paired with the waning of negative momentum in the MACD, RSI, and what appears to be the start of a decline in the ATR. I think this butterfly can carry us to the line of best fit around $3,400 but c