Short
Short
Bitcoin Daily Analysis 15 July 2026Hi everyone! Let’s dive into today’s Bitcoin analysis.
Daily Timeframe
Yesterday's daily candle for Bitcoin was highly impulsive, sharply breaking through the 4-hour resistance zone that had been keeping it in check for quite a while. However, we cannot conclusively declare that Bitcoin's overall trend has shifted to bullish based on this single candle. Since this move was heavily driven by market hype, sentiment, and FOMO, this resistance breakout absolutely needs to be validated by follow-through candles over the coming days.
4-Hour & 1-Hour Timeframes (Execution)
Following yesterday's news, the 4-hour chart printed a powerful, impulsive candle that sliced right through the $64,396.5 resistance. Since then, price has paused and is currently printing a series of tight range candles.
Given these market conditions, we have two distinct entry triggers:
Long Scenario: Yesterday, we couldn't comfortably open a long position because the move was too vertical and fast, which would have forced us into an uncomfortably wide stop loss. Right now, however, price is facing a minor local resistance on the 1-hour chart. We can look to trigger a long position upon a clean breakout above $65,041, placing our stop loss just below the $64,492 support level (which was yesterday's resistance flipped into support).
Short Scenario: For shorts, if price aggressively reverses back down on the 4-hour chart, we can officially classify yesterday’s breakout as a fakeout. If this bearish reversal occurs, I will wait for a proper market structure to develop on the 1-hour timeframe and look to trigger a short position upon a confirmed breakout below $63,801.7.
As always, keep in mind that volume confirmation is required for both setups. I hope you enjoyed today's analysis and find it useful. Never forget to prioritize your risk and money management! Nifty Analysis EOD – 15 July, 2026 – Wednesday🟢 Nifty Analysis EOD – 15 July, 2026 – Wednesday 🔴
Bull Trap Wednesday: Nifty’s 132-Point Surge Fizzles at the 24,200 Zone
🗞 Nifty Summary
Nifty opened with a gap-up of around 50 points and, right from the first tick, added a sharp 132 points more — climbing to test the 24,200 ~ 24,175 zone. For most of the mid-session, the index stayed rangebound, grinding within a tight 25–30 point range that eventually shrank further to just 15–20 points. That range gave way at 12:15 PM, but the real move came a little later — at 12:53 PM, Nifty dropped 138 points in under five minutes, straight into the previous day’s low.
The day low was marked at 24,010, and from there Nifty recovered 96 points, closing at 24,073.45 — right near the IBL.
The session had the feel of a bull trap, though not a clean one, since price didn’t close below the PDL. Both sides got their opportunity today, but full moves were rare — the kind of day where most trades ended before they could fully breathe.
On the daily candle, it’s another doji — and compared to yesterday’s candle, today prints an outside bar. But zoom out to Monday’s candle, and today is still an inside bar relative to that range. Either way, it looks like consolidation is still playing out, just at a wider range than it appears at first glance.
🛡 5 Min Intraday Chart with Levels
📉 Daily Time Frame Chart with Intraday Levels
🕯 Daily Candle Breakdown
Open: 24,085.85
High: 24,220.35
Low: 24,010.55
Close: 24,078.50
Change: +26.45 (+0.11%)
🏗️ Structure Breakdown
Type: Doji with slight bullish close — indecision printed across the full session
Range: ≈ 210 points — moderate volatility
Body: ≈ 7 points — nearly no net commitment from either side
Upper Wick: ≈ 142 points — supply came in hard near the 24,200 zone
Lower Wick: ≈ 68 points — some demand emerged at the day low, but recovery was limited
🛡 5 Min Intraday Chart
⚔️ Gladiator Strategy Update
ATR: 249.91
IB Range: 149.10 → Medium
Market Structure: Balanced
Trade Highlights:
10:27 Short Trade: Target Hit (R:R 1:2.28)
12:27 Short Trade: Target Hit (R:R 1:5.48)
14:27 Long Trade: Exit in minor loss (time over)
Trade Summary: Two shorts, both targets hit — the system did its job on the short side today. The 12:27 trade in particular gave a clean 1:5.48, which is the kind of move that doesn’t show up every session. The afternoon long didn’t quite work out — exited in a minor loss as time ran out, which is the right thing to do rather than holding past the window. A decent day overall; the discipline of exiting on time is as much a part of the process as hitting targets.
🧱 Support & Resistance Levels
Resistance Zones: 24,160 ~ 24,200 | 24,260 | 24,300 | 24,360 ~ 24,380
Support Zones: 24,030 | 23,975 | 23,900 | 23,785 | 23,630
🧠 Final Thoughts
“A trap needs bait, and today the bait was a gap and run — the wise ones waited for the Levels.”
Today’s session was a reminder that not every gap-up is an invitation. The early push to 24,200 looked promising, but price couldn’t hold it — and what followed was swift enough to catch anyone off guard who was still thinking bullish.
For tomorrow, the 24,160 ~ 24,200 zone is the one to watch on the upside. If Nifty can reclaim and hold above that area, there might be another attempt at higher levels. Below, 24,030 is the first meaningful support — a break of that could bring 23,975 into play fairly quickly.
The day gave opportunities on both sides, but the real edge came from reading what the range was saying before it broke. Tomorrow might offer similar setups — the plan is to stay patient, let the IB form, and not assume direction from the open.
✏️ Disclaimer
This is my personal digital diary and represents my own analysis and point of view. It is not financial advice; please consult a professional advisor before making any trading decisions.  Long
Long
How to Trade Gap Fill in Gold XAUUSD Trading (complete strategy)
Today, I will teach you a profitable strategy to trade gaps on Gold.
I will explain how to predict the exact moment of a gap fill and how to identify an accurate confirmation entry signal.
Take notes, and let's get started.
I wanna start with explaining why gaps on Gold occur.
Most of the gaps that you will see trading Gold are opening gaps.
The ones that form exactly after the market opens after the weekend.
They happen because of the occurrence of impactful events while the market is closed.
The market makers are trying to price in this news, creating a gap.
Now, let's briefly discuss the main elements of the gap.
That's a gap up.
The level where the last candle closed before it was formed is called gap opening level.
The level where the first candle opened is called gap closing level.
The area between gap opening and closing levels is a gap itself.
Most of the gaps are filled , meaning that the price will likely return to a gap opening level shortly.
That's how a gap up opening fill looks.
And that's a gap down structure.
As a gap up, we will expect that it will be filled with Gold price rising to a gap opening level.
The main problem is to predict when exactly a gap is going to get filled.
Very ofter then price will pass a substantial distance before returning to a gap opening level.
This strategy will help you to accurately predict that event and identify a potential reversal zone.
After a formation of a gap down opening, wait for a test of a liquidity zone. I suggest using this model on 1H or 4H time frames.
Then, you will need to wait for a c onsolidation and bullish accumulation .
The price should start respecting some minor resistance.
Your signal that the market is ready to fill a gap is a breakout of a resistance and a candle close above that.
Open buy trade immediately or on a retest of a broken resistance.
Set stop loss below the lows of the consolidation.
Your take profit will be a couple of pips below a gap opening level.
The same model and strategy will be used for trading gap up opening.
Above is the example of trading gap down with this strategy.
After a formation of a gap down opening the price dropped lower and tested a liquidity demand zone.
The price started to consolidate , respecting some minor resistance .
Its breakout and an hourly candle close above that confirmed that Gold is ready to fill this gap.
A trade was opened on a retest of a broken resistance.
SL was set below the low of a consolidation.
TP was a couple of pips below the gap opening level.
And the trade reached the target.
Gaps always provide profitable opportunities in Gold trading.
Recognizing the exact moment to enter is the key in making good money with gaps.
I hope this strategy will help!
❤️Please, support my work with like, thank you!❤️
I am part of Trade Nation's Influencer program and receive a monthly fee for using their TradingView charts in my analysis. Education 
 Long
Long
XAU/USD Long Trading PlanXAU/USD Long Trading Plan
Basic Information
• Trading Instrument: XAU/USD (Spot Gold vs US Dollar)
• Trading Bias: Bullish, Long Entry
• Planned Entry Price: Approximately 4041.920
Core Risk Control Settings
• Fixed Hard Stop Loss Level: 4025.000
Multi-Tier Take Profit & Position Management Rules
1. First Target (TP1): 4111.000
Liquidate 50% of the total position, shift stop loss to the break-even price to lock risk-free profit for residual lots.
2. Second Target (TP2): 4200.000
Liquidate 50% of the remaining position, trail the stop loss upward to secure floating gains.
3. Third Target (TP3): 4255.000
Liquidate 50% of the remaining position, further advance the stop loss level upward.
4. Fourth Target (TP4): 4309.000
Carry out partial liquidation, monitor real-time market structure and trail the stop loss forward accordingly.
5. Residual Trailing Position Rule
Hold the last portion of the position, keep dynamically adjusting the trailing stop loss to capture further bullish price movement.
Trading Risk Warning
Spot precious metal trading is accompanied by high price volatility, weekend and overnight gap risks, as well as order slippage risks during drastic market fluctuations. All partial liquidation and stop-loss trailing operations shall be executed strictly based on real-time market quotes. Leveraged gold trading amplifies both potential profits and trading losses significantly.
Disclaimer
This trading plan is prepared solely for personal market analysis reference only and shall not be interpreted as formal financial investment advice, trading solicitation or any profit guarantee. All trading decisions including entry execution, stop-loss placement, take-profit liquidation and position adjustment are independently determined by traders, and all corresponding trading profits and losses shall be fully borne by the traders themselves. The compiler of this document undertakes no legal liability for any losses incurred from referencing this trading plan. Long 
Long 
BTC/USD 30-Minute Short Trading PlanBTC/USD 30-Minute Short Trading Plan
Basic Information
• Instrument: BTC/USD
• Timeframe: 30-Minute Chart
• Trading Bias: Bearish (Short)
• Planned Entry Price: Around 64660.000
Risk Control Parameters
• Fixed Hard Stop Loss Level: 64950.000
Multi-Tier Take Profit & Position Management Rules
1. First Target (TP1): 63500.000
Close 50% of the total position, shift stop loss to break-even price to lock in risk-free profits for remaining lots.
2. Second Target (TP2): 62080.000
Close 50% of the leftover position, further advance the stop loss level downwards.
3. Third Target (TP3): 60980.000
Close 50% of the leftover position, adjust stop loss forward again to secure floating gains.
4. Remaining Trailing Position Rule
Hold the last residual position, keep moving stop loss along with price action to capture additional downward movement.
Trading Risk Warning
Cryptocurrency markets feature extreme price volatility, high leverage risks and unpredictable systemic risks. Severe slippage may hit stop-loss orders during drastic market swings, and partial order execution failures may occur. All position reduction and stop-loss adjustment actions must be executed based on real-time market quotes.
Disclaimer
This trading plan serves solely for personal market analysis reference and shall not be regarded as financial investment advice, trading recommendation or profit commitment of any kind. All trading decisions including entry placement, stop-loss setup, take-profit execution and position adjustment are made solely at the trader’s own discretion. The creator of this plan accepts zero liability for any trading gains or losses arising from referencing this document. Crypto trading carries substantial financial risks, and users shall bear all trading consequences independently.  Short
Short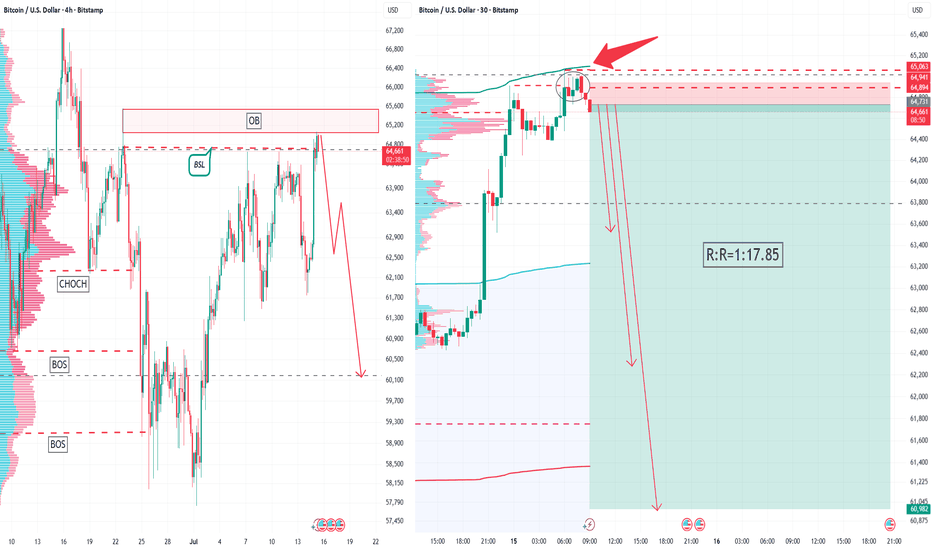
 Long
Long
XAUUSD — Bearish Bias from 4H Supply ZoneTensions between the US and Iran remain high, and soaring oil prices will exacerbate market concerns about inflation, strengthen market expectations for a Federal Reserve rate hike, and significantly suppress gold prices.
From a market structure perspective, gold has formed a series of lower highs along the descending trendline on the 4-hour chart. Even during short-term rebounds, it has consistently failed to break through the descending trendline resistance zone of 4100-4120, indicating that gold remains in an overall downtrend.
The 4-hour chart shows a clear rejection shadow near the supply zone of 4100, suggesting that until the market structure changes, the downside resistance for gold is relatively weak, and gold is more likely to move downwards to the demand zone.
Based on the short-term structural lows, short-term support lies in the 4020-4000-3980 area, which is also the next liquidity zone during any short-term pullback. Once the support in this area is broken, gold may even continue its downward trend, targeting the 3900-3880 area.
Trading Logic:
As long as gold prices remain below the downtrend line, the overall outlook remains bearish.
Trading Strategy:
Preferred Option: Entry: Focus primarily on the 4060-4080 range,with a bearish bias(Invalidation: 4110).
Alternative strategy: Entry: Focus on the 4010-3990 range, with a bullish bias (Invalidation: 3880).
The above is not investment advice, but for learning and communication purposes only! Short 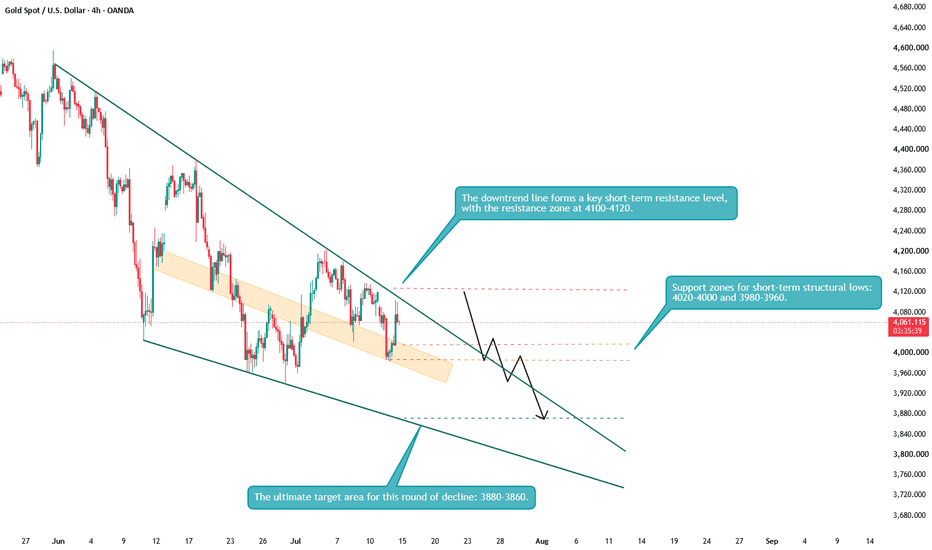
BTC – 1H TF / 5M TF (15M used as a proxy for the 5M analysis.)🧠 Narrative
The market has shifted from a bearish trend into a bullish expansion. After defending the 1H Order Block and forming a double bottom, price reclaimed the previous bearish 1H Fair Value Gap (FVG) and produced a strong Bullish Market Structure Shift (MSS). Today's inflation data acted as a catalyst, but the reversal had already begun through price action. Buyers remain in control after breaking previous lower highs and creating a new bullish imbalance. While the short-term trend is bullish, the 5-minute chart shows momentum beginning to slow as price transitions from expansion into consolidation.
📈 1H Timeframe Analysis
🟢 Price defended the 1H Order Block, confirming strong demand.
🔄 A double bottom formed near the lows, suggesting sellers failed to continue the downtrend.
📈 Price reclaimed the previous bearish 1H FVG, signaling buyers were regaining control.
🚀 A Bullish Market Structure Shift (MSS) occurred after breaking above the previous lower high.
⚡ Large bullish expansion candles with minimal lower wicks indicate aggressive buying pressure.
🟩 A new bullish Fair Value Gap has been created due to the impulsive rally.
📊 Volume expanded significantly during the breakout, confirming the move has strong participation and is in harmony with price.
📉 5-Minute Timeframe Analysis
📈 Price is making higher highs and higher lows, confirming bullish intraday structure.
🚀 The rally formed a stair-step pattern:
Impulse ➜ Consolidation ➜ Impulse ➜ Consolidation ➜ Impulse.
📉 Momentum is beginning to slow as price forms a rounded curve near the highs.
⚖️ Smaller candles and overlapping price action suggest a transition from expansion into acceptance, rather than another immediate impulse.
🔄 This consolidation allows moving averages to catch up and may help fill part of the newly created imbalance before another move.
📊 Volume Analysis:
📈 Volume increased dramatically during the breakout, confirming institutional participation.
🟢 High bullish volume accompanied the strongest expansion candles, showing harmony between price and volume.
📉 As price consolidates near the highs, volume is decreasing, which is normal during pauses after strong impulsive moves.
⚠️ Watch for another increase in volume to confirm the next directional move.
🎯 Key Levels:
🔴 Resistance
65,000 psychological resistance.
Current session high.
🟢 Support:
New Bullish 1H Fair Value Gap.
Previous breakout structure around 63,800–64,000.
1H Order Block below.
Previous double-bottom low.
👀 What to Watch Today:
✅ Does price hold above the new bullish FVG?
✅ Does the current consolidation break higher with increasing volume?
✅ Does price continue making higher highs and higher lows?
⚠️ If price loses the bullish FVG with strong bearish volume, expect a deeper retracement toward the breakout area before buyers may step back in. Short 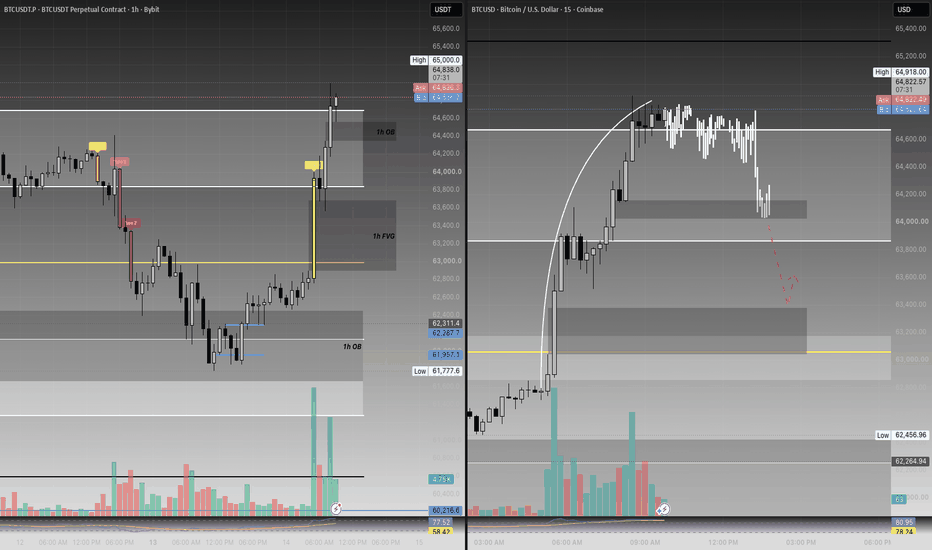
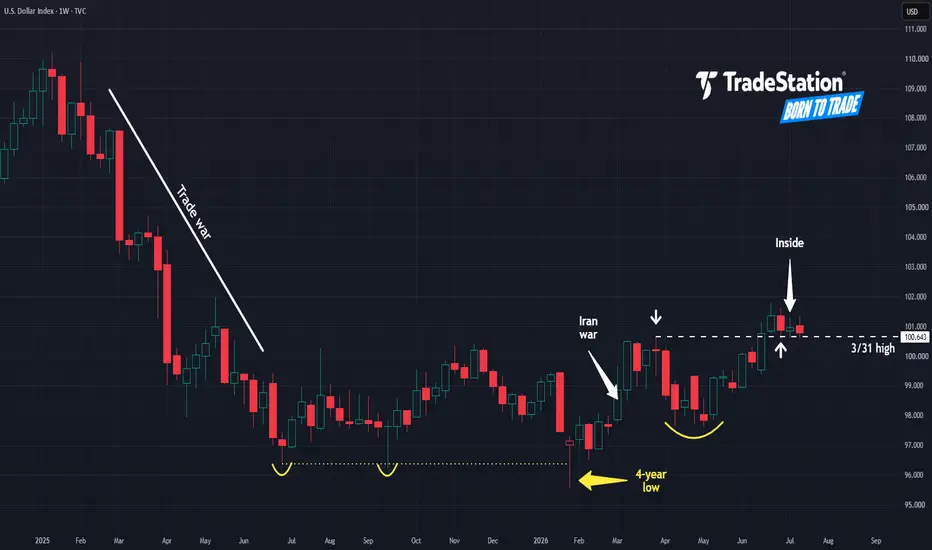
Greenback Might Be RisingThe U.S. Dollar Index has been stable for more than a year, but now it might be rising.
The first pattern on today’s weekly chart is the long basing pattern since mid-2025. (Notice the lows marked in yellow.) Last year’s series of lows above 96 is a potential double bottom. DXY probed below 96 in January (making a four-year low) but quickly rebounded. That might be viewed as a false breakdown.
The Iran War drove it higher in March, followed by a pullback and higher low in April and May. Those formations could be consistent with long-term bottoming.
Second, DXY peaked at 100.643 on March 31. It pushed above that level last month, followed by a pullback and retest in subsequent weeks. Has old resistance become new support?
Third, last week ended positive with a higher low and lower high. Such a bullish inside candle may confirm its direction is now pointing upward.
TradeStation has, for decades, advanced the trading industry, providing access to stocks, options and futures. If you're born to trade, we could be for you. Learn more here about TradingView’s Broker of the Year!
Past performance, whether actual or indicated by historical tests of strategies, is no guarantee of future performance or success. There is a possibility that you may sustain a loss equal to or greater than your entire investment regardless of which asset class you trade (equities, options or futures); therefore, you should not invest or risk money that you cannot afford to lose. Online trading is not suitable for all investors. View the document titled Characteristics and Risks of Standardized Options at www.TradeStation.com . Before trading any asset class, customers must read the relevant risk disclosure statements on www.TradeStation.com . System access and trade placement and execution may be delayed or fail due to market volatility and volume, quote delays, system and software errors, Internet traffic, outages and other factors.
Securities and futures trading is offered to self-directed customers by TradeStation Securities, Inc., a broker-dealer registered with the Securities and Exchange Commission and a futures commission merchant licensed with the Commodity Futures Trading Commission). TradeStation Securities is a member of the Financial Industry Regulatory Authority, the National Futures Association, and a number of exchanges.
TradeStation Securities, Inc. and TradeStation Technologies, Inc. are each wholly owned subsidiaries of TradeStation Group, Inc., both operating, and providing products and services, under the TradeStation brand and trademark. When applying for, or purchasing, accounts, subscriptions, products and services, it is important that you know which company you will be dealing with. Visit www.TradeStation.com for further important information explaining what this means. Long 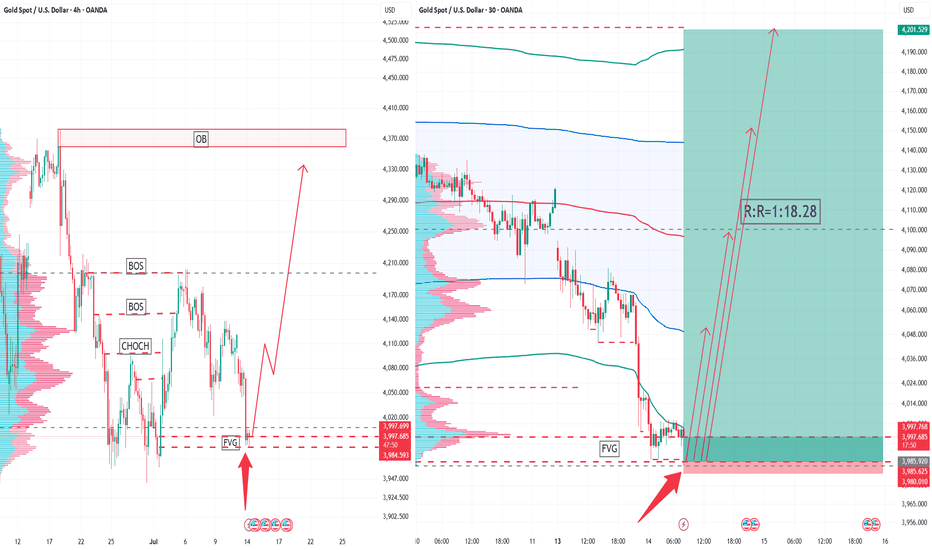
Bitcoin Daily Analysis 14 July 2026Hi everyone! Let’s dive into today’s Bitcoin analysis.
Since we covered the monthly and weekly structures in detail yesterday, we will go straight to the daily timeframe. Yesterday's (Monday's) daily candle closed with a highly robust bearish body. However, it also left noticeable shadows on both the top and bottom, which prevents us from fully confirming absolute bearish dominance. If those shadows had been smaller—especially on the selling side—our overall chart bias would have shifted significantly.
Macro/Fundamental Outlook
For today's analysis, I intentionally waited for the CPI data to be released before writing. The numbers came in lower, indicating easing inflation. This aligns with a reduction in the Federal Reserve's contractionary pressures and hints at a potential pivot from their high interest rate stance. Consequently, this signals an injection of strength into riskier asset classes over bonds and cash—at least in the short term.
Of course, given that the world is currently navigating massive geopolitical, economic, and technological conflicts, it is still too early to make definitive calls on the medium-to-long-term macroeconomic outlook. However, for the immediate short term, we now know that risk assets like cryptocurrencies are likely poised for a bullish bounce.
4-Hour & 1-Hour Timeframes (Execution)
Dropping down to the 4-hour chart, after the bearish leg originating from the $64,396.5 resistance, price managed to print a new higher low before reaching its previous 4-hour swing low. Following the CPI release, it then printed a sharp, impulsive move to the upside.
We can map out a few execution scenarios here:
Long Scenario A (Preferred): If price consolidates and builds a local structure—such as a tight 1-hour trading range (box) or a local higher high/higher low—before reaching the key $64,396.5 resistance, I will look to enter on a breakout of that local range. This is my preferred setup, as it will likely offer an easier entry with a much tighter, logical stop loss.
Long Scenario B: Alternatively, we can wait for price to react to the $64,396.5 resistance level and trigger a long on a subsequent breakout. However, given how aggressively price battled in this zone over the past few days, the risk of getting caught in a fakeout or missing the move is quite high here because it is a highly significant resistance area.
Short Scenario: For shorts, we must wait for a deeper pullback. I will only look to trigger a short position if price breaks and confirms below the $61,910.2 support level.
For all of these scenarios, volume confirmation is an absolute must. Also, keep in mind that even if the market begins to trend cleanly, high-impact news can easily cause sudden, massive shadows that wipe out stops before reversing. Therefore, it is highly recommended to keep your trade risk lower than usual during these volatile days.
I hope you enjoyed today's update and find it useful. As always, make sure to keep your risk and money management in check!

 Short
Short