KOSPI : Bull Trap or Continuation Rally ?TVC:KOSPI
📈 Korea's "Talk of the Town" Index at a Critical Inflection Point — Breakout or Bull Trap? 🇰🇷
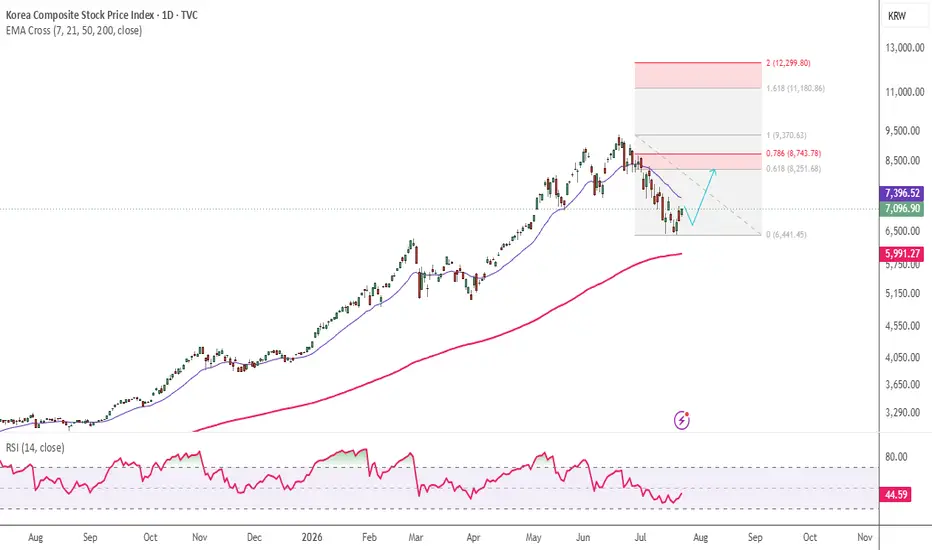
After forming a convincing double bottom near the 6,440 zone, the index has staged a healthy rebound and is now approaching the 20-day EMA, a key dynamic resistance level that could determine the next major trend.
The coming weeks may define whether this recovery evolves into a sustained uptrend—or proves to be another relief rally.
🔍 Technical Outlook
The recent double-bottom formation suggests buyers have successfully defended a major support zone, improving short-term market sentiment.
However, the real test begins now.
📌 A sustained move above the 20 EMA would strengthen the bullish case and could open the door toward the 0.618 Fibonacci retracement zone around 8,250–8,500.
This area represents a major technical resistance and a likely profit-taking zone.
⚠️ Make-or-Break Zone
The 8,250–8,500 region will be the most important level to monitor.
If price forms a Lower High (LH) within this resistance zone, it would indicate that sellers remain in control and many traders may choose to reduce exposure by selling into strength.
This would increase the probability of another leg lower.
🏭 KRX:005930 Samsung & KRX:000660 SK Hynix Hold the Key
The performance of Samsung Electronics ( KRX:005930 ) and SK Hynix ( KRX:000660 ) will likely play a decisive role in determining the index's direction.
As two of the largest constituents, any disappointing earnings, weakening semiconductor demand, or negative macroeconomic developments could significantly impact market sentiment at this critical technical level.
📉 Bearish Scenario
Failure to reclaim and sustain above the resistance zone could weaken investor confidence.
In that case, the index may gradually retrace toward the 200-day EMA, currently positioned near the 6,000 level, where long-term buyers may look for renewed opportunities.
🚀 Bullish Scenario
On the other hand, if the index successfully clears 8,500 with strong momentum, expanding volume, and broad market participation, it would confirm a structural breakout.
The next major objective would be the 1.618 Reverse Fibonacci Extension, projecting a potential upside target near 11,000.
📊 My View
The index has reached a high-stakes technical decision point.
✅ Hold above the 20 EMA → Bullish momentum strengthens.
✅ Break above 8,500 → Opens the path toward 11,000.
❌ Rejection and a Lower High → Raises the probability of a decline toward the 200 EMA near 6,000.
This is a classic risk-versus-reward zone where technicals and fundamentals are likely to converge.
Will this recovery evolve into the next major bull leg, or is the market setting up another bull trap? Share your outlook below. 👇
🔖 Hashtags
#KOSPI #KoreaStockMarket #KRX #SamsungElectronics #SKHynix #Semiconductor #TechnicalAnalysis #TradingView #PriceAction #MarketStructure #DoubleBottom #EMA20 #EMA200 #Fibonacci #ReverseFibonacci #Breakout #BullTrap #SupportAndResistance #SwingTrading #TrendFollowing #MarketAnalysis #StockMarket #Investing #TradingIdeas #ChartAnalysis #MarketOutlook #WiSHFundManagement
Fibonacci
Nifty Analysis EOD – 23 July 2026 – Thursday🟢 Nifty Analysis EOD – 23 July 2026 – Thursday 🔴
Band’s Edge: Tests the 23,815 Floor Twice Before Settling at 23,872
🗞 Nifty Summary
Nifty opened with a gap down of 83 points, finding its footing near the key support zone of 23,900. After the opening tick, the index dropped another 31 points before finding a base and gradually climbing towards gap filling. Around 11:00 AM, that gap-filling process completed — and that’s when things got interesting. Constant selling pressure at the day high dragged Nifty nearly 180 points below the IBL, marking a new day low at the support level of 23,815. A recovery of about 80 points followed, but from the IBL again, selling pressure pushed sharply below the day low. The same 23,815 level came to the rescue once more, and another 82-point recovery brought the index to close the day at 23,872.20, with an adjusted close of 23,869.60.
What’s notable is that Nifty tested the bottom of the band created by the 8th July candle — which means we’re still technically inside this range. But it’s looking increasingly fragile. As I write this, Gift Nifty is showing around 140 points down and Brent Crude is up 1.5% from our market close. Another gap down seems likely — we’ll see where we open tomorrow.
The day closed with a bearish candle sitting right at a crucial stage — the real question is whether Nifty can sustain above 23,825 or whether the gap below gets filled. That answer comes tomorrow. One thing I'm keeping in mind though: we're under geopolitical tension right now, and most of what we're seeing on the chart is being driven by news and fear rather than clean technicals. So I don't want to build a bias here — I'll try to stay with the flow, not against it.
🛡 5 Min Intraday Chart with Levels
📉 Daily Time Frame Chart with Intraday Levels
🕯 Daily Candle Breakdown
Open: 23,904.80
High: 23,990.75
Low: 23,807.20
Close: 23,869.60
Change: −126.65 (−0.53%)
🏗️ Structure Breakdown
Type: Bearish candle with recovery wicks — sellers in control but support held twice
Range: ≈ 183 points — moderate volatility
Body: ≈ 35 points — light body reflecting tug-of-war between sellers and buyers near close
Upper Wick: ≈ 86 points — supply stepped in early; the day high didn’t hold long
Lower Wick: ≈ 62 points — demand showed up at 23,815 not once but twice
🛡 5 Min Intraday Chart
⚔️ Gladiator Strategy Update
ATR: 224.19
IB Range: 88.75 → Medium
Market Structure: ImBalanced
Trade Highlights:
09:45 Long Trade: Target Hit (R:R 1:1.68)
11:11 Short Trade: Target Hit (R:R 1:5.44)
Trade Summary: Both trades hit their targets — clean execution, good R:R on the short especially. After two solid wins, I didn't want to give back the gains, so I closed the day early and ignored the further signals the system gave. Sometimes protecting what you've made is the right call.
🧱 Support & Resistance Levels
Resistance Zones: 23,920 | 23,975 | 24,030 | 24,100
Support Zones: 23,835 ~ 23,785 | 23,630
🧠 Final Thoughts
“When the news writes the chart, fighting the tape is just expensive stubbornness.”
Nifty defended 23,815 twice today, and that’s worth noting. Both times the index was pushed below the IBL and both times buyers showed up at the same spot. That kind of double-test at a level usually means something — either it’s strong enough to matter, or the third visit breaks it for good.
Looking at tomorrow, the 23,835 ~ 23,785 zone is the immediate cushion. If that holds through the open, there may be a case for stabilisation. But if Gift Nifty’s 140-point gap down signal plays out, we might open right below that zone — and then the next meaningful support sits further down at 23,630. Resistance up at 23,920 and 23,975 will be the first walls to watch if any recovery attempt happens.
I’ll wait to see how we open before forming any view. A gap-down open into support is not the same as a breakdown — but it’s not something to step in front of without confirmation either. Patience before position tomorrow.
✏️ Disclaimer
This is my personal digital diary and represents my own analysis and point of view. It is not financial advice; please consult a professional advisor before making any trading decisions.
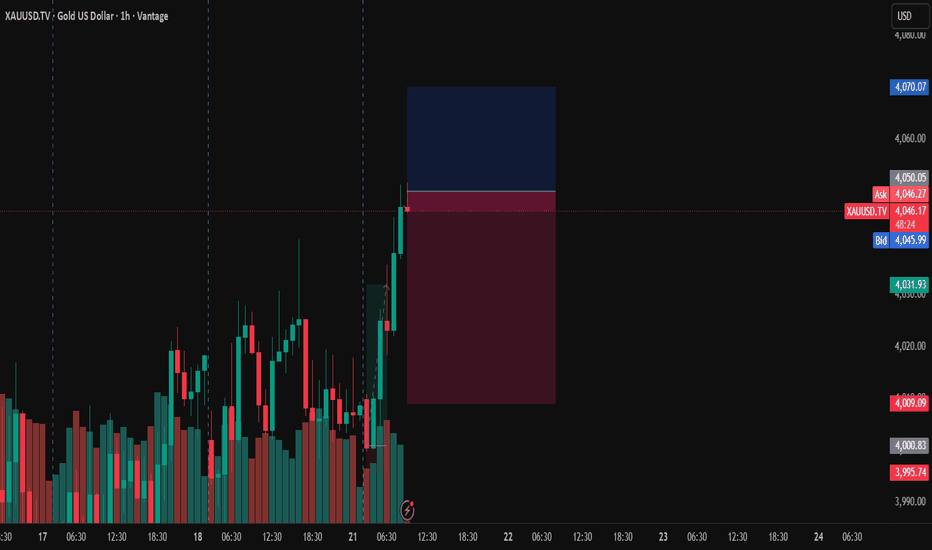
XAUUSD (1H) - Bearish SetupGold has rallied into a key resistance zone after a strong bullish impulse, but I believe the upside is becoming limited. Price is now approaching an area where sellers could step back in.
My bearish thesis:
Price is trading near a significant resistance level.
The recent move looks overextended on the 1H timeframe.
I'm expecting a rejection from this zone, which could lead to a corrective move lower.
Risk is clearly defined above the recent swing high.
Trade Idea:
Bias: Bearish
Entry: Around the current resistance zone
Stop Loss: Above the recent high (~4070)
Target: Around 4006 (as shown on the chart)
Risk-to-Reward: Approximately 1:2
Trade Management:
✅ Once the trade reaches 1:1 Risk-to-Reward, I'll move my Stop Loss to Break-Even (Entry) to protect capital.
🎯 Then I'll let the remaining position run toward the final target.
I'll be watching for bearish confirmation before adding to the position. If buyers manage to break and hold above resistance zone, this setup becomes invalid.
Always manage your risk. This is my personal analysis, not financial advice.
#XAUUSD #Gold #Forex #TradingView #PriceAction #TechnicalAnalysis #Bearish #RiskManagement
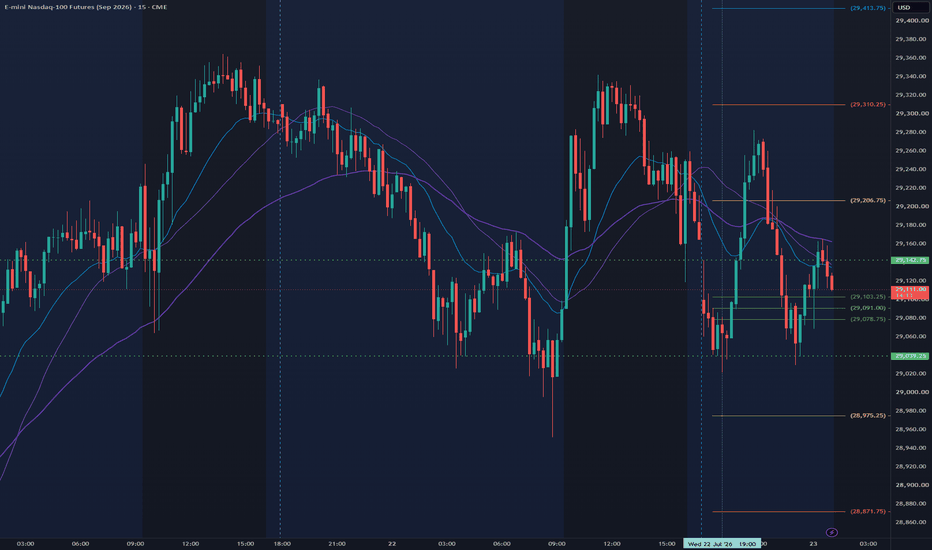
NQ Power Range Report with FIB Ext - 7/23/2026 SessionCME_MINI:NQU2026
- PR High: 29142.50
- PR Low: 29039.25
- NZ Spread: 231.0
Key scheduled economic events:
08:30 | Initial Jobless Claims
Session Open Stats (As of 12:15 AM)
- Session Open ATR: 640.45
- Volume: 53K
- Open Int: 287K
- Trend Grade: Short
- From BA ATH: -6.3% (Rounded)
Key Levels (Rounded - Think of these as ranges)
- Long: 31904
- Mid: 29517
- Short: 27131
Keep in mind this is not speculation or a prediction. Only a report of the Power Range with Fib extensions for target hunting. Do your DD! You determine your risk tolerance. You are fully capable of making your own decisions.
BA: Back Adjusted
BuZ/BeZ: Bull Zone / Bear Zone
NZ: Neutral Zone
WTI crude oil Wave Analysis – 22 July 2026
WTI crude oil: ⬆️ Buy
- WTI crude oil rising inside impulse wave 3
- Likely to rise to resistance level 90.00
WTI crude oil recently broke the resistance zone between the resistance level 80.00 (former strong support from April) and the 38.2% Fibonacci correction of the downward impulse from March.
The breakout of this resistance zone accelerated the active impulse wave 3 of the intermediate impulse wave (C) from July.
WTI crude oil can be expected to rise to the next resistance level 90.00, target price for the completion of the active impulse wave 3.
GBPJPY LONGExpecting continuation to the upside and the bulls have control for now. we have tapped the 217.500 psychological level and made a wick back up, i'm looking at a close near our support of 217.500 before bullish momentum continues. this also gives us a better entry point and minimises risk.
If you want to be more aggressive you can enter now at price at 218.100 this still gives us a 2/1 rr.
219.500 tp1
220.000 tp2
NZDUSD new downswing upcoming ??Overall structure:
Broadly the structure is bearish as price is forming lower highs and lower low, and had got multiple rejections form the major bearish trendline, on the other hand we can see a bullish trendline intact, supporting up-moves and continuously making higher lows.
Current situation:
After a big decline when price was showing a corrective rally it has started to face rejections from the level of 0.5872 which is currently acting as strong resistance & it seems like the pullback is over now and it's likely to reverse back in the lower direction, and continue its down-move, if current consolidation gives a breakout in the bearish direction then, we'll have a good opportunity to take fresh short entry and can target the level of 0.5655.
Immediate resistance is at 0.5872 & the breakout level of the consolidations is at 0.5801
Outlook remain on the bearish to sideways direction, only sell trades should be preferred at resistance levels.
For Educational Purposes only, Not an Investment Advice, Always use strict Risk management measures.
Regards CrazyTrades247.
CIFR: BC Retest Complete — Are We Heading to Point C?Underpinning the bullish technical bounce at the BC zone is Cipher’s aggressive transformation from a pure-play Bitcoin miner into a high-performance computing (HPC) and AI data center provider. The company has secured over $11.4 billion in contracted revenue through long-term leases with major hyperscalers, including landmark 10-to-15-year hosting agreements backed by Google/Fluidstack and Amazon Web Services (AWS). This transition provides high-margin, predictable cash flows that significantly de-risk the company's macro growth outlook compared to pure crypto mining volatility.
Cipher’s development pipeline is heavily supported by institutional debt markets rather than aggressive equity dilution. Recent major capital milestones—including an $810 million senior secured notes offering for its Stingray facility and a $200 million revolving credit facility supported by global banks—ensure primary gigawatt-scale data center builds like Barber Lake and Black Pearl remain on track to go operational through late 2026.
Wall Street institutional consensus strongly aligns with the chart's $52–$62 macro expansion target for Point (C). Major investment firms like Morgan Stanley hold price targets near $47–$48.50, with multi-year fundamental valuation models pointing toward $50 to $80 as contracted hyperscaler revenue ramps up into 2027. This fundamental backing provides the institutional tailwind needed for a breakout above $30 to follow through toward the Point (C) target box.
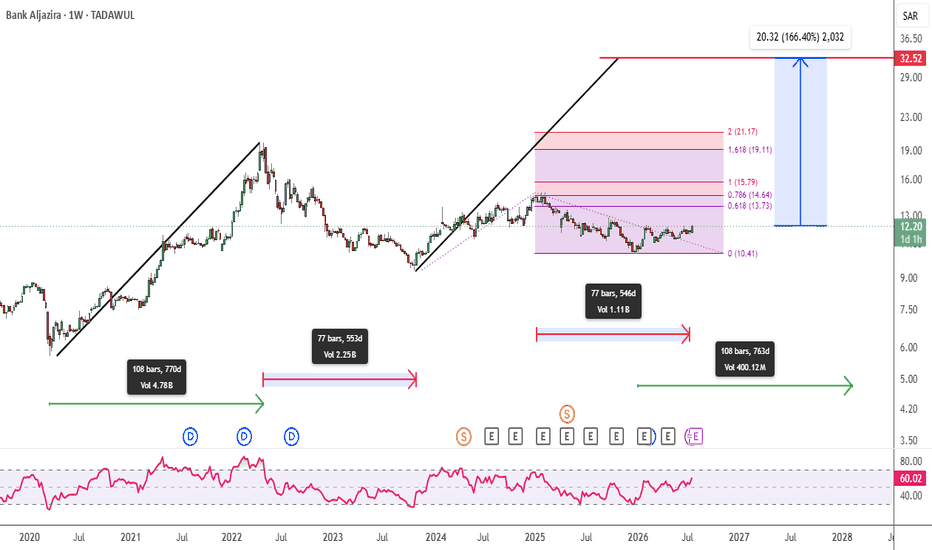
Bank Al Jazira : BUILDING SOMETHING MUCH BIGGER !!TADAWUL:1020
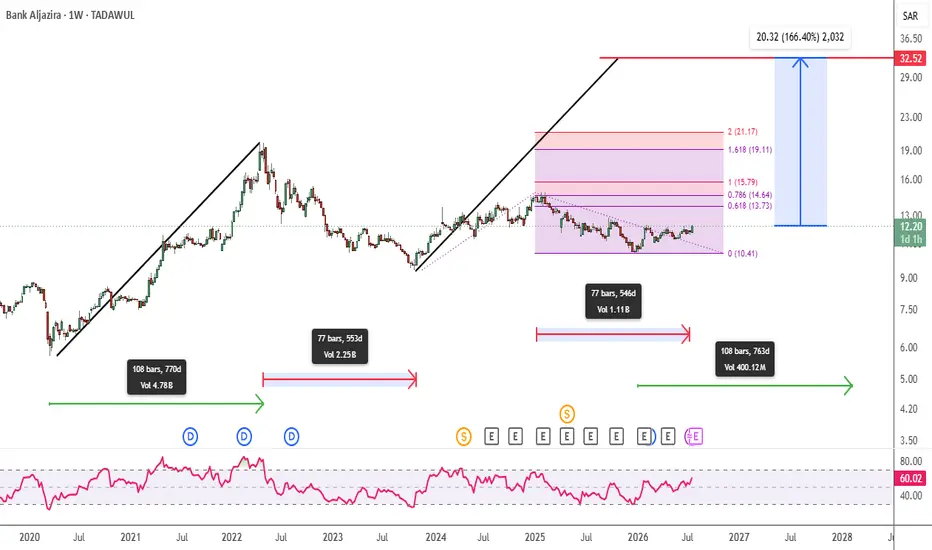
The weekly market structure remains exceptionally strong—and the immediate upside levels are clearly defined:
🎯 14.60
🎯 15.50
🎯 19.11
But zoom out… and the bigger picture becomes even more interesting. 👀
The broader structure appears to be developing into a major AB=CD harmonic pattern.
If the pattern completes as projected, the potential long-term target could reach approximately:
🔥 32
Yes… 32.
Now let's look at the time cycles. ⏳
The first major bullish leg developed over approximately 108 weeks.
That was followed by a correction lasting around 77 weeks.
Afterward, price entered an extended correction and consolidation phase.
Then, in January 2026, price retraced toward the previous low around 9.45—effectively retesting a major historical support zone.
Since then?
📈 Higher Highs.
📈 Higher Lows.
📈 Improving weekly market structure.
The next major test is now critical:
➡️ Can price sustain above the weekly EMA 200?
The EMA 200 is currently positioned around the current market price, making this a major technical decision zone.
If price successfully holds above this level, the bullish continuation thesis becomes significantly stronger.
And here's where the time-cycle analysis becomes interesting…
When comparing the historical duration of the previous:
🔹 Uptrend
🔹 Correction
🔹 Consolidation phase
🔹 Breakout
the current structure appears to be building positive momentum toward the projected targets.
If the current cycle continues to develop in a similar manner, the larger move could potentially mature around February 2028. 🚀
📌 The setup is simple:
Hold the weekly EMA 200 → Maintain the HH-HL structure → Target the projected upside levels.
The short-term targets are visible.
The long-term pattern is even more interesting.
But the real question is:
🔥 Are we witnessing the early stages of a much larger bullish expansion?
What do you think? 🚀
Share your analysis in the comments 👇
#TechnicalAnalysis #PriceAction #MarketStructure #ABCDPattern #HarmonicPattern #EMA200 #HigherHighs #HigherLows #BullishTrend #TrendFollowing #SwingTrading #StockMarket #TradingIdeas #TradingView #ChartAnalysis #Fibonacci #LongTermInvesting #Breakout #BullishSetup #MomentumTrading #Investing #TradingStrategy #TechnicalTrading #WiSHFundManagement
INTEL: AI bubble burst?INTEL may be one of the first AI stocks to be sending warning signals.
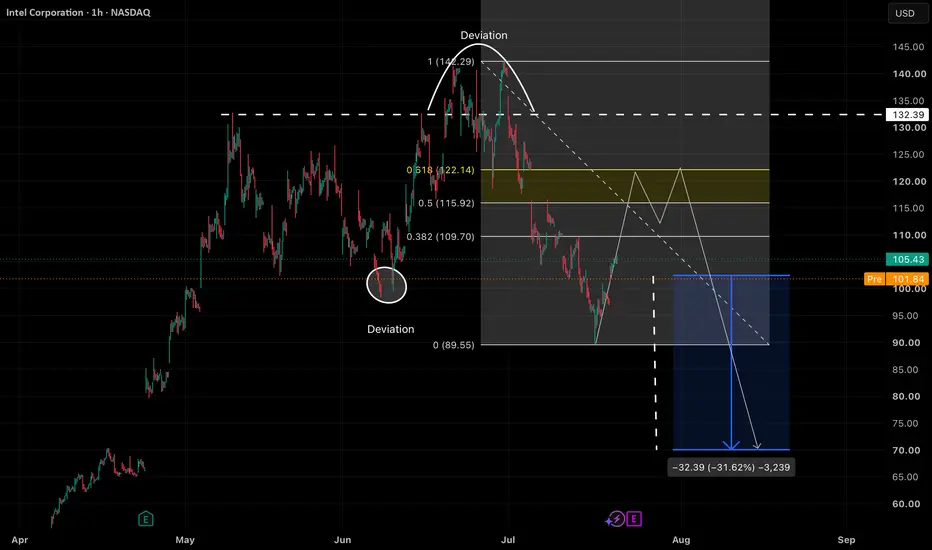
Looking at the price of INTEL, the major top made near 140$ was rejected straight away with a double top rejection. This suggests that the move up was a deviation , a fakeout to take out liquidity before the start of the major leg to the downside. This idea is supported with the break of structure below 99$ which marked the first major shift from bullish to bearish.
Now areas to mark out for potential retracement before move down is the golden pocket 618 level.
If the bear case plays out , taking a measure from the 132$ towards the downside support area , our next target areas come at the 70$ , a 30% decline from current levels.
If this plays out , this would be a major move. So watch out on the levels , the 618 and the reaction.
Hope you liked the analysis. Make sure to follow for more.
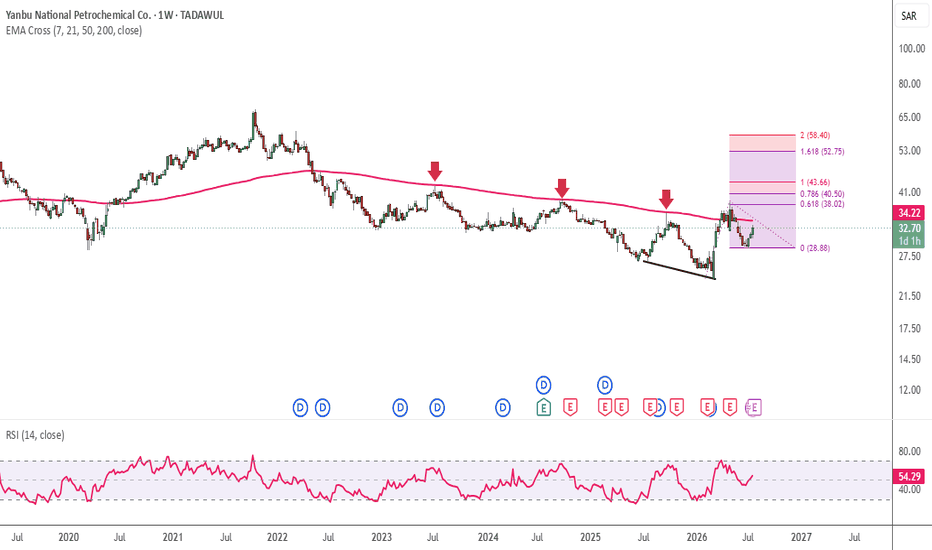
Yanbu National PetroChem : Is the Next Leg Up Forming ?TADAWUL:2290
📈 EMA 200 Retest + Bullish Divergence: Is the Next Leg Up Forming?
Price is now approaching the 200-week EMA at 34.23—a level that has historically acted as a major decision zone.
Looking at previous price behavior, the asset has repeatedly struggled to sustain above the 200-week EMA and experienced significant pullbacks around:
🔹 July 2023
🔹 October 2024
🔹 September 2025
🔹 April 2026
However, the current setup is showing some important differences.
The weekly chart has formed a bullish divergence, followed by a strong recovery. From the previous week's high, price advanced approximately 43%—while the weekly low-to-high measurement represents a total move of nearly 61%.
Following that advance, price once again failed to sustain above the 200-week EMA and entered a corrective phase, eventually declining toward 29.
This level is particularly significant as it represents the 0.618 Fibonacci retracement zone of the major swing from 24 to 38.7—a classic discounted accumulation area.
💡 Why this setup is interesting:
In my experience, the combination of:
✅ Bullish weekly divergence
✅ Formation of a higher low
✅ Price holding above the 200-week EMA
✅ A confirmed discounted Fibonacci retracement
✅ Positive market structure
can create a powerful confluence for the next potential expansion phase.
Using the Fibonacci Extension tool, the initial upside projections currently point toward:
🎯 43
🎯 52
These levels represent the first major upside objectives if the bullish structure remains intact and price successfully sustains above the key EMA 200 zone.
📌 The key question now is not whether price can rally—but whether it can finally sustain above the 200-week EMA.
📌 In case of rejection from Ema200, price may reverse towards 27-26 price zone.
A successful breakout and hold could significantly strengthen the bullish continuation case.
⚠️ As always, this is a technical analysis perspective—not financial advice. Key support and invalidation levels should be monitored closely.
#TechnicalAnalysis #PriceAction #BullishDivergence #EMA200 #Fibonacci #FibonacciRetracement #FibonacciExtension #HigherLow #MarketStructure #SwingTrading #TrendAnalysis #StockMarket #TradingIdeas #TradingView #Investing #TechnicalTrading #Breakout #BullishSetup #MomentumTrading #LongTermInvesting #TradingStrategy
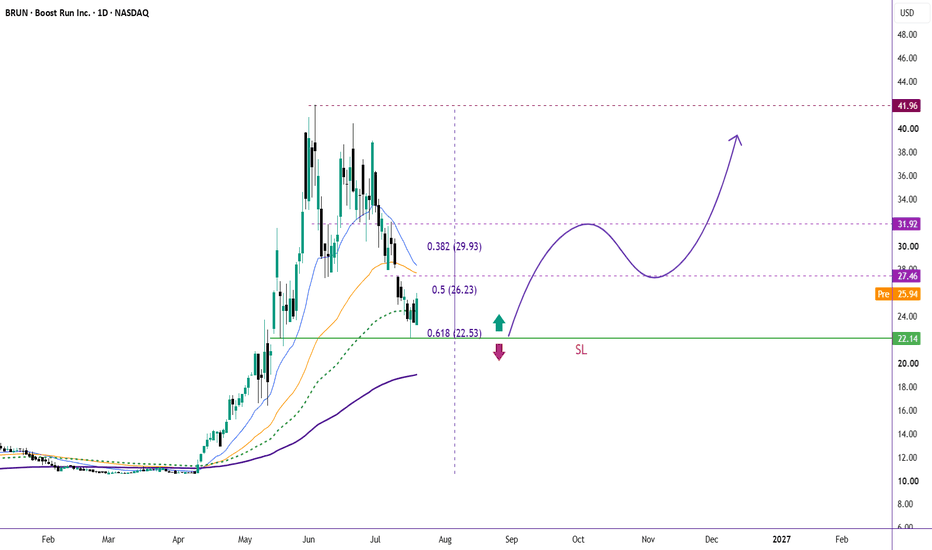
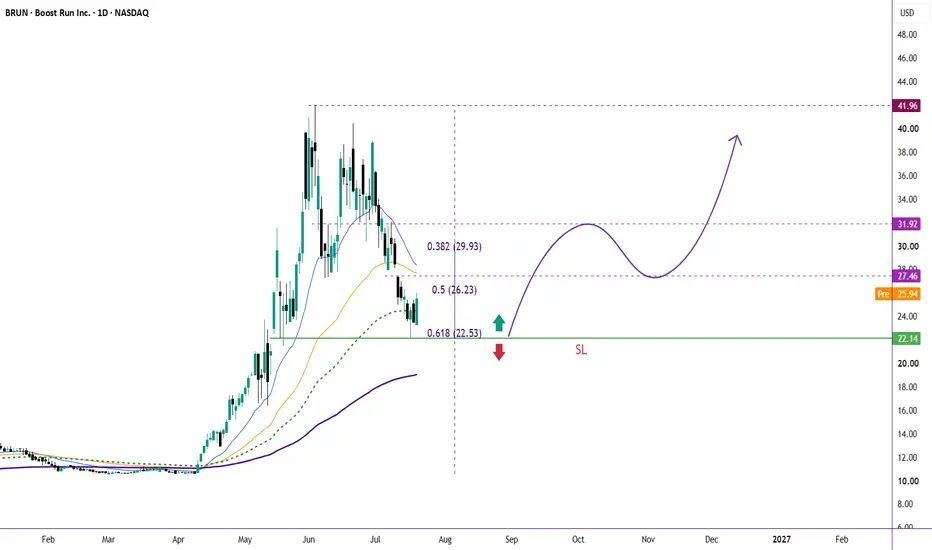
BRUN: Golden Pocket Rebound or More Pain Ahead?Another chart. Another story.
BRUN has delivered an impressive rally from around $10 to a high near $42, rewarding trend followers with a massive move. As expected after such an explosive run, the stock entered a healthy correction phase.
The interesting part? That correction has now reached a high-confluence support zone.
📖 The Story
After the rally, BRUN has retraced into the Fibonacci Golden Pocket (0.5–0.618), with the 0.618 level near $22.5 aligning almost perfectly with horizontal support around $22.1.
At this key level, buyers stepped in aggressively, printing a Bullish Engulfing candle—often an early sign that demand is returning after a pullback.
This is exactly the type of price action swing traders like to see:
🟢 Healthy retracement into the Golden Pocket
🟢 Strong horizontal support
🟢 Bullish Engulfing candle at support
🟢 Favorable risk-to-reward if support holds
While no setup is guaranteed, the odds now favor a relief rally as long as this support remains intact.
🎯 Bullish Targets
🎯 $27.5 – First resistance (0.5 Fib)
🎯 $30.0 – 0.382 Fib resistance
🎯 $32.0 – Major resistance
🚀 $42.0 – Previous swing high
A decisive break above these levels could put BRUN back on track to retest its highs.
❌ Invalidation
A daily close below $22.1 would invalidate this bullish thesis and suggest the correction isn't over yet.
NZDJPY | Bearish Expansion ExpectedTechnical Strategy & Execution Plan
A high-probability bearish setup is developing on OANDA:NZDJPY as price completes its transition from internal to external liquidity. The market has expanded aggressively into a premium higher-timeframe Daily Fair Value Gap (FVG - 1D), serving as a significant overhead institutional supply zone. Simultaneously, a clean, mechanical 0-A-B-C bullish sequence has met its objective precisely within the designated ABC Target box.
This C-wave expansion has successfully raided the minor external liquidity resting just above the previous structural swing high. Because institutional order flow cyclically rotates between liquidity pools, this comprehensive sweep signals that immediate upside targets are exhausted. Consequently, expectations are now set for a systemic, bearish rotation back down toward the range's lowest low.
In strict alignment with systematic risk parameters, no blind sell limit orders will be placed at the opposing C zone. The current phase is dedicated entirely to reactive observation within this premium daily FVG block. Execution will remain paused until price action delivers a secondary liquidity sweep followed by a confirmed lower-timeframe Market Structure Shift (MSS), which will serve as the mandatory trigger to short the market down to the structural target.
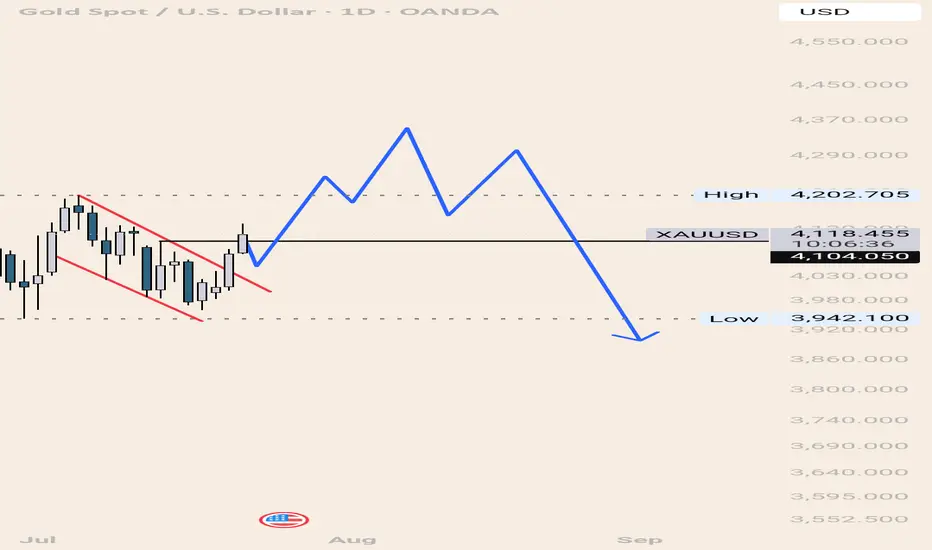
XAUUSD Roadmap: The Road to 4350 and the Long-Term ReversalGold Update
After breaking 4104 and holding above it with an 8-hour candle:
Gold targets 4243 first.
Then 4350 as a final and highly important level.
After that, I see it resuming its decline below 4000.
As shown by the blue line.
Note: This is on the daily timeframe, meaning it will take a long time for this scenario to play out.
GBPAUD Sell Trading Opportunity SpottedH1 - Strong bearish move.
Currently it looks like a pullback is happening.
Expecting bearish continuation until the two Fibonacci resistance zones hold.
If you enjoy this idea, don’t forget to LIKE 👍, FOLLOW ✅, SHARE 🙌, and COMMENT ✍! Drop your thoughts and charts below to keep the discussion going. Your support helps keep this content free and reach more people! 🚀
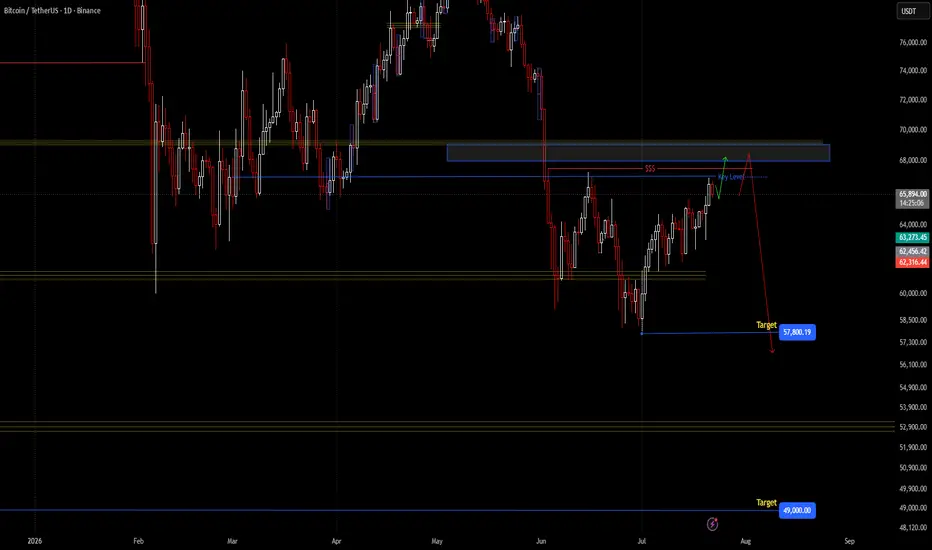
BTCBTC/USDT
Bias:
Short‑term: Bullish momentum likely to continue, with potential for a push higher before resistance.
Medium‑term (Swing): Anticipated bearish reversal once short‑term strength exhausts, setting up a swing‑trade opportunity.
Phase 1 – Short‑Term Bullishness
Look for continuation signals such as strong candles, volume confirmation, or momentum indicators turning positive.
Consider entering long positions for the short‑term move.
Manage risk with tight stops to avoid being caught in sudden reversals.
Exit once signs of exhaustion or rejection appear.
Phase 2 – Swing Bearishness
Watch for rejection patterns, weakening momentum, or bearish divergence.
Enter short positions once confirmation of reversal is seen.
Swing targets can be managed by scaling out gradually as the move develops.
Use wider stops to account for volatility in swing trades.
EURUSD | Buy-Side Liquidity Sweep Signals Bearish ContinuationEURUSD continues to present a bearish technical outlook following a buy-side liquidity sweep above the 1.14750 resistance level and the 2 July high, where price failed to sustain bullish momentum before rejecting lower. This liquidity grab suggests that buying pressure may have been exhausted, shifting the focus towards a potential continuation of the prevailing bearish structure. I will be monitoring a retracement into the highlighted retest zone, where multiple technical factors converge, including the 61.8%–88.6% Fibonacci retracement, previous market structure, and the potential alignment of the 200-period EMA as dynamic resistance. Should sellers defend this area, downside objectives remain the 13 July swing low, the current monthly low, and ultimately the previous month's support. However, a sustained 4-hour close above the liquidity sweep high would invalidate the current bearish thesis and suggest buyers have regained control.
From a fundamental perspective, this outlook is supported by the potential for continued US dollar strength should the Federal Reserve maintain a relatively restrictive monetary policy stance compared with the European Central Bank. A widening interest rate differential in favour of the United States, supported by elevated Treasury yields and resilient US economic data, could continue to underpin demand for the dollar, while softer Eurozone growth or inflation may reinforce expectations of a more accommodative ECB. Market participants should also remain attentive to upcoming high-impact releases, including US CPI, Non-Farm Payrolls, FOMC communications, and Eurozone inflation and ECB policy decisions, as these events may either reinforce or challenge the current macro narrative. While price action will ultimately determine whether this scenario develops, the technical and fundamental backdrop currently remain aligned in favour of further downside unless the stated invalidation level is reclaimed.
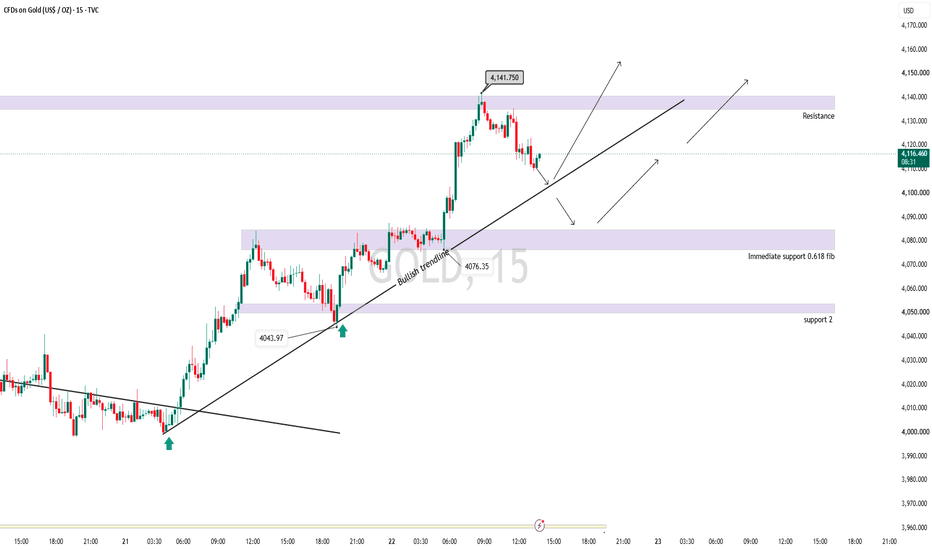
Gold(XAUUSD) outlook and trade setup for today.Price got rejected form an important resistance level of 4140, currently its retracing, the retracement might retest the horizontal support zone of 4080 and after consolidating tat that level for some more time might give a breakout on the bullish direction. Trend is very strong and there is very high chance of price continuing in upward direction.
Immediate resistance is at 4140 and support is at 4080 and below that next support is at 4045.
Outlook remain on the bullish to sideways direction, only buy trades should be preferred at support levels.
For Educational Purposes only, Not an Investment Advice, Always use strict Risk management measures.
Regards
CrazyTrades247.
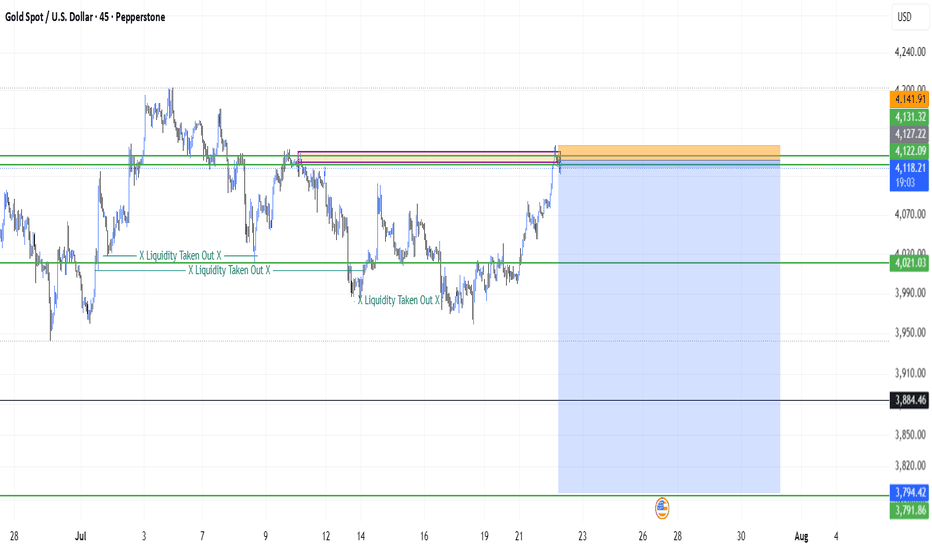
XAUUSD may be heading to $3795 - FxDollarsAnalysis -[22/07/2026]XAUUSD Short at cmp 4118, entry point was 4127
and Short limit at 4132
Stop loss at 4142
Take profit at 3795
Disclaimer:- This report is prepared for general informational purposes only and does not constitute personalized investment advice . This report includes general investment opinions such as buy, hold, or sell conclusions. All analysis is based on publicly available information and reflects the author’s independent judgment at the time of publication. The content is intended for distribution to multiple recipients and should not be relied upon for individual financial decisions. Vincent (Vishal Budhrani) is not licensed by the Hong Kong Securities and Futures Commission (SFC) to provide personalized investment advice.
#Gold #XAUUSD #MarketCrash #TradingView #FinanceNews #InvestSmart #Commodities #GoldPrice #TechnicalAnalysis