Long
Long
Short 
 Short
Short
 Long
Long
 Long
Long

BITCOIN - A distribution toward 67K before a decline?BINANCE:BTCUSDT.P has transitioned from consolidation into a distribution phase following the breakout above resistance and is now advancing toward a key resistance zone within the broader bearish trend
The fundamental backdrop remains relatively weak for the cryptocurrency market. However, spot Bitcoin ETFs have recorded inflows for five consecutive trading sessions, providing short-term support for the current rally.
From a technical perspective, Bitcoin has broken above the 65,600 resistance level, and the momentum built during consolidation could drive price toward the 67,250 resistance zone. Nevertheless, given the prevailing higher-timeframe bearish trend, this area may act as a significant barrier and halt the advance
Resistance levels: 67,250
Support levels: 65,600, 63,800, 61,800
The broader market trend remains bearish. Price is approaching the key 67,250 resistance zone, where a short squeeze could shift momentum back in favor of sellers. If bears regain control at this level, Bitcoin could reverse and resume its primary downtrend toward 65,600, 63,800, and 61,800
Best regards,
R. Linda  Short
Short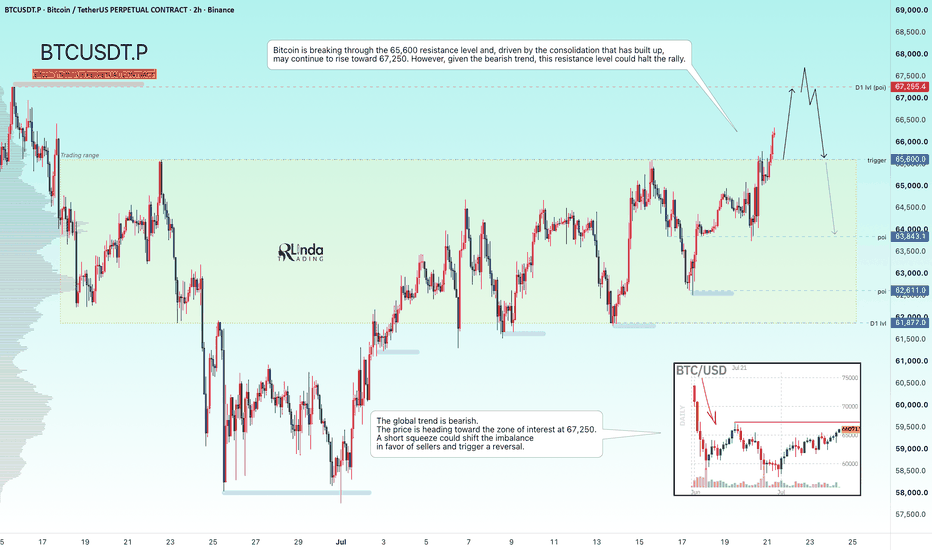
EURO STOXX 50 ($STOXX50) Daily: Testing Key EURO STOXX 50 ( ICMARKETS:STOXX50 ) Daily: Testing Key LTA Channel Support at 6,178 — Bullish Rebound vs. Deep Correction
### 🇪🇺 EURO STOXX 50 Index ( ICMARKETS:STOXX50 ) Daily Technical Framework (Ref: STOXX50_2026-07-21_09-27-32.png)
We are releasing a tactical multi-week technical study on the EURO STOXX 50 Index ( ICMARKETS:STOXX50 ) on the Daily (1D) interval. Following a corrective dip from its major high at 6,636.73, the European benchmark index is testing a critical structural boundary that defines its mid-term trend health.
The index is showing strong intraday buy-side absorption today, trading up at **6,254.80 (+0.98%)**.
---
### 🔍 Structural Architecture & Fibonacci Confluences:
Our quantitative framework highlights a pivotal decision zone defined by several overlapping layers of support and resistance:
1. **The Ascending Channel Support Floor (LTA):** Price action is directly testing the lower boundary of its ascending channel (red diagonal LTA), which has guided the primary upward structure since the April/May swing lows.
2. **Static Role-Reversal Level (6,178.17):** The 0.0 Fibonacci baseline sits squarely at **6,178.17**, matching the horizontal breakout level from March. Buyers have stepped in aggressively to defend this former resistance as new support.
3. **Overhead Fibonacci Retraction Arrays:** Immediate resistance layers above current price sit at **6,296.39 (0.236 Fibo)** and **6,353.34 (0.382 Fibo)**.
---
### 🔄 Dual Structural Scenarios:
We are tracking two distinct pathways depending on how price action resolves relative to the 6,178 support floor:
#### 🐂 Bullish Rebound Scenario (Blue Vector)
* **The Play:** As long as price sustains daily closes above the **6,178.17** baseline, the structural integrity of the ascending channel remains intact.
* **The Upside Targets:** Clearing **6,296.39** opens the path for a recovery leg toward **6,353.34 (0.382 Fibo)**, with extended target projections aiming for the upper trendline near **6,500.00** and eventually the swing high at **6,636.73**.
#### 🐻 Bearish Breakdown Scenario (Red Vector)
* **The Play:** A confirmed daily candle close below **6,178.17** will break the ascending channel to the downside.
* **The Downside Targets:** This failure will trigger a broader corrective cycle, driving price down toward the dynamic dynamic band of the **72-period SMA cluster (6,032.07 – 6,103.99)** and ultimately the institutional **200-period EMA (purple line at 5,891.54)**.
### 📊 Tactical Parameters Summary:
* **Current Bias:** Neutral-Bullish (Holding Support)
* **Primary Support Floor:** 6,178.17 (LTA Confluence)
* **Immediate Resistance Target:** 6,353.34 (0.382 Fibo)
* **Macro Invalidation (Bearish Trigger):** Daily Close below 6,178.00
---
📊 **ChartPro Data**
*European Equity Architecture, Structural Channel Dynamics & Systematic Risk Frameworks.*
⚠️ **Disclaimer:** For educational and informational purposes only. This active market study represents a personal trading framework and does not constitute financial or investment advice. Long 
ETHUSDT - The Battle for a Key Support Zone BINANCE:ETHUSDT.P is showing local bullish momentum and appears stronger than Bitcoin in the current market environment. Price action is focused on the 1800–1850 zone, where buyers and sellers are competing for control
Bitcoin remains in consolidation between 61,000 and 65,000, while the broader market trend is still bearish. The lack of both fundamental and technical support continues to weigh on the crypto market as a whole.
From a technical perspective, Ethereum has broken above resistance, confirming a short-term bullish structure. During the ongoing correction, price is respecting the local trendline while testing the 1808–1848 area of interest
Resistance levels: 1848, 1946, 1966
Support levels: 1833, 1807, 1774
The key trigger remains 1848. If bulls can establish sustained consolidation above this level, it could become the technical catalyst for a move toward 1945–1966
Best regards,
R. Linda  Long
Long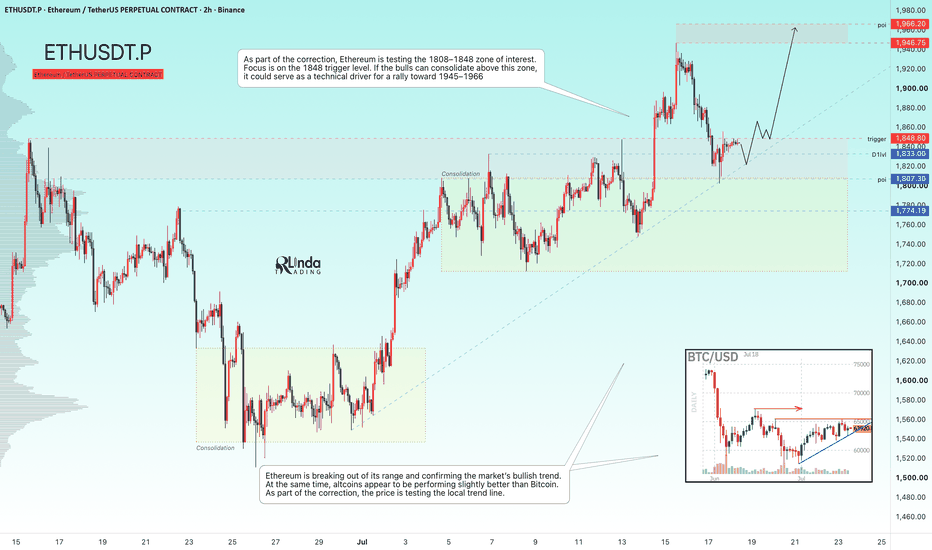
Alphabet – Can Earnings Volatility See a Range Breakout?Alphabet reports its earnings after the market close on Wednesday at a pivotal time in an on-going debate amongst retail traders and investors, over whether the AI trade is a bubble that is starting to deflate or is just taking a breather before initiating its next leg higher.
Alphabet, the owner of Google, is known as a hyperscaler, a company that operates a huge global cloud computing infrastructure. Its Google cloud platform is one of the giants powering the world’s AI, data and internet services, alongside Amazon Web Services (AWS) and Microsoft Azure. More importantly, it’s the first of these key companies to report its earnings. With traders extremely sensitive to levels of AI capital expenditure and on red alert for any signs suggesting this huge spending is starting to generate some significant returns, the outcome of this event could be important, not just for the Alphabet shares but also short-term sentiment toward the entire market.
The Alphabet share price topped at an all-time high of 404.38 on May 18th and has since been range trading between a low of 333.20 hit on June 26th and a high of 374.23 briefly seen on Thursday July 16th, before jitters resurfaced surrounding the AI model released by Chinese startup Moonshot, which saw prices drop back down to a low of 345.51 at the Friday close. However, at the start of this week, the Alphabet price has since rebounded to trade back at 353.15 ahead the company’s earnings release tomorrow.
Interestingly, with so much potential for price volatility resting on the outcome of these earnings, the technical outlook provides a key snapshot of the important levels traders may find useful to monitor, depending on how far the Alphabet results and management guidance deviate from market expectations.
Technical Update: Range Activity Builds Ahead of Earnings between 333.20 and 377.83.
The important focus for Alphabet this week is the release of its latest earnings report after the close on Wednesday and the potential for increased volatility that could result.
As the chart above shows, the earnings data could be important for the Alphabet stock price, with potential for more prolonged directional phases of price activity developing, especially as recent moves have seen prices confined within a sideways range between 333.20 (June 26th low) and 377.83 (61.8% retracement).
We discuss the technical outlook below and attempt to identify the key support and resistance levels that may become relevant if a breakout was to occur.
Potential Resistance Levels:
It appears that the Bollinger mid-average currently at 353.15 could represent the first resistance level this week. How this level is defended on a closing basis may be a gauge on short term price activity. If the Alphabet stock price was to close above 353.15 further upside strength may ensue, but while it caps prices, downside pressure may continue to materialise.
As the chart below shows, if the Alphabet share price were to close above 353.15, it could open potential to test 377.83, which may mark the upper extremes of the current sideways range. 377.83 is equal to the 61.8% retracement level calculated from the May high to June low and could be the key resistance to monitor.
If closes in price are seen above the resistance at 377.83 this week, it might suggest scope for moves to higher levels. This could shift the focus towards 389.63, which is equal to the May 27th high, even on towards 404.38, the May 18th upside extreme.
Potential Support Levels:
While the mid-average resistance at 353.15 continues to cap prices on a closing basis, the risk of further downside pressure may increase. This could shift the focus for traders toward a key support at 333.20 (June 26th session low), which could highlight the current lower range extreme.
A closing break below 333.20 may open potential for further declines to 322.85, which is the 61.8% retracement level (March low to May high). A closing break below 322.85 could see moves extend toward 309.44, which is the April 9th session low.
The material provided here has not been prepared accordance with legal requirements designed to promote the independence of investment research and as such is considered to be a marketing communication. Whilst it is not subject to any prohibition on dealing ahead of the dissemination of investment research, we will not seek to take any advantage before providing it to our clients.
Pepperstone doesn’t represent that the material provided here is accurate, current or complete, and therefore shouldn’t be relied upon as such. The information, whether from a third party or not, isn’t to be considered as a recommendation; or an offer to buy or sell; or the solicitation of an offer to buy or sell any security, financial product or instrument; or to participate in any particular trading strategy. It does not take into account readers’ financial situation or investment objectives. We advise any readers of this content to seek their own advice. Without the approval of Pepperstone, reproduction or redistribution of this information isn’t permitted.
Long 
 Long
Long
 Long
Long
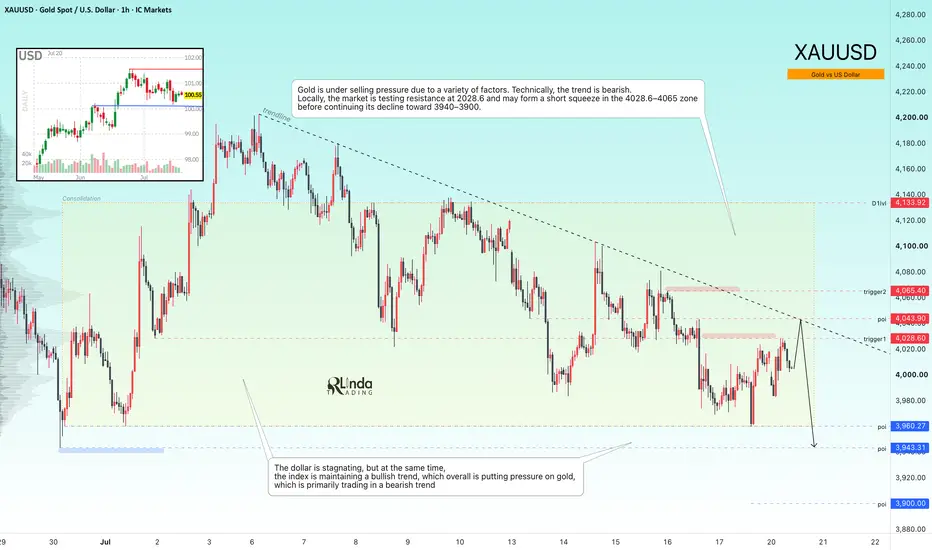
GOLD - A short squeeze before the decline continues toward 3900ICMARKETS:XAUUSD is hovering around the $4,000 mark on Monday, caught between bullish and bearish pressure as markets digest the ongoing escalation of tensions between the U.S. and Iran, while this week's U.S. economic calendar remains relatively light
The U.S. dollar remains in consolidation, although the Dollar Index (DXY) continues to maintain its broader bullish trend. Gold remains under pressure, and the daily technical outlook continues to favor the bears, limiting the potential for a sustained recovery. At this stage, there are few signs that this scenario will change in the near term.
Bearish drivers: Escalation of the U.S.–Iran conflict, supporting both the U.S. dollar and oil prices, Hawkish Federal Reserve rhetoric, Bearish technical market structure
Bullish drivers: Geopolitical de-escalation, Weaker-than-expected U.S. macroeconomic data, Profit-taking after recent declines
Resistance levels: 4028, 4043, 4065
Support levels: 3960, 3943, 3900
Gold remains under selling pressure due to a combination of technical and fundamental factors. The broader trend is still bearish. Technically, the market is confirming resistance around 4028.6, and a short squeeze into the 4028.6–4065 liquidity zone remains possible before the broader downtrend resumes toward 3940–3900
Best regards,
R. Linda Short 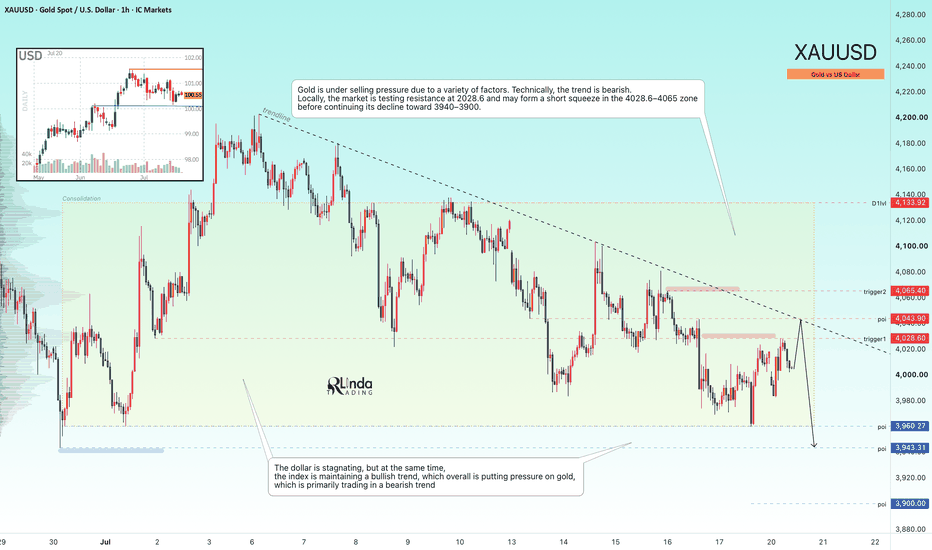
ZAMA price analysis. Pump coming sooon ... ?👀 Take a closer look at CRYPTOCAP:ZAMA Could its pump be just around the corner?
#ZAMA is still a very young project. Like many newly listed tokens, it went through a brutal 90%+ correction after launch.
Today, only about 20% of the total supply is in circulation, while the project's market cap is roughly $75M.
As for fundamentals... It's probably still too early to draw serious conclusions.
But the chart is becoming increasingly interesting.
Looking at OKX:ZAMAUSDT , it feels like the long consolidation phase is approaching its natural end.
And after long periods of accumulation, strong impulsive moves often follow.
What's even more interesting is that over the past few days, sellers haven't been able to push the price lower despite the overall weakness in the crypto market.
That makes us think the next big move could be to the upside.
📈 Our first targets are:
🟢 $0.0444
🟡 $0.051
🔴 And if momentum really builds, we wouldn't rule out a move toward $0.069.
Of course, it's just one possible scenario. The market will have the final say.
💬 What do you think? Is CRYPTOCAP:ZAMA quietly being accumulated before a breakout, or does it need more time to consolidate?
______________
◆ Follow us ❤️ for daily crypto insights & updates!
🚀 Don’t miss out on important market moves
🧠 DYOR | This is not financial advice, just thinking out loud  Short
Short
 Long
Long