AUD/JPY – Bullish Cup & HandleAUD/JPY is showing signs of a potential bullish reversal following an extended bearish trend. On the 1-hour timeframe, price has developed a well-defined Cup & Handle pattern, supported by bullish RSI divergence and a Fibonacci retracement setup.
The cup formation begins at Point A, where price established a significant swing low near 109.70 before gradually recovering towards Point B around 112.60, completing the rounded bottom structure.
Following the recovery, price encountered resistance at the neckline and started retracing, forming the handle of the pattern.
1. Fibonacci Retracement & Handle Formation
After reaching Point B, price experienced a sharp rejection from the neckline and retraced towards the 0.382 Fibonacci level, around 111.50.
The current price action suggests that buyers are attempting to defend this retracement area, with price recovering towards 111.80.
The Fibonacci retracement zone between 0.382 and 0.5, approximately 111.50–111.15, represents a potential support area for the handle formation.
As long as price maintains support within this region, the bullish continuation scenario remains technically viable.
2. RSI Divergence & Momentum Confirmation
The RSI previously developed a bullish divergence near the bottom of the cup, where price formed lower lows while RSI established higher lows, indicating weakening bearish momentum.
This divergence supported the subsequent recovery towards the neckline.
However, RSI also displayed a bearish divergence near Point B, where price pushed towards the neckline while RSI formed a lower high. This signaled weakening bullish momentum and contributed to the current retracement.
The RSI has now recovered towards the neutral 50 level, suggesting that selling pressure may be easing.
A sustained recovery above 50, followed by a move towards 60, would provide additional confirmation of improving bullish momentum.
3. Entry Strategy & Bullish Confirmation
Primary entry – Handle support
I am monitoring the 111.50–111.15 Fibonacci support zone for a potential bullish reversal.
A bullish rejection candle, higher low, or bullish engulfing formation within this region could provide an early entry opportunity.
Conservative entry – Neckline breakout
For stronger confirmation, I will wait for a decisive hourly candle close above the neckline resistance around 112.60.
A successful breakout followed by a retest of the neckline as support would strengthen the bullish continuation scenario and confirm the Cup & Handle pattern.
4. Profit Targets & Risk Management
My projected bullish targets are:
TP1: 113.12 – Initial resistance.
TP2: 114.23 – Lower boundary of the major resistance zone.
TP3: 114.90 – Upper resistance and projected pattern target.
The projected move towards 114.90 is based on the measured move of the Cup & Handle formation, extending the approximate depth of the cup above the neckline.
A sustained breakdown below the handle support would weaken the immediate bullish setup. A protective stop-loss should be positioned according to the selected entry, the confirmed handle low, and the trader's risk tolerance.
The key is to wait for bullish confirmation rather than anticipate the breakout.
#AUDJPY #CupAndHandle #ForexTrading #TechnicalAnalysis #Fibonacci #RSIDivergence #BullishSetup #PriceAction #TradingView #Sarmaaya.pk
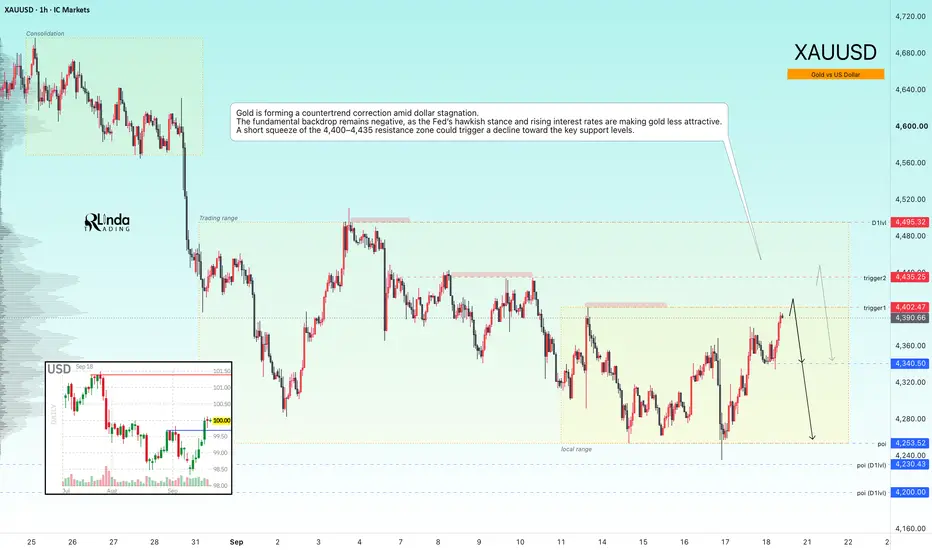
GOLD - A countertrend correction aimed at liquidity huntingICMARKETS:XAUUSD has been forming a countertrend correction toward the 4,400–4,430 liquidity zone since the session opened. The fundamental backdrop remains weak, and the market is still in a bearish trend
The dollar is stagnating after breaking through local resistance levels. The Fed’s hawkish stance and rising rates are supporting the Dollar Index, which is putting medium-term pressure on the metals market. However, the correction in oil prices is giving gold some room to recover as it tests key levels.
Gold is stabilizing, but further upside remains limited by the Fed’s hawkish outlook and geopolitical risks. The BOJ decision and developments in the Middle East will determine the short-term direction
Drivers:
Upside: further declines in oil prices and yields, de-escalation of the conflict, softer U.S. data, dovish BOJ.
Downside: escalation in the Middle East, higher oil prices, hawkish Fed stance, dollar strength
Resistance levels: 4,402, 4,435, 4,495
Support levels: 4,340, 4,253, 4,200
Gold is forming a countertrend correction amid dollar stagnation. A short squeeze of the 4,400–4,435 resistance zone — with the key focus on two triggers — could trigger a decline toward the key support levels. The formation of reversal patterns after the retest could provide a potential entry opportunity
Best regards,
R. Linda!  Short
Short
 Long
Long
 Long
Long
 Long
Long
 Long
Long
XAUUSD 4H | Gold at a Critical Resistance — Breakout or Rejectio
**Gold is currently trading inside a descending channel on the 4H timeframe.** Price has recently bounced from the lower part of the structure and is now approaching a key resistance area.
The **4,393–4,400 zone** is an important resistance level and also sits close to the **0.618 Fibonacci retracement around 4,373**. A rejection from this area could send price back toward the **4,312 support zone**.
However, if price manages to break and close above **4,393**, the bearish channel structure could weaken and the next major target would be around **4,560**, which is a significant resistance/supply area.
My primary scenario is:
**Rejection → 4,312 → reaction from support**
**Breakout above 4,393 → 4,480 → 4,520 → 4,560**
I will be watching the reaction around **4,393** very closely. A confirmed breakout or rejection from this level should provide the next directional clue.
**Key Levels:**
🔴 Resistance: **4,393 / 4,480 / 4,520–4,560**
🟢 Support: **4,312 / 4,235**
📌 Fibonacci 0.618: **4,373**
**This is my technical analysis and scenario, not financial advice. Always manage risk and wait for confirmation before entering a trade.**
 Long
Long
Short 
Monero XMR price analysisLet’s close this trading week with a look at CRYPTOCAP:XMR — the last member of the old “privacy coin trio,” whose story developed very differently from CRYPTOCAP:ZEC and CRYPTOCAP:DASH
While ZEC and DASH spent years in something close to a coma, Monero kept moving higher. Maybe part of the reason is that CRYPTOCAP:XMR was also the coin that got banned and delisted the most.
And from here we enter the territory of assumptions. 🙂
#Monero has always had a very specific audience — privacy advocates, anonymity maximalists and, let’s say, people who don’t particularly enjoy having someone looking into their transactions.
So when we say “the price was kept in shape,” there’s quite a lot you could read into that — and not everything is something people like discussing openly.
But back to the chart.
Looking at #XMRUSD, it currently seems to us that as long as price trades below $666, the probability of a fairly deep correction looks higher than the probability of continued growth.
Under what exact “sauce” Monero could theoretically lose up to 2/3 of its market cap, and whether that will happen at all — we have no idea. 🙂
But this is crypto. Sometimes the move happens first, and only then does the market find a nice explanation for it.
And if you also look at which exchanges currently account for the largest spot volumes in CRYPTOCAP:XMR , there is at least some food for thought.
💬 Do you think CRYPTOCAP:XMR continues the privacy-coin story, or is a deeper correction coming this time?
______________
◆ Follow us ❤️ for daily crypto insights & updates!
🚀 Don’t miss out on important market moves
🧠 DYOR | This is not financial advice, just thinking out loud  Long
Long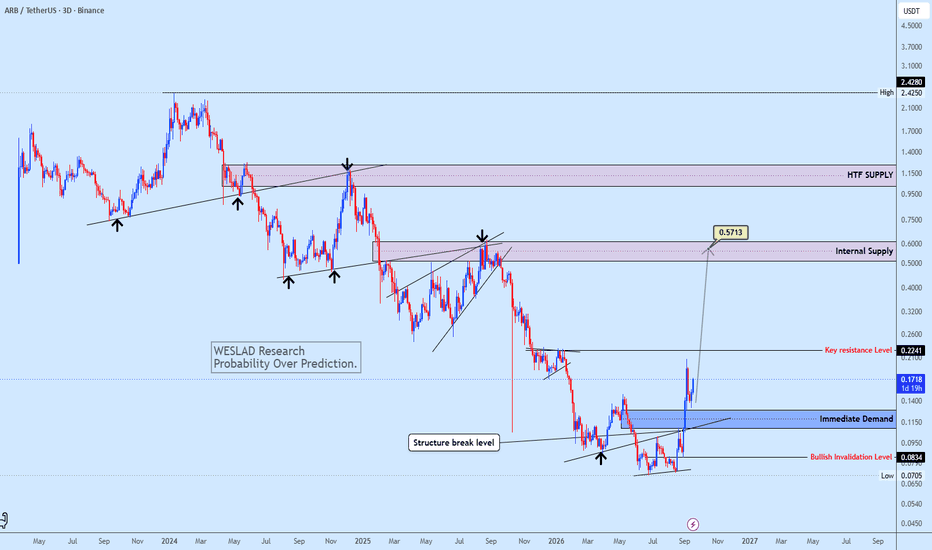
Bitcoin Surges +7% — Is $85K a Breakout or a Bull Trap?Bitcoin ( BINANCE:BTCUSDT ) has gained more than 6–7% over the past few hours, building strong bullish momentum.
However, the rally is now entering a major technical resistance structure, while recent regulatory uncertainty and mixed institutional flows remain important risks.
Can Bitcoin establish itself above $85,000, or is the current move setting up another correction?
Macro Outlook
From a fundamental perspective, downside risk has not disappeared.
Bitcoin ETF flows have recently been volatile rather than consistently bullish, while the failure of the CLARITY Act to advance in the U.S. Senate has added further regulatory uncertainty.
For this reason, the current rally still needs confirmation before a sustained bullish continuation can be assumed.
Technical Analysis
Bitcoin is currently trading inside the Heavy Resistance Zone($84,500-$79,350), near the major Potential Reversal Zone(PRZ) , the Cumulative Short Liquidation Leverage($85,400-$82,300), and the Resistance Lines.
There is also a possibility that Bitcoin could finally fill the upper CME Gap($84,560-$83,215) after several months.
From an Elliott Wave perspective, Bitcoin appears to be completing Primary Wave 5, while Primary Wave 3 developed as an Extended Wave.
A Negative Regular Divergence(RD-) is also visible between Consecutive Peaks, providing another warning that bullish momentum may be weakening.
💡 Educational Note: When Wave 5 approaches major resistance while a Negative Regular Divergence develops, the risk of trend exhaustion and a corrective move can increase.
I expect Bitcoin to first enter deeper into the Cumulative Short Liquidation Leverage and the major Potential Reversal Zone(PRZ), potentially filling the upper CME Gap.
A Bull Trap above the Heavy Resistance Zone is also possible before the next bearish move begins.
From this area, I expect Bitcoin to decline toward at least $79,000. If bearish momentum increases, the correction could extend toward the key trading level of $77,700.
Trade Setup
First Take Profit(TP): $79,000
Second Take Profit(TP): $77,700
Stop Loss(SL): $87,300(Worst)
Key Trading Level: $77,700
Upper CME Gap: $84,560-$83,215
Which level do you think Bitcoin will reach first?
🔴 $77,700
🟢 $87,300
📌 Bitcoin Analysis(BTCUSDT) Daily time frame.
🛑 Always use proper risk management and set a Stop Loss(SL) for every position.
🚀 If this analysis helps your trading plan, a BOOST would help more traders discover it. Short 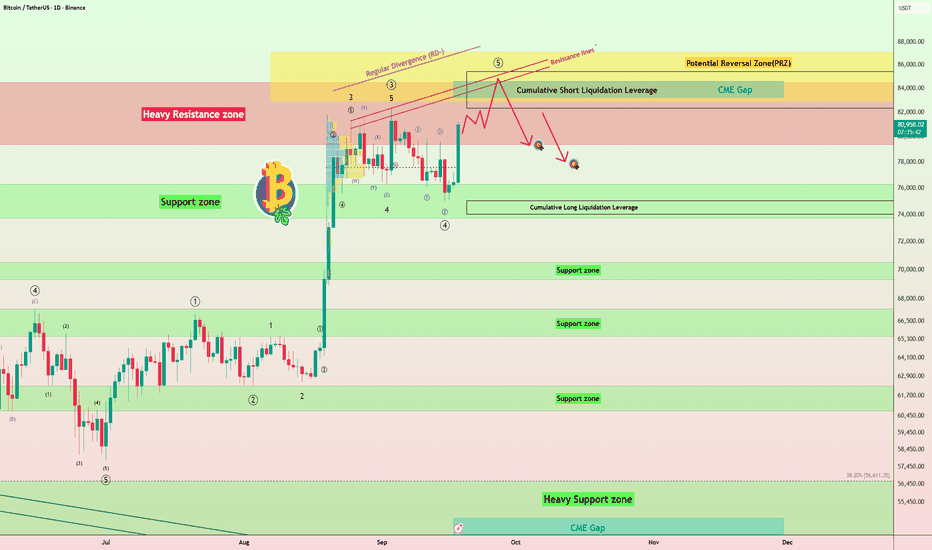
Long 
 Long
Long
EURAUD: Bullish Push to 1.639?FX:EURAUD is eyeing a bullish continuation on the 4-hour chart , with price approaching a key support zone after recent pullback, converging with a potential entry area that could ignite further upside momentum toward the higher resistance zone near the 0.786 Fibonacci level if buyers defend amid volatility. This setup suggests a solid rally opportunity with 1:3 risk-reward .🔥
Entry between 1.615–1.618 (entry from current price with proper risk management is recommended). T arget at 1.639 . Set a stop loss at a daily close below 1.611 , yielding a risk-reward ratio of 1:3 . Monitor for confirmation via a bullish candle close above entry with rising volume.🌟
Fundamentally , EURAUD is trading around 1.621 in early September 2026.
For the Euro, the most important release this week (1–4 September) is the Eurozone CPI Flash Estimate (August) on Tuesday, September 1 — a key inflation reading that can influence ECB policy expectations.
For the Australian Dollar, a major event is the Australia GDP (Q2) on Wednesday, September 2, which will provide critical insight into the strength of the Australian economy. 💡
📝 Trade Setup
🎯 Entry (Long):
1.615 – 1.618
(Entry from current price is acceptable with proper position sizing and strict risk management.)
🎯 Target:
1.639
❌ Stop Loss:
Daily candle close below 1.611
📈 Risk-to-Reward:
1:3
💡 Will buyers defend 1.615–1.618 and push EURAUD toward 1.639, or will stronger Australian growth invalidate the bullish setup? 👇 AAPL | September 18th | My Edge, Liquidity & Institutional moneyToday's AAPL review focused on understanding my edge, making sure the time frame actually fits the way I trade, and learning how to hunt for liquidity and potential institutional activity.
I started with something I've been watching on the 4-hour chart—my edge was there, and it looked strong. But I realized something important: the move I was analyzing on the 4-hour was developing more like a swing-trade idea, while I'm a day trader.
That changed the way I approached the chart.
In today's video, I covered:
Recognizing my edge on the 4-hour chart
Realizing that a good setup can still be on the wrong time frame for my trading style
Separating a swing-trade opportunity from a day-trading opportunity
Dropping into time frames that better match how I actually execute
Hunting for areas where liquidity may be sitting
Looking for clues that larger participants may be active rather than assuming every large candle is institutional money
The bigger lesson for me was that finding my edge isn't enough. I also have to find my edge in the right environment and on the right time frame.
A beautiful 4-hour setup might be useful information, but if the move requires holding for several days, that's not necessarily the trade I'm looking for. I can use that higher-time-frame signal as context and then hunt for the opportunity that fits my day-trading window.
Liquidity becomes another part of that process. I'm looking at obvious highs and lows, areas where stops may be concentrated, and places where price could be drawn toward available orders. Then I'm watching how price behaves around those areas.
And when it comes to institutional money, I'm not pretending I can see exactly who's buying or selling. I'm looking for footprints—volume, displacement, reactions around important levels, liquidity sweeps, and other clues that suggest larger orders may be involved.
That's the shift I'm working on: don't just find the setup. Find the setup, understand the liquidity around it, and make sure the trade actually fits who I am as a trader.
For context, AAPL closed Thursday at $337 after trading between $330.18 and $338.34, so today's lesson comes after a sizable recent move in the stock.
Dad Stock Joke: I found my edge on the 4-hour chart and told it I was a day trader. It said, “Sorry, I thought you were staying for the weekend.  Long
Long

Bitcoin: Stabilisation, but No Confirmed Signal YetFollowing the Fed decision, the initial risk-off reaction across markets has eased. Bitcoin has stabilised as uncertainty recedes, but the previous sell-off has not yet been fully absorbed. A firmer US dollar and continued pressure from the bond market remain headwinds.
Between June and August, Bitcoin formed a second base with an increasingly narrow trading range. The breakout in mid-August came with noticeably higher volume and pushed price back above the previous correction high, bringing it into parity with the prior short-term downtrend. That improved the picture, but it did not yet establish a confirmed trend reversal.
The breakout impulse is now being consolidated. The failed Clarity Act added pressure, but so far it has not triggered a decisive move lower. Volume has recently been less supportive, although buyers have repeatedly stepped in near the lower end of the range.
The relevant levels are clear: support around $75,500 remains intact, while the upper range boundary near $81,500 continues to cap price. As long as Bitcoin remains between these two levels, there is no directional signal.
A sustained break below $75,500 would increase the probability of a return into the former base zone between roughly $60,000 and $65,000.
A break above $81,500 would shift attention back to a potential trend reversal. The next targets would be in the $92,000 to $96,000 area, followed by the psychologically important $100,000 level.
A sustained move above $100,000 would also clear the second correction high and confirm the broader reversal. That would make advances towards $110,000 and $120,000 increasingly likely. XAUUSD: Can Sellers Push Gold Toward the 4,240 Support Zone?Hello everyone, here is my breakdown of the current XAUUSD setup.
Market Analysis
XAUUSD previously formed a Rounding Top near the highs before breaking lower and shifting bearish. Price then entered a downward channel, where multiple breakouts above the Resistance Zone were rejected and price moved back lower.
Currently, XAUUSD is trading below the 4,400 Resistance Zone while holding above the 4,240 Support Zone and respecting the downward channel. The recent rejection suggests sellers may attempt another move lower.
My Scenario & Strategy
As long as XAUUSD remains below the 4,400 Resistance Zone and respects the downward channel, the bearish scenario remains valid. A continuation lower could push price toward the 4,240 Support Zone (TP1).
However, a breakout and close above 4,400 would weaken the bearish outlook and increase the possibility of further upside.
That’s the setup I’m tracking. Thank you for your attention, and always manage your risk. Short 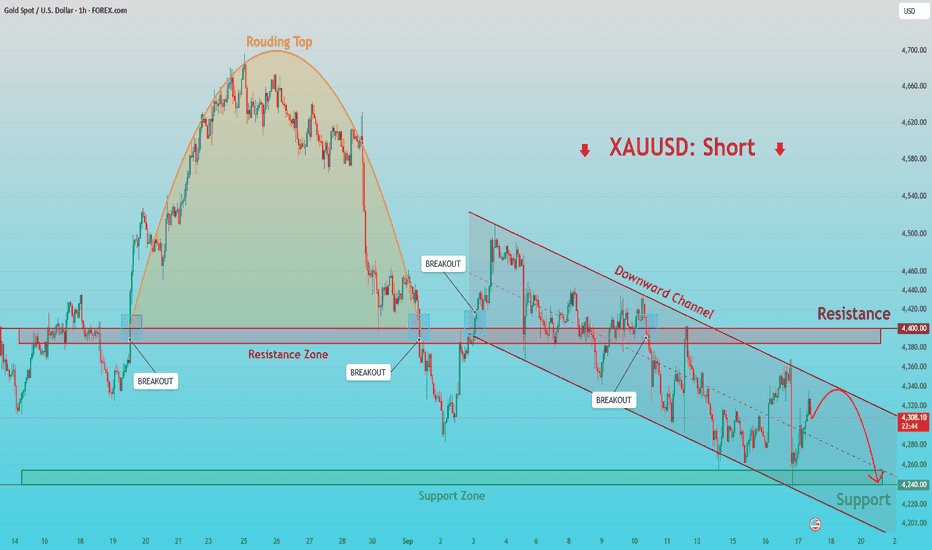
Long 
Bank of Japan Raises Interest Rates to 1.25%! The Bank of Japan raised its interest rate by 25 basis points to 1.25% on Friday, September 18, marking its highest level since 1995. The decision was approved by a 7–2 vote, with Board members Toichiro Asada and Ayano Sato dissenting.
The BoJ justified its decision by pointing to the risk of inflation exceeding its 2% target. The move also represents a clear acceleration in the pace of monetary policy normalization, as it came only three months after the previous increase, compared with six-month intervals between earlier moves.
Nevertheless, the yen weakened following the decision instead of appreciating, while the yield on Japan’s 10-year government bond declined by approximately five basis points to 2.947%.
The reason behind this apparent contradiction is that markets had already priced in the rate increase almost entirely. The yen had gained more than 2% during September and reached 155.28 against the US dollar on September 3—its strongest level since early August—supported by hawkish comments from Board members and expectations of potential government intervention.
When the decision matched expectations, investors began unwinding their long-yen positions in a classic example of “buy the rumour, sell the news.”
Technical Analysis
USD/JPY is trading within an upward trend on the four-hour timeframe, forming a sequence of higher highs and higher lows while repeatedly breaking above previous swing highs marked by the black horizontal lines.
During the latest wave, the price exceeded its previous high and formed a new higher high at 157.851, confirming the continuation of bullish momentum.
By applying the Fibonacci retracement tool from the latest higher low at 155.303 to the latest higher high at 157.851, the price may experience a corrective decline towards the demand zone highlighted by the green rectangle.
This area coincides with the 78.6% Fibonacci retracement at 155.848 and the 88% level at 155.609. The zone could attract renewed buying pressure and push the pair back towards its upward trend, provided that bullish momentum remains intact.
The key support level to monitor is 155.303, representing the latest higher low. As long as the price remains above this level without forming a new lower low, the bullish scenario remains the most likely.
However, a close below 155.303 would weaken the bullish outlook and open the door to a broader corrective decline.

 Long
Long